Sold Half CTSH. Raised Stops to Break Even.Trading Fam,
I feel that we are closing in on a local top here in the U.S. stock market for a while. My target on Cognizant Tech. may have been too aggressive above that 200 SMA and 350 SMA so, I've decided to sell half, capture any profits that I have, and raise my stops to break even on the remainder of this position. You know where to catch the remainder of my open positions.
This last move takes my portfolio up to 86% profit on the year. We've have closed the last 17 exits as profit with an average profit of almost 30%. Congrats to all those who have been following me and my new indicator over the past year. We've done well and I expect more to come, though, we may have to start looking at some shorts at this time.
✌️Stew
Stocktrading

UPS Breakout & Retest – Long Spot OpportunityNYSE:UPS has broken above the key $90 resistance level, indicating a potential shift in trend. This level may now act as support, offering a textbook retest setup. We’re watching closely for a pullback to confirm $88.00–$90.00 as a buy zone for a possible long entry.
🎯 Entry Zone: $88.00–$90.00
📈 Targets:
• TP1: $103.00–$111.00
• TP2: $122.00–$138.00
🔻 Stop Loss: Below $85.00
If price holds the $90 zone with bullish confirmation (volume, wick rejections, etc.), this could be a strong continuation setup. As always, risk management is key – keep an eye on broader market sentiment and earnings-related moves.

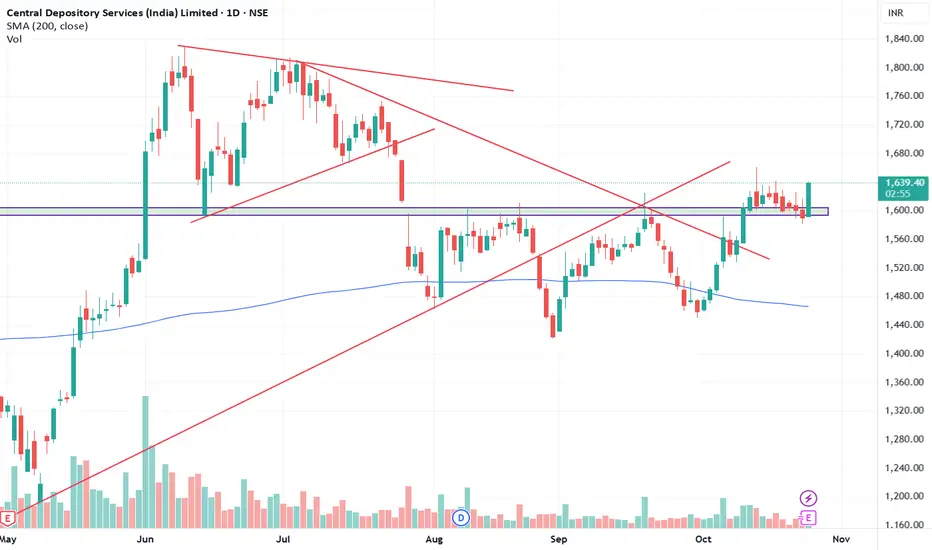
CDSL Analysis📈 Current Stock Price
Price: ₹1,633.20
Change: +₹43.00 (+2.70%)
Previous Close: ₹1,590.20
Day’s Range: ₹1,592.00 – ₹1,633.20
52-Week Range: ₹1,047.45 – ₹1,989.80
Market Cap: ₹33,523.6 Crore
PE Ratio (TTM): ~69
Dividend Yield: ~0.79%
📊 Recent Financial Highlights (Q1 FY26)
Revenue: ₹2.95 Billion (↑2.88% YoY)
Net Income: ₹1.02 Billion (↓23.72% YoY)
EPS: ₹4.90 (↓23.68% YoY)
Net Profit Margin: 34.68% (↓25.87%)
📉 Stock Performance & Sentiment
YTD Performance (2025): -35%
1-Year Return: +8.98%
5-Year Return: +630.49%
Analyst Sentiment: Mixed – some recommend Buy with a 1-year target of ₹1,850, while others caution due to recent earnings decline and slowing demat account growth.
📌 Key Insights
Strengths: Strong long-term growth, zero debt, high return on equity, and robust market position.
Concerns: Recent drop in earnings, slowing growth in new demat accounts, and market volatility.
Technical Indicators: Stock is trading above its 200 DMA, indicating a bullish long-term trend.
I am not sebi registered not providing any recommendation only analysis
The Most Important Investment Lesson Everyone Should Know🟡 The Most Important Investment Lesson Everyone Should Know
When inflation constantly reduces the value of your money, the smartest strategy isn’t timing the market — it’s consistency.
📈 Allocate part of your monthly income into gold, stocks, or Bitcoin as long-term savings.
Those who practice this discipline will likely reach financial independence within the next 20 years.
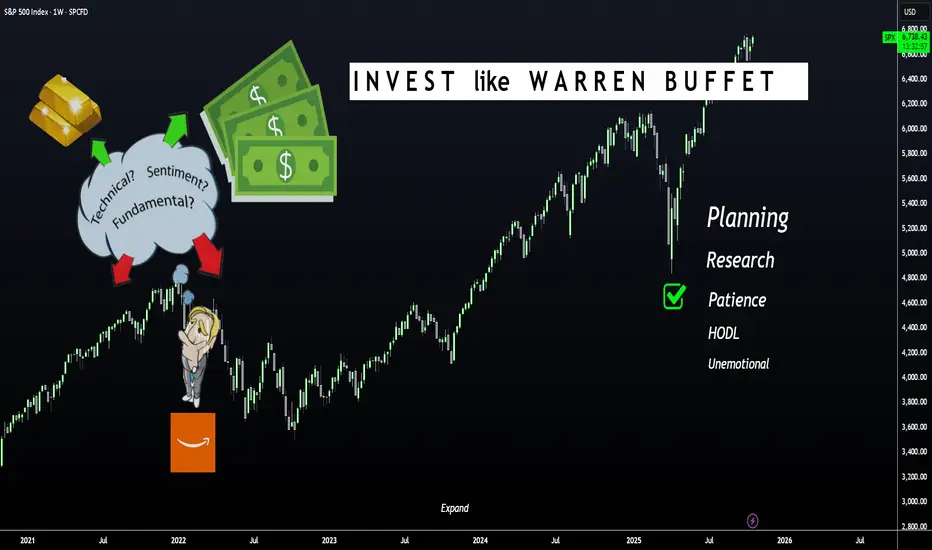
LEARN to INVEST Like Warren BuffetHello Stock Traders and Speculators 📈📢
If you trade and or watch stocks, commodities and/or ETF's then this one is for you!
Warren Buffett is probably one of the most successful investors of all time. Over the years, he has developed a set of principles and strategies over his career. He was inspired by the teachings of key financial thinkers like Phil Fisher, Benjamin Graham and Charlie Munger.
Phil Fisher
Fisher’s approach focusses on quality companies with long-term growth potential, emphasizing focused portfolios and long-term holdings. He believed in gathering information about a company beyond what’s readily available. His lessons on maintaining a focused portfolio and committing to long-term holdings are clear influences on Buffett’s patient, value-driven investment philosophy.
Benjamin Graham
Known as the father of value investing, Graham’s core principle was to buy stocks at a price lower than their intrinsic value, creating a margin of safety (MOS). This strategy helps mitigate risk and increase the likelihood of future gains. Buffett absorbed Graham’s teaching on finding stocks that are undervalued and buying them at the right price— definitely a large contributor of his investment success.
Charlie Munger
Munger is Warren Buffett’s long-time business partner. He introduced the concept of economic moats, which refers to a company’s long-term, sustainable competitive advantages. Munger advocates investing in businesses that can fend off competition and maintain profitability over time. This philosophy drives Buffett’s focus on companies with strong market positions and solid long-term potential, favoring these over shorter-term, speculative opportunities.
Buffett's Investment Approach
1 - Buy for the Long Term. Buffett’s strategy emphasizes identifying companies that can consistently perform well over long periods. He holds stocks for years, or even decades, often looking for opportunities where other investors may overlook value.
2 - Buy at the Right Price. Buffett is known for his discipline in waiting for the right moment to invest. His approach ensures he doesn’t overpay, instead seeking stocks when they are priced below their true value, maintaining a margin of safety.
3 - Buy the Right Stocks. Buffett doesn’t just buy cheap stocks, he buys quality companies with sustainable advantages. His goal is to invest in firms with strong business models that will continue to perform well regardless of market conditions.
Warren Buffett emphasizes investing in companies with simple and clear business models, ones that fall within his circle of competence. He prefers to thoroughly understand the operations, products, and long-term prospects of a company before making any investment.
This principle is combined with in-depth analysis of how the company operates and how sustainable its valuations and future growth prospects are. If a business model is too complex or outside his expertise, he avoids it.
He prioritizes companies with integrity and transparency in their management. He believes in backing leaders who are passionate, have strong vision and execution capabilities and who use shareholder funds wisely. Trusting management to run the company effectively, with efficiency and accountability, is critical for long-term success in Buffett’s eyes.
Investing in quality companies isn’t enough—Buffett also insists on buying them at attractive prices. He maintains a strict discipline of buying with a margin of safety, ensuring the price paid is lower than the company’s intrinsic value. This means waiting for opportunities to buy great businesses at fair prices rather than settling for fair businesses at attractive prices, which may not perform well over time.
Buffett has made many of his lessons and strategies available to the public through his letters to shareholders and partnership letters. These documents offer insight into his investment approach, decision-making process, and lessons from both successes and failures. There are several key books that capture Buffett’s life, philosophy, and strategies in greater detail:
📚Warren Buffett’s Ground Rules
📚The Warren Buffett Way
📚Buffett: The Making of an American Capitalist
📚The Warren Buffett Portfolio
📚The Snowball: Warren Buffett and the Business of Life
Each of these resources provides a comprehensive look into the mind of one of the most successful investors of all time. Personally I've read Buffett: The Making of an American Capitalist by Roger Lowenstein and it is fantastic.
I could be wrong! Why stocks could go higher.Trading Fam,
It has been a whole year of testing my AI-crafted indicator, and I am learning to trust it more and more as I go. We recently reached my third and final target on the SPY. I sold. Did I sell too early. Possibly. If I was to wait for my indicator, I'd still be in long positions. Let's take a look at what my incredibly accurate indicator is telling us.
✌️Stew

COIN at Support – Looking for a Year-End RallyWe’re closely watching the crypto market for a potential bottom over the next two weeks, with expectations of a recovery into year-end. This broader momentum could translate into a strong rebound for Coinbase NASDAQ:COIN , which often moves in sync with the crypto space. Price has now reached a key support zone, which could serve as the foundation for a bullish reversal.
Currently, COIN is trading around $310–$320, a zone where previous buying interest has emerged. I'm looking for price to stabilize and confirm support here before entering a long spot trade. If this support holds, it could open the door to a multi-leg rally into the end of the year.
🛠 Trade Setup
Entry: $310–$320
Take Profit Targets: $360–$390 and $415–$440
Stop Loss: Below $303

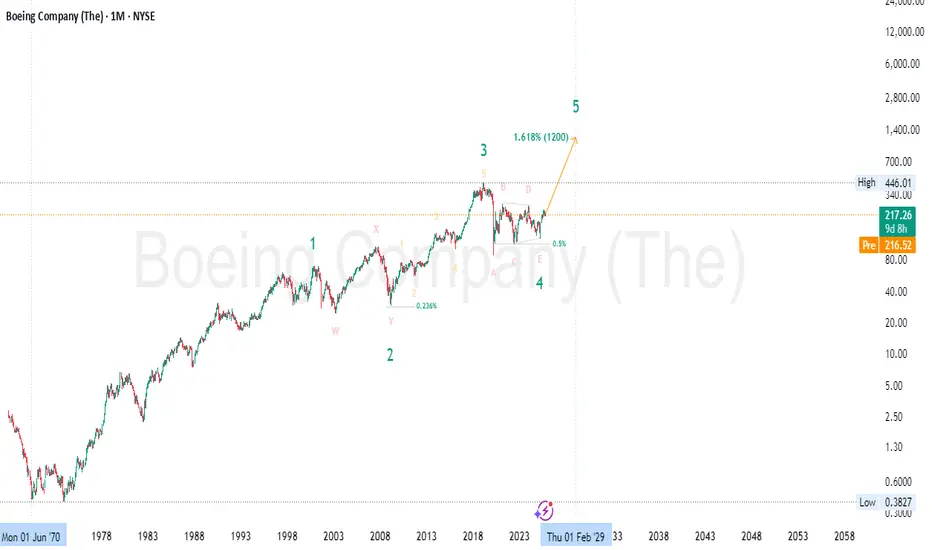
Boeing (BA) – Final Leg of Macro Bull Run✈️ Boeing (BA) – Final Leg of Macro Bull Run | Wave 5 to 1.618 Extension ($1200) 🚀
📅 Timeframe: Monthly (Macro Cycle Outlook)
📍 Current Price: $217
🎯 Wave 5 Target : ~$1200 (1.618 Extension)
🌀 Wave Theory Structure
Boeing appears to be entering Wave 5 of a long-term Elliott Wave cycle:
✅ Wave 1: Multi-decade rise until the early 2000s
✅ Wave 2: Complex correction (W–X–Y) into 2009 lows
✅ Wave 3: Powerful rally through 2019, completed with an extended 5-wave subdivision
✅ Wave 4: A large-scale triangle correction (ABCDE) — now completed, as price has broken structure upward
🚀 Wave 5: Projected move toward the 1.618 Fibonacci extension (~$1200) from the 1–3 wave distance
This is a textbook impulsive wave structure playing out on the monthly macro scale — with a final bullish leg now unfolding.
📐 Fibonacci Confluence
Wave 2 retraced ~0.236 of Wave 1 (shallow, bullish corrective behavior)
Wave 4 retraced ~0.5 of Wave 3 — typical for triangle patterns and expanded flats
Wave 5 target at 1.618 Fib extension measured from Wave 1–3 aligns around $1200 , completing the 5-wave macro cycle 🔺
🧠 Smart Money Concepts (SMC)
🔹 Accumulation Phase (2020–2024): After COVID crash and multi-year consolidation, price has shown strong accumulation characteristics
🔹 Final Sweep of Lows (E leg) flushed out late longs and retail stops before institutional re-entry
🔹 Break of Structure (BOS) confirms transition from reaccumulation to markup phase 📈
🔹 Price is now in a reprice phase — a classic SMC trait where value is rapidly adjusted after institutional positioning completes
📊 Price Action Analysis
Bullish breakout from triangle structure
Monthly higher low established at E-wave base
Strong bullish candle from demand zone — early confirmation of trend continuation
Break above $260 would open clean skies toward the next major resistance at ATH ($446) and beyond 🧭
💼 Fundamental Outlook
Boeing is regaining strength after multiple challenging years:
✈️ Rebound in global aviation demand
📦 Growing defense & aerospace contracts amid rising geopolitical tensions
💰 Expected recovery in cash flows, backlog, and profitability
🌐 Expansion in space and unmanned systems (future growth verticals)
Although regulatory and delivery risks remain, Boeing’s turnaround story is gathering steam — aligning with the technical forecast of Wave 5 acceleration.
🔍 Summary
Boeing is entering what could be the final and most explosive leg (Wave 5) of its macro Elliott Wave cycle. Key confluences include:
✅ Elliott Wave triangle completion
✅ Fibonacci 1.618 extension to ~$1200
✅ Institutional accumulation confirmed
✅ Price Action breakout from multi-year structure
✅ Improving long-term fundamentals
This setup favors long-term swing positions , with pullbacks offering buying opportunities until the final cycle target is approached. 🧠📈
⚠️ Disclaimer: This is not financial advice. For educational purposes only. Always do your own due diligence and manage risk responsibly. 🛡️
#Boeing #BA #ElliottWave #SmartMoney #PriceAction #Fibonacci #Wave5 #TriangleBreakout #TechnicalAnalysis #LongTermInvestment #MacroTrading #StockMarket #BullishOutlook #Aerospace #WaveTheory #SwingTrading #AviationRecovery #FibonacciTargets #TradingStrategy
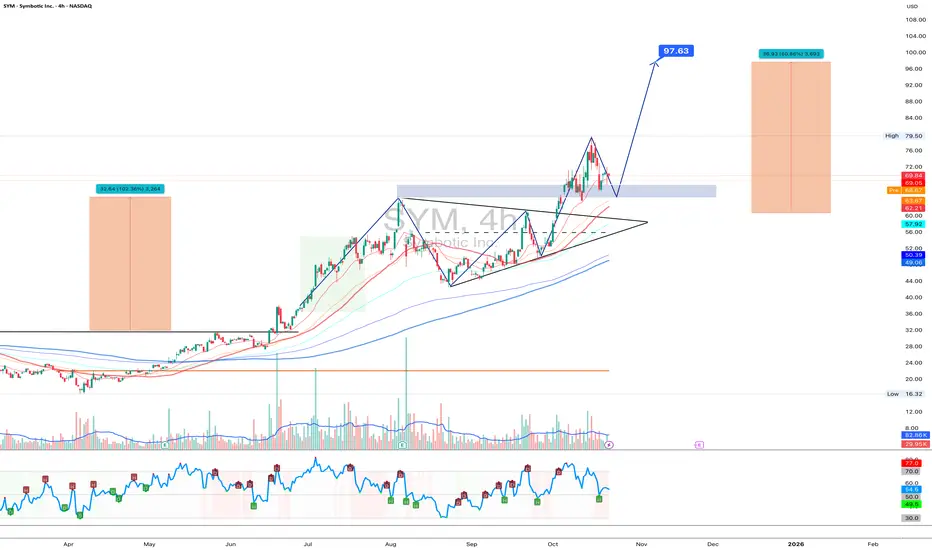
SYM 1D - AI with a real upgrade?Symbotic Inc. shows a clean setup: after a strong rally and breakout from a triangle, the stock is now retesting the $68–70 support zone. The 50-day moving average aligns perfectly here, strengthening the buyers’ defense.
If this level holds, the bullish structure stays intact. The first target sits around $79.50, and the second - at $97.63, matching the prior measured move. A dip below $68 could trigger a deeper pullback toward $62 before buyers regroup.
On the fundamental side, Symbotic keeps expanding its robotic warehouse automation systems - a sector still booming thanks to the AI wave. After a 100%+ rally this year, the stock deserves a coffee break before the next sprint.
Tactical plan: watch $69 carefully - if buyers defend, the uptrend continues; if not, give the robots a reboot and wait for the next entry.
General Motors (GM) Shares Hit All-Time HighGeneral Motors (GM) Shares Hit All-Time High
As shown on the General Motors (GM) stock chart:
→ During yesterday’s intraday session, the share price climbed above $67.40, surpassing the previous record high set in January 2022.
→ GM was among the top performers on the stock market, rising by around 15%.
The sharp rally followed the company’s strong third-quarter results:
→ Revenue: $48.6 billion (versus analysts’ forecast of $45.0 billion).
→ Earnings per share: $2.80 (consensus forecast: $2.28).
→ Vehicle sales: 710,000 units in Q3, up 8% year-on-year.
Moreover, General Motors Co. delivered an upbeat outlook, stating that continued business optimisation and its decision to scale back electric vehicle production should help improve financial performance in the year ahead.
Technical Analysis of GM Stock
Since 2024, price fluctuations have shaped a rising channel (shown in blue), with the current price moving into its upper half. The rally from the 2025 lows has formed a steeper upward trajectory (solid orange lines), highlighting strong buying momentum.
Further bullish signals include:
→ A decisive bullish gap through the $60 psychological level, which also corresponds to the 2024 peak.
→ The pullback (marked by the blue arrow) occurred on declining trading volumes on the NYSE, suggesting a shortage of selling pressure.
→ The reversal from the $55 level resembles a bear trap, potentially signalling accumulation by institutional investors (see also the Liquidity Grab pattern).
On the other hand, the rapid advance has led to:
→ The RSI indicator entering overbought territory.
→ The price moving above the upper solid orange line.
This leaves GM shares vulnerable to a short-term correction.
However, sustained optimism driven by strong fundamentals could maintain bullish momentum, potentially pushing the price higher towards the following resistance area:
→ The $70 psychological level;
→ The upper boundary of the blue channel;
→ The dashed orange trendline.
This article represents the opinion of the Companies operating under the FXOpen brand only. It is not to be construed as an offer, solicitation, or recommendation with respect to products and services provided by the Companies operating under the FXOpen brand, nor is it to be considered financial advice.

S&P 500 (ES1!): Wait For Valid Buy Setups!Welcome back to the Weekly Forex Forecast for the week of Oct. 20-24th.
In this video, we will analyze the following FX market: S&P 500 (ES1!)
The S&P500 is ranging. More neutral than bullish. But Friday's bullish close indicates potential bullish order flow going into this week.
If price can manage to trade above the Monthly Open at 6,725, than buys become valid.
I'm not interested in selling this market, unless I see a sure enough bearish BOS.
Enjoy!
May profits be upon you.
Leave any questions or comments in the comment section.
I appreciate any feedback from my viewers!
Like and/or subscribe if you want more accurate analysis.
Thank you so much!
Disclaimer:
I do not provide personal investment advice and I am not a qualified licensed investment advisor.
All information found here, including any ideas, opinions, views, predictions, forecasts, commentaries, suggestions, expressed or implied herein, are for informational, entertainment or educational purposes only and should not be construed as personal investment advice. While the information provided is believed to be accurate, it may include errors or inaccuracies.
I will not and cannot be held liable for any actions you take as a result of anything you read here.
Conduct your own due diligence, or consult a licensed financial advisor or broker before making any and all investment decisions. Any investments, trades, speculations, or decisions made on the basis of any information found on this channel, expressed or implied herein, are committed at your own risk, financial or otherwise.

APPLE/AAPL Stock: Movement Scenarios and Key Reaction PointsThese are all the key stock levels for Apple that are fully and precisely displayed in the image – including supports, resistances, and potential reaction points for traders NASDAQ:AAPL

S&P 500 Index Near Key Resistance – Correction Ahead?Recently, the S&P 500 ( SP:SPX ) has seen some sharp moves with high momentum due to the tariff tensions between the US and China over the past couple of weeks. These moves have also impacted other correlated markets like cryptocurrency .
In the past day, news came out that Trump is planning to meet the Chinese president on October 31st . With markets opening, the S&P 500 started to rise and is currently moving near a Resistance zone($6,734_$6,690) and close to its Resistance lines .
From an Elliott Wave perspective, it seems that the S&P 500 is completing a microwave 5 of the main wave C , and the corrective structure looks like an Regular Flat(ABC/3-3-5) .
I expect that in the coming hours, the S&P 500 index could drop at least to around $6,641(First Target) .
Second Target: $6,611
Stop Loss(SL): $6,735
Note: The $6,641 level is quite important in the context of the recent rally and could act as both support and resistance for the S&P 500.
A possible decline or fall in the S&P 500 index could also cause Bitcoin to decline (due to Bitcoin's high correlation with the S&P 500 index in recent weeks).
Please respect each other's ideas and express them politely if you agree or disagree.
S&P 500 Index Analyze (SPX500USD), 1-hour time frame.
Be sure to follow the updated ideas.
Do not forget to put a Stop loss for your positions (For every position you want to open).
Please follow your strategy and updates; this is just my Idea, and I will gladly see your ideas in this post.
Please do not forget the ✅' like '✅ button 🙏😊 & Share it with your friends; thanks, and Trade safe.

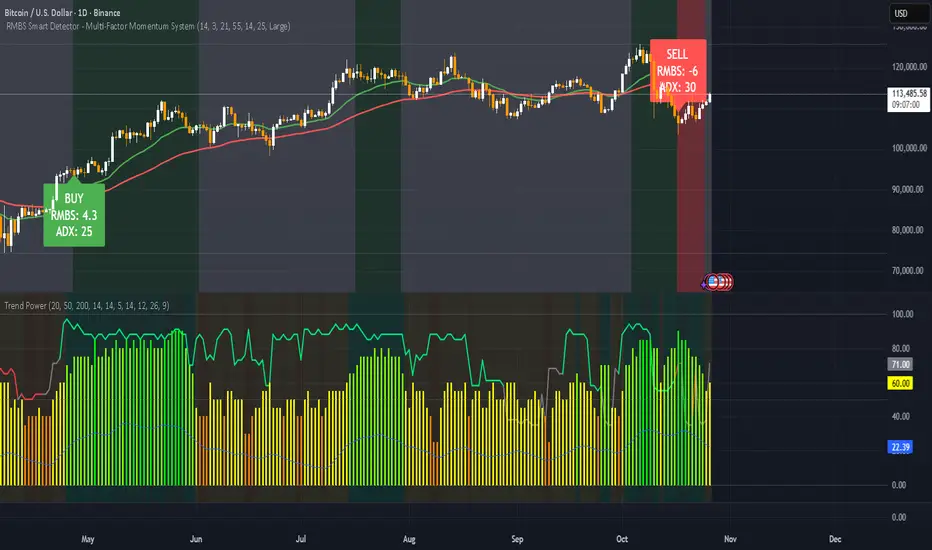
Mr. Wyckoff Is That You? (Pt II) & Pi Cycle Top Trendline on BTCHey Trading Fam,
As the Donald keeps the market gambling and scrambling, I want to step away from the headlines a bit and take a closer look at what our charts might be suggesting. Admittedly, the bias indicated may be somewhat contrarian at the moment. If you're not into that, this video is probably not for you.
It feels like an echo chamber out there with most analysts. Everyone keeps yelling, "Buy the dip! Buy the dip!" But what about a more cautious approach? Maybe it was time to sell the top and preserve your cash? I don't know. Just throwing it out there.
As many of you are aware, we've reached my third and final target on the SPY. I've been talking about 670-700 on the SPY for a couple of years now. It's been hit, and personally (though I am cautiously still trading publicly), I've exited. My goal is to preserve my cash. Maybe I do this through precious metals? Haven't decided yet. But I am happy with the profit I've made to this point and will probably not test fate too much further.
As for crypto, old Bitcoin usually follows our stock market. And we have tracked the SPY for that part. If the market does, in fact, pull back further, I would expect Bitcoin and all of crypto to follow.
I know, I know. But what about that altcoin season? I don't know guys. That may not actually start until next year. I'm not saying this will be the case for sure. But more and more, it sure is looking that way.
Enjoy the vid,
✌️Stew

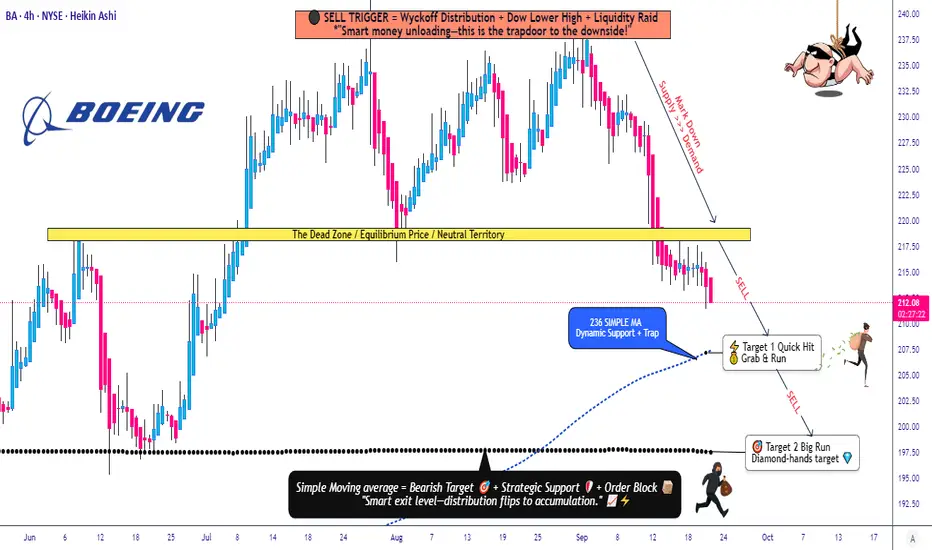
Boeing (BA) Technical Outlook: Is Downside Momentum Building?✈️ BA "BOEING COMPANY" | Cash Flow Management Strategy (Swing/Day Trade)
📉 Plan: Bearish Setup
This analysis follows the Thief Strategy 🕶️ — a layering method of multiple sell-limit orders across different levels.
🔑 Trade Plan
Entry (Layered Sell Limits):
220.00
218.00
216.00
214.00
(You can increase/decrease limit layers based on your own preference)
Stop Loss: 227.00 (⚠️ Thief SL)
Note: Dear Ladies & Gentleman (Thief OG’s) 🙌 this SL is just my own preference. Please manage your risk your own way.
Targets 🎯
TP1 → 207.00
TP2 → 197.00
Note: Targets are my reference points. You can book profits at your own choice, anytime.
📊 Key Points & Correlation
Boeing (BA) often reacts to aviation sector news ✈️ and macroeconomic cycles 📉.
Watch related pairs for correlation / sentiment clues:
AMEX:SPY (S&P 500 ETF) – BA is a Dow & SPX component.
TVC:DJI (Dow Jones Index) – Direct BA weighting.
NYSE:LMT (Lockheed Martin) – Sector peer correlation.
SKILLING:AIR.PA (Airbus SE) – Competitive aviation stock in Europe.
A slowdown in air travel demand, defense spending shifts, or broad market weakness may enhance bearish momentum.
🧠 Strategy Style Reminder
This is the Thief Layering Strategy → scaling into positions step by step with multiple limit orders, not rushing into full size at once. It’s a patient cash flow management approach.
✨ “If you find value in my analysis, a 👍 and 🚀 boost is much appreciated — it helps me share more setups with the community!”
⚠️ Disclaimer: This is Thief Style Trading Strategy — just for fun & educational purpose. Not financial advice. DYOR & manage risk.
#BA #Boeing #Stocks #DayTrading #SwingTrading #LayeringStrategy #ThiefStyle #SPY #DJI #LMT #Airbus #StockMarket
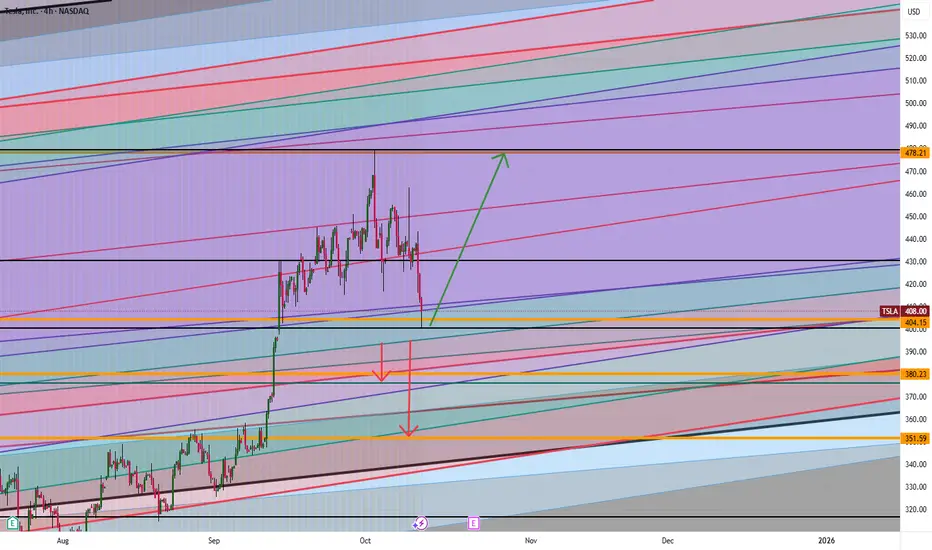
Tesla: Will It Blast Off or Fall Fast? The $404 Level Is the KeyTesla is at a big “make or break” point. If the price stays higher than $404, it could blast up to $437 or maybe even $478. But if Tesla drops below $404, watch out! It could fall down to $380 or even as low as $351.
Think about it:
What would you do if Tesla started moving toward those numbers? Do you think it will go up or will it go down?
If you’re not sure or have a question, send me a message! Sometimes asking one good question can help you make a smarter trade. What do you want to know about Tesla right now?
Mindbloome Exchange
Earnings Season Kicks Off with Strong Bank ResultsEarnings Season Kicks Off with Strong Bank Results
On 3 October, we noted growing optimism in equity markets ahead of the corporate earnings season. That sentiment was validated yesterday as several major banks reported results that exceeded analysts’ expectations, helping the S&P 500 index (US SPX 500 mini on FXOpen) rebound from last Friday’s sell-off.
Morgan Stanley (MS) led the rally, with its shares hitting a new all-time high above $166 following a robust quarterly report:
→ Revenue surged to a record $18.2 billion, up 18% year-on-year.
→ Earnings per share (EPS): actual $2.80, vs forecast $2.10.
Technical Analysis of Morgan Stanley (MS)
Price action in MS shares allows for the construction of an upward channel (shown in blue) that has been forming since the summer.
→ Yesterday, a wide bullish gap appeared on the chart.
→ The price advanced into the upper half of the channel, breaking above the $160 psychological level.
From a bullish perspective:
→ The breakout from a bullish flag pattern supports the scenario of a resumed uptrend within the channel.
→ The channel median, reinforced by the $160 support, could serve as a key level going forward.
However, there are several bearish signals to note:
→ Intraday price swings formed a wide up-and-down movement, resembling a bearish engulfing pattern that could develop further in today’s session.
→ The brief and shallow breakout above the previous high suggests a bull trap.
The RSI indicator also shows signs of bearish divergence, implying that:
→ The recent surge in MS shares may have prompted some long holders to lock in profits near record highs.
→ Despite strong fundamentals supporting long-term growth, the stock could be vulnerable to a short-term correction, potentially towards the bullish gap area.
This article represents the opinion of the Companies operating under the FXOpen brand only. It is not to be construed as an offer, solicitation, or recommendation with respect to products and services provided by the Companies operating under the FXOpen brand, nor is it to be considered financial advice.

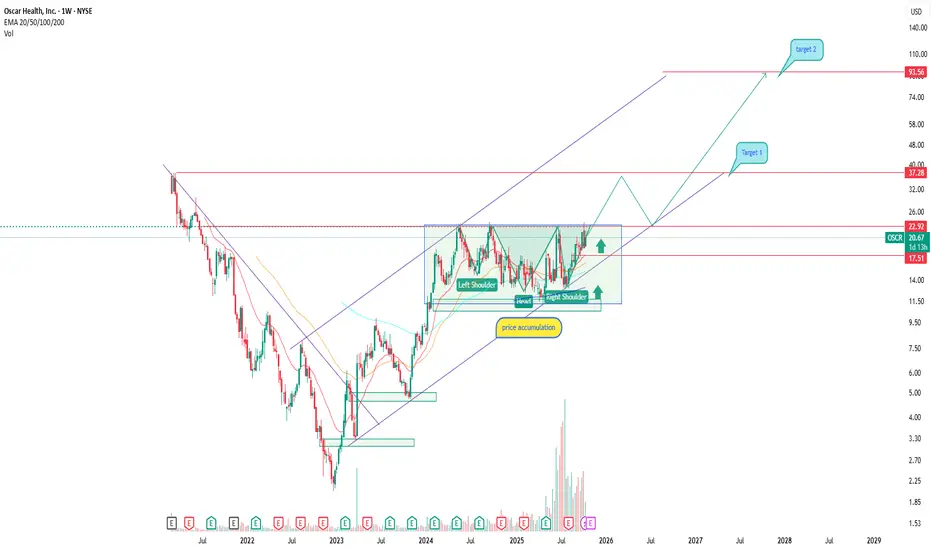
OSCR breakout from accumulation and start of a new trendOscar Health (NYSE: OSCR) is emerging as one of the more interesting names in the U.S. healthcare insurance sector. After an extended accumulation phase, the stock has broken out and is now trading above its major EMAs (50/100/200), confirming a structural shift toward a bullish trend.
The pattern resembles an inverse head and shoulders, with the 17.50–20.00 area acting as strong base support. A confirmed breakout above this zone sets the stage for a move toward 37.78 (Target 1) and potentially 93.55 (Target 2) — the upper boundary of the mid-term ascending channel.
Fundamentally, The company continues to grow its customer base and improve margins after strategic restructuring. Its shift toward tech-driven insurance solutions and partnerships with major healthcare providers strengthen its position. Recent earnings reports show narrowing losses and revenue stabilization — a sign of operational progress.
This looks like the early stage of a longer recovery cycle: the market is moving out of accumulation, but confirmation above 20.00–25.00 is crucial. As always — stay disciplined and trade by structure, not emotion.
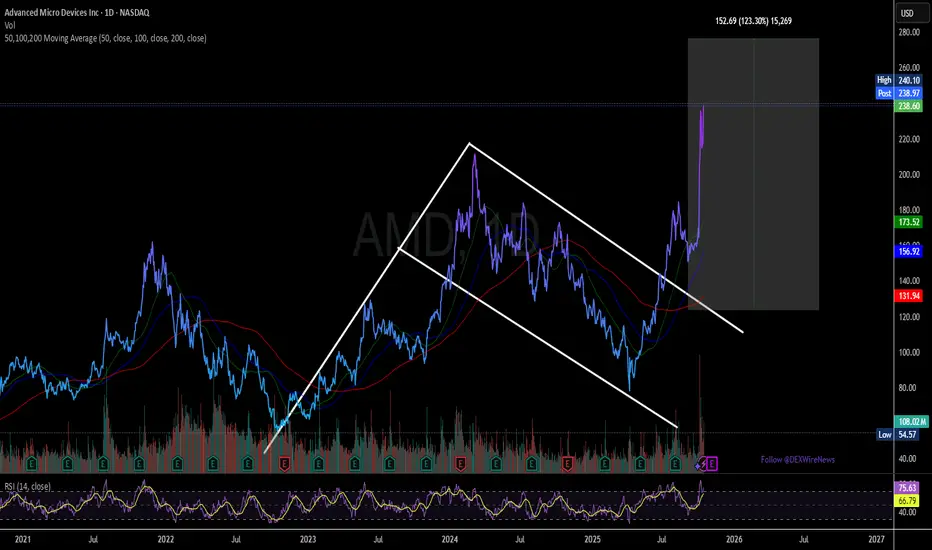
Advanced Micro Devices Stock Broke Out of a Bullish Flag TodayThe price of Advanced Micro Devices, Inc. (NASDAQ: NASDAQ:AMD ) has broken out of a falling wedge pattern gaining roughly 9% today. With the daily price chart showing a golden cross pattern the stock is poised to reach the $270 pivot and beyond amidst growing interest.
The surge reflects recent optimism about AMD’s expanding role in the AI chip market, fueled by new partnerships, including a significant deal to supply chips to Oracle’s cloud infrastructure and collaborations with AI leaders like OpenAI.
Moreover, the investors’ confidence is also boosted by recent positive commentary by analysts, who also raised their price targets on AMD stock.
About Advanced Micro Devices, Inc.
It operates in three segments: Data Center, Client and Gaming, and Embedded. The company offers artificial intelligence (AI) accelerators, x86 microprocessors, and graphics processing units (GPUs) as standalone devices or as incorporated into accelerated processing units, chipsets, and data center and professional GPUs; and embedded processors and semi-custom system-on-chip (SoC) products, microprocessor and SoC development services and technology, data processing units, field programmable gate arrays (FPGA), system on modules, smart network interface cards, and adaptive SoC products.
Fiserv: Slips Below SupportFI shares have recently continued to move as anticipated, further into our green long Target Zone between $147.45 and $119.30. We primarily expect ongoing sell-offs within the current wave (B), with its low likely to form near the lower boundary of this range. Once this low is established, the final wave (C) of the magenta three-part structure should begin, driving price significantly higher and completing the larger green wave . As a result, the green Target Zone continues to present opportunities for short- to medium-term long entries to capitalize on the upcoming (corrective) upward move. Depending on individual risk tolerance, long positions can be protected with a stop 1% below the lower edge of the zone.

RKLB Next target is 65.60Rocket Lab showed good strength to end the week last week, finally closing above the recent downtrend line. Next structure target would be 65.60, with partial profits being taken at key fibonacci levels along the way. The thesis changes is we break 34.

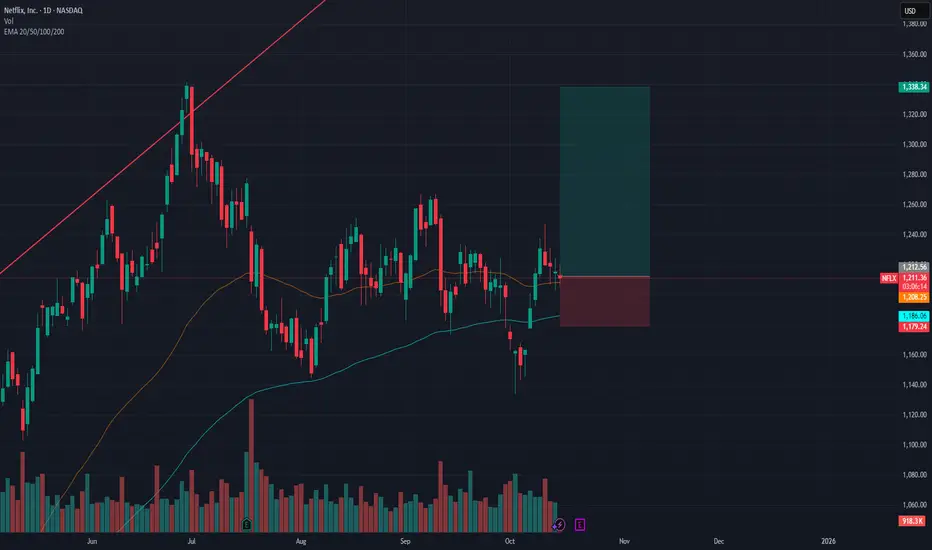
NETFLIX PERFECT LONGNASDAQ:NFLX On the daily TF has committed a large sweep of liquidity, then has broken the previous swing high and is now consolidating bullishly towards the daily 50ema, where I am looking for a reaction to the upside. At the lowest there could be a spike down to the 50fib on a fast retracement, so SL below. But rejection of 4hr 50ema and 100ema is telling that the move is ready to happen and likely not to retrace back down much further. I am targeting the previous long term highs as a tp.
I feel confident in this entry, the price action is clean. Bollinger band volatility confluence is missing which is my only hesitation, however with the price action being as strong as it is, I am more than willing to make the entry.
Time to short Nvidia - Key levels Longs and shorts In this video I have created a simple idea that gives you a easy invalidation for a short as well as
pinpointing some key regions as to where we can set alerts and patiently wait for strong reaction zones for the long side provided we get the structure shift that I am looking for .
Tools used TPO chart, Fibs, Channels ,
