META Platforms Chart – Technical Reversal Signals Sell Momentum🎯 META's Bearish Heist: Time to Rob the Bears' Bank! 💰
📊 Asset Overview
META PLATFORMS, INC - The social media giant is about to get socially distanced from higher prices!
🔍 Market Analysis
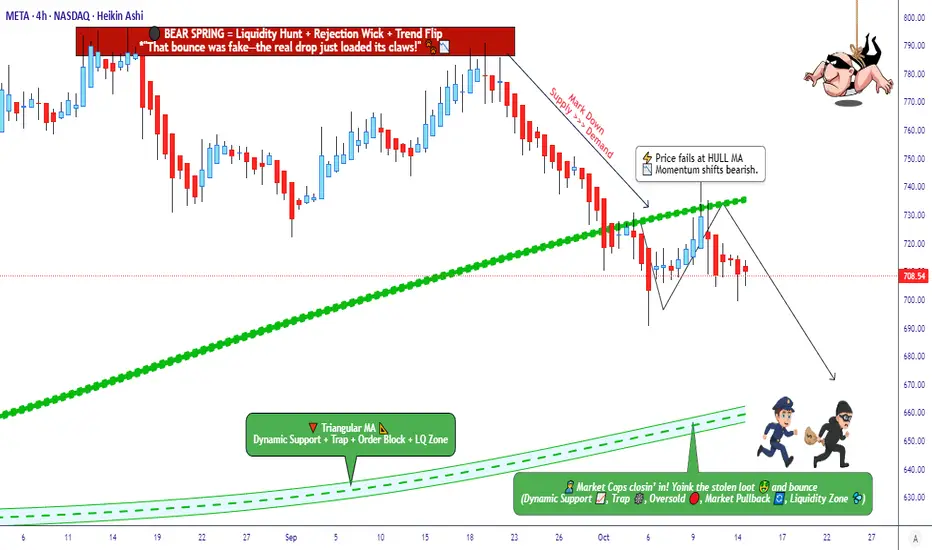
Current Setup: Bearish Momentum Confirmed ⚠️
The Hull Moving Average just broke down like my New Year's resolutions! 🐻 Bears have grabbed the steering wheel and they're driving this bus downhill. The technical setup is screaming "SHORT" louder than your stop loss alerts at 3 AM.
🎭 The "Thief Strategy" Game Plan
🎯 Entry Strategy: Layer Like a Pro
The Layered Limit Order Approach (because catching falling knives is for amateurs!)
Layer 1: $740 🎯
Layer 2: $730 🎯
Layer 3: $720 🎯
Layer 4: $710 🎯
You can add more layers based on your risk appetite and portfolio size. Think of it as building a profit sandwich - the more layers, the tastier! 🥪
Alternative: Direct market entry at current price levels (for the adrenaline junkies among us)
🛡️ Risk Management
🚨 Stop Loss: $760
⚠️ IMPORTANT NOTE: Dear Thief OG's (Ladies & Gentlemen),
This is MY stop loss level based on my risk tolerance. This is NOT a recommendation - you MUST set your own stop loss based on YOUR risk management rules. Trade at your own risk, secure your own bag! 💼
🎯 Profit Target
💎 Target: $660
Why $660?
✅ Triangular Moving Average acting as Fort Knox-level support
✅ Oversold conditions brewing like a perfect storm
✅ Bull trap zone where buyers might step in
✅ Technical barricade stronger than a police checkpoint 🚓
⚠️ IMPORTANT NOTE: Dear Thief OG's,
This is MY take profit level. You can exit whenever you want - secure those gains at YOUR comfort zone. Take profits when you're happy, not when I tell you! Your money, your rules. 💵
📈 Related Pairs to Watch
Keep your eyes on these correlated assets:
🔗 NASDAQ:GOOGL - Fellow tech giant showing similar bearish pressure
🔗 NASDAQ:AAPL - Tech sector leader; weakness here confirms broader tech selloff
🔗 NASDAQ:MSFT - Big tech correlation play
🔗 NASDAQ:AMZN - FAANG/Magnificent 7 correlation
🔗 NASDAQ:QQQ - Nasdaq ETF; META's moves often mirror tech sector sentiment
Key Correlation: When META sneezes, social media stocks catch a cold! Watch NYSE:SNAP and NYSE:PINS for sympathy plays.
🎪 The Thief Style Philosophy
This isn't your grandpa's trading strategy - we're playing chess while others play checkers! ♟️ The "Thief" approach uses strategic layering to maximize entry opportunities while managing risk like a boss.
Remember: We're not thieves in the literal sense - we're just stealing profits from the market inefficiencies! 😎
📊 Technical Summary
✅ Hull MA Breakdown Confirmed
✅ Bearish Momentum Building
✅ Multiple Technical Resistance Overhead
✅ Risk-Reward Ratio Favoring Shorts
✨ If you find value in my analysis, a 👍 and 🚀 boost is much appreciated — it helps me share more setups with the community!
#META #MetaPlatforms #StockMarket #SwingTrading #DayTrading #TechnicalAnalysis #BearishSetup #ShortSetup #HullMovingAverage #ThiefStrategy #LayeredEntry #RiskManagement #TradingStrategy #StockTrading #MarketAnalysis #TradingIdeas #TradingView #FAANG #TechStocks #BearishMomentum
Stocktrading
Broadcom Shares Surge Nearly 10% on OpenAI Partnership NewsBroadcom (AVGO) Shares Surge Nearly 10% on OpenAI Partnership News
Last month, news of a partnership with OpenAI served as a powerful bullish catalyst for NVIDIA (NVDA) shares. In October, a similar effect can be seen on the Broadcom (AVGO) chart.
According to media reports, the two companies have been collaborating for 18 months but are now making their partnership public. Their plans for 2026 include launching chip racks developed by OpenAI and based on Broadcom technology.
The rally in AVGO shares was further supported by:
→ President Trump’s conciliatory tone following his earlier remarks about imposing 100% tariffs on Chinese goods;
→ the prospect of a meeting between the Chinese and US leaders in South Korea at the end of October, as announced by US Treasury Secretary Scott Bessent.
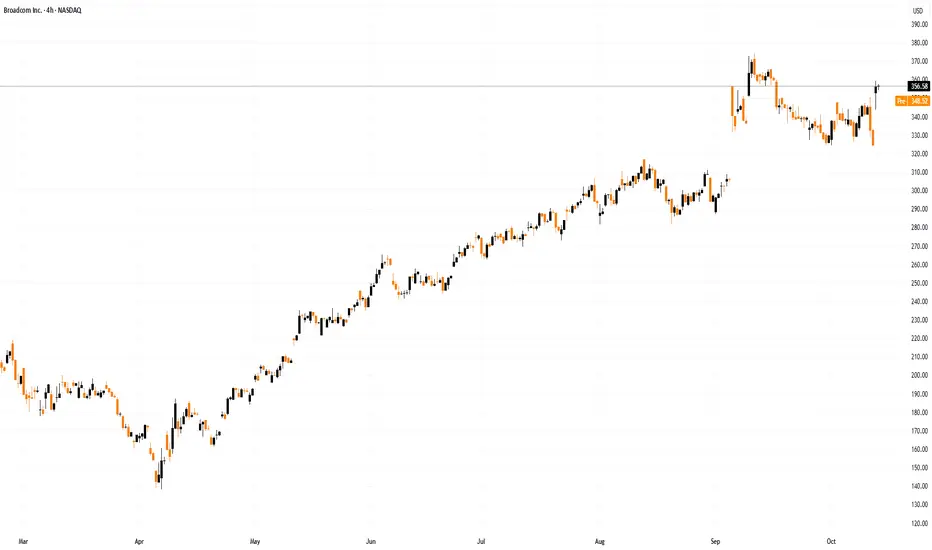
Technical Analysis of Broadcom (AVGO)
Price movements in mid-2025 formed an upward channel (shown in blue). A strong earnings report in September triggered:
→ a bullish gap at the beginning of the month;
→ an extension of the channel, with the historical high (B) sitting near its upper boundary.
From a bullish perspective:
→ the price remains within the channel, confirming its validity;
→ the pullback to October lows following the A→B impulse can be viewed as a standard correction consistent with classic Fibonacci ratios of 0.5–0.618;
→ yesterday’s rally may represent a breakout of a bullish flag (shown in red) and an attempt to resume the upward trend;
→ within this context, the $315–325 zone appears to be key support for the bulls, while the 10 October low (marked with an arrow) may prove to be a bear trap.
From a bearish perspective:
→ in pre-market trading today, AVGO shares are slightly lower, suggesting the initial reaction may have been overly emotional;
→ the psychological $350 level continues to act as resistance — previous attempts to break above it have failed to hold.
If yesterday’s rally fails to gain traction, it could indicate underlying weakness in AVGO shares, which were unable to capitalise on strong fundamentals to sustain the bullish trend seen earlier in 2025.
This article represents the opinion of the Companies operating under the FXOpen brand only. It is not to be construed as an offer, solicitation, or recommendation with respect to products and services provided by the Companies operating under the FXOpen brand, nor is it to be considered financial advice.
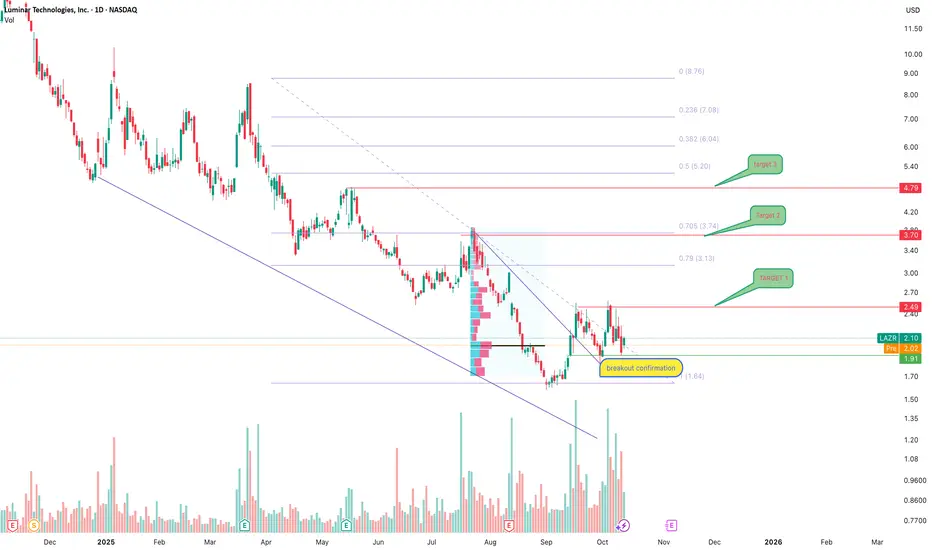
LAZR trend breakout and early recovery phaseLuminar Technologies (NASDAQ: LAZR) is showing the first signs of trend reversal after a prolonged decline. On the daily chart, the price broke the descending trendline and confirmed a breakout around the 1.90–2.00 zone, where accumulation started.
Technically, the 2.00–2.10 area acts as base support.
As long as the price stays above this level, the upside targets are 2.49 (TP1), 3.70 (TP2), and 4.79 (TP3) — all aligned with key Fibonacci levels. Rising volume supports the bullish bias.
From a fundamental perspective, Luminar remains a major player in the lidar industry, with partnerships including Volvo and Mercedes-Benz. Despite short-term pressure from higher rates, operational improvements and scaling could strengthen margins in the medium term.
This setup looks like an early recovery stage — the sentiment shifts slowly, but sustained support above 2.00 is the confirmation needed. Emotions aside — we wait for structure and confirmation.
JD: Looking for an up move/wave.From a technical point of view and based on WTW Concept, JD looks like it will go up after the completion of the needed structure.
We Trade Waves
WTW Team
Disclosure: We are part of Trade Nation's Influencer program and receive a monthly fee for using their TradingView charts in our analysis.
Is Procter & Gamble Setting Up for a Strong Bullish Reversal?🚨 P&G Bullish Master Plan: Steal Profits with the Thief Strategy! 🤑
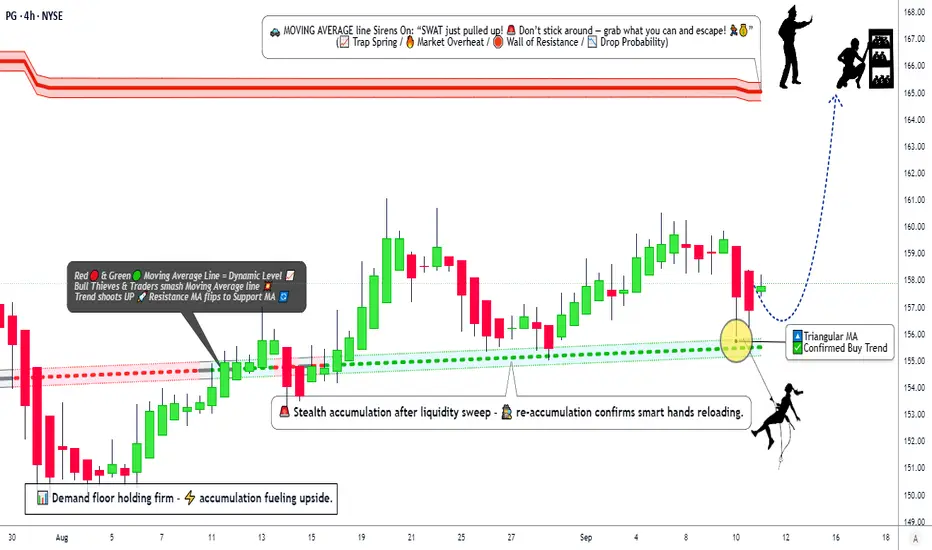
📊 Asset: Procter & Gamble (PG) – Swing/Day Trade Setup📈 Date: September 11, 2025🎯 Plan: Bullish Triangular Moving Average Pullback – Confirm the Buy Trend!
🕵️♂️ Why the Thief Strategy for PG?
The Thief Strategy is a clever, layered limit-order approach designed to capitalize on PG’s bullish momentum while navigating market traps. Backed by technical signals, solid fundamentals, and a cautious market sentiment, this plan aims to sneak in profits before the “police barricade” (resistance) stops the rally.
Here’s why PG is ripe for a steal:
Technical Edge 🧠: PG’s price action shows a bullish pullback within a triangular moving average setup, signaling a continuation of the buy trend.
Fundamental Strength 💪: PG’s robust balance sheet and consistent dividends make it a defensive powerhouse, even in uncertain markets.
Market Sentiment 😊: Retail traders are bullish, while institutions remain cautious, creating a contrarian opportunity for savvy thieves.
Fear & Greed Index 😨: At 39 (Fear), the market’s caution suggests undervaluation, a prime setup for a bullish swing.
📈 PG Stock Snapshot – September 11, 2025
💰 Price Overview
Daily Range: $157.05 - $158.18
Previous Close: $157.35
Market Cap: $372.16B
Yearly Range: $149.91 - $180.43
😊 Investor Sentiment
Retail Traders: 51.6% Bullish 🟢 (Positive buying momentum)
Institutional Traders: 49.3% Bearish 🔴 (Cautious, mixed outflows)
Overall Mood: Neutral, leaning slightly bearish due to institutional caution
😨 Fear & Greed Index
Current Level: 39 (Fear) 😟
Insight: Indicates cautious market sentiment, with fear slightly dominating greed, suggesting potential undervaluation for contrarian traders.
📈 Fundamental Score: 7.6/10 ✅
Strengths: Strong liquidity, operational efficiency, and reliable dividends.
Concerns: Inventory turnover (60.62 days), negative cash flow growth (-8.77% YoY).
🌍 Macro Score: 6.8/10 ⚖️
Tailwinds: Stable consumer goods demand supports growth.
Headwinds: Tariff policies and geopolitical tensions may pressure global sales. Fed’s steady rates (4.25%-4.50%) could squeeze margins.
🐂🐻 Market Outlook: Neutral (Hold) ⚖️
Bull Case: Strong fundamentals, retail buying, and dividend reliability support long-term stability 🟢.
Bear Case: Institutional outflows and macro uncertainties suggest short-term caution 🔴.
🎯 Key Takeaway: PG is a solid long-term investment with strong fundamentals, but short-term caution is advised due to mixed sentiment and macro risks. Monitor upcoming earnings and tariff developments. 🚨
🕵️♂️ Thief Strategy: Bullish Plan for PG
Plan Overview: Use a layered limit-order strategy to “steal” profits on PG’s bullish pullback within a triangular moving average setup. This approach maximizes entries while managing risk in a volatile market.
📥 Entry:
Layered Limit Orders: Place multiple buy limit orders at $156.00, $157.00, $158.00, and $159.00 to capitalize on pullbacks.
Flexibility: Adjust layers based on your risk tolerance and market conditions. Choose any price level within the $156–$159 accumulation zone for entry.
Why? The triangular moving average pullback confirms bullish momentum, with support at $156–$159 aligning with Fibonacci clusters and institutional buying zones.
🛑 Stop Loss:
Thief SL: Set at $154.00 to protect against a breakdown below key support.
Note: Adjust your stop loss based on your risk tolerance and strategy. The $154 level is a suggestion, not a mandate—manage your risk wisely, Thief OGs!
🎯 Target:
Primary Target: $165.00 (strong resistance zone).
Why? $165 aligns with the first resistance level and overbought conditions, where a “trap police barricade” may halt the rally. Take profits early to escape with your stolen gains!
Note: Set your own take-profit levels based on your strategy. Don’t blindly follow the $165 target—secure profits at your discretion.
⚠️ Risk Management:
Use tight risk management with layered entries to average into positions.
Consider partial profit-taking at $160 and $165, holding runners for $172 if momentum sustains.
Monitor macro developments (e.g., tariffs, Fed policy) for potential volatility.
🔍 Technical Breakdown: Why Bullish?
Triangular Moving Average: PG’s price is respecting a bullish TMA structure, with a recent pullback confirming support at $156–$159.
Fibonacci Alignment: The $156–$159 zone aligns with a key Fibonacci cluster, reinforcing the buy zone.
Momentum Indicators: Stochastic RSI is in the bullish zone, and Rate of Change (ROC) shows increasing buying interest.
Institutional Confluence: Institutional models signal a buy with a $159.98 target, supported by technical exhaustion of the recent correction.
🧠 Why This Plan Works?
Technical Precision 🎯: The TMA pullback and Fibonacci confluence provide a high-probability setup for a bullish swing.
Sentiment Edge 😊: Retail bullishness (51.6%) contrasts with institutional caution (49.3% bearish), creating a contrarian opportunity for short-term gains.
Fundamental Backbone 💪: PG’s 7.6/10 fundamental score highlights its resilience as a consumer staple, ideal for defensive plays.
Macro Awareness 🌍: Despite tariff risks, stable consumer demand supports PG’s long-term stability, making it a safe bet for swing/day trades.
Fear & Greed Advantage 😨: A Fear reading of 39 suggests undervaluation, aligning with Warren Buffett’s “be greedy when others are fearful” philosophy.
💸 Related Pairs to Watch ( AMEX:USD )
Monitor these pairs for correlated market moves:
AMEX:XLP (Consumer Staples Select Sector SPDR Fund): Tracks consumer staples like PG. Bullish XLP supports PG’s upside.
NYSE:KO (Coca-Cola): Another defensive staple with similar market dynamics.
NYSE:WMT (Walmart): Retail giant tied to consumer goods demand.
AMEX:GLD (Gold): Safe-haven asset for macro risk hedging.
✨ “If you find value in my analysis, a 👍 and 🚀 boost is much appreciated — it helps me share more setups with the community!”
#TradingView #PG #Bullish #ThiefStrategy #SwingTrading #DayTrading #TechnicalAnalysis #FearAndGreed #ConsumerStaples #StockMarket
⚠️ Disclaimer
This analysis is for educational purposes only and does not constitute financial advice. Trading involves risk, and past performance does not guarantee future results. Always conduct your own research and manage risk according to your financial circumstances.
S&P 500 - GRAND MARKET OUTLOOKS&P 500 - GRAND MARKET OUTLOOK BY FIBCOS
This analysis integrates multiple layers of market interpretation, combining Elliott Wave Theory across Supercycle , Macro , Micro , and Sub-Micro degrees with Smart Money Concepts (SMC) , price action behavior, and Fibonacci retracements/extensions to project the S&P 500 ’s long-term trajectory. It captures how institutional capital rotates through accumulation and distribution phases, aligned with macroeconomic cycles, policy shifts, and investor sentiment. Each wave is grounded in historical and forward-looking fundamental events—from post-war booms to financial crises to the current AI-driven tech surge. The use of Fibonacci ratios (1.618, 3.618, 5.618) provides mathematical confluence for wave targets, while price structure confirms the ongoing impulsive behavior. Altogether, it creates a cohesive, multi-dimensional forecast expected to culminate in a Supercycle Wave (III) top around Q1 2029 , with an S&P 500 target between 20,000(20K).
🌀 Supercycle Wave (III) — The Final Ascent (1942–2029*)
🌍 SUPERCYCLE STRUCTURE: The Multi-Generational Bull
We are inside Supercycle Wave (III) which began in 1942 and is unfolding in 5 Macro Impulse Waves . Each of these macro waves has further Micro and Sub-Micro waves. As of 2025, we're in the final stretch of this grand cycle, specifically:
👉 Sub-Micro Wave ③ of Micro Wave ⑤ of Macro Wave ⑤ of Supercycle Wave (III)
Final top expected in Q1 2029 , around the 20,000 (20K) zone 📍
🧭 MACRO WAVE TIMELINE (Supercycle III)
🔹 Macro Wave ① (1942–1968): 🌟 Post-War Industrial Renaissance
Fundamentals:
WWII victory → economic dominance
Baby boom, suburbanization, auto and housing expansion
Bretton Woods system established USD supremacy 💵
Smart Money Insight:
Institutional capital rotated from war manufacturing into consumer goods, construction, and tech foundations
Price Action: Strong impulsive move with clean higher highs/lows
Fibonacci Insight: Laid the base for 1.618 extension targets
Ends in 1968 with rising inflation and Vietnam drag
🔹 Macro Wave ② (1968–1974): 🌪️ Stagflation Storm
Fundamentals:
Vietnam War expenditures
Gold standard broken (1971 Nixon shock)
Oil embargo, inflation > growth
Price Action: Deep correction, volatile chop, broad distribution
SMC Insight: Institutions exited cyclicals, quietly accumulated future outperformers (tech, defense)
Fibonacci: 0.236% retracement of Super Cycle Wave ii
🔹 Macro Wave ③ (1974–2000): 🚀 Tech & Financialization Explosion
Fundamentals:
Reaganomics & deregulation
PC revolution, Internet birth, globalization 🌐
Explosion in derivatives, S&P futures, ETFs
SMC: Institutions accumulated during 70s lows, fueled tech IPO boom (Apple, Microsoft)
Price Action: Violent rallies with accelerating slope — classic 3rd wave behavior
Fibonacci: Extended well beyond 4.618% of Macro ① & ② — true power wave
🔹 Macro Wave ④ (2000–2009): 🌊 Dot-Com + Financial Crisis Correction
Fundamentals:
Dot-Com bust ➜ $5T in lost value
9/11 shocks & Iraq war
GFC: Housing bubble → global banking collapse
Price Action: Double top structure (2000 & 2007), multi-leg correction
SMC Insight: Smart money cashed out in 2000 and 2007; bought again heavily in March 2009
Structure: WXY complex correction, bottoming with V-shape GFC recovery
Fibonacci: 0.236% retracement of Macro ②
🔶 MACRO WAVE ⑤ (2009–2029): 🔥 The Final Ascent – AI, Liquidity & Euphoria
This is the final macro wave of Supercycle (III), and it subdivides into 5 Micro Impulse Waves.
We are now in Micro Wave ⑤ , which itself contains Sub-Micro Waves 1–5.
🔷 Micro Wave ① (2009–Apr 2010): 🪙 The Bounce from Oblivion
Fundamentals:
Fed QE1 💉, bailouts (TARP), 0% rates
Fear of deflation flipped to hunt for yield
Price Action: Clean V-bottom, shallow pullbacks
SMC: Institutions were loading REITs, tech, and banks post-GFC carnage
🔷 Micro Wave ② (Apr 2010–Jun 2010): 🩻 Flash Crash Flush
Fundamentals:
Euro debt scare, Greece bailout, volatility spike
Price Action: Sharp correction, liquidity vacuum
Fibonacci: Textbook 0.236% retracement
SMC: Stop hunt phase — liquidity grab before next leg
🔷 Micro Wave ③ (Jun 2010–2018): 🚀 Passive Investing Boom
Fundamentals:
QE2, QE3 → massive central bank asset inflation
Apple, Amazon, Google explode in earnings and valuation
ETF revolution = automated capital flows
Price Action: Relentless trend with low volatility
Fibonacci: 2.618+ extension of Wave ①
SMC: Institutions began multi-year hold strategies (FANGM), volatility sellers emerged
🔷 Micro Wave ④ (2018–2020): ⚠️ Volatility & COVID Shock
Fundamentals:
Rate hikes (2018), trade war (US-China)
COVID black swan — global shutdown, crude oil collapse (went negative!)
Price Action: Massive drop with record velocity (VIX > 80)
SMC: Panic selling, smart money accumulation March 2020
🔵 MICRO WAVE ⑤ (2020–2029): 📈 The Final Climb Begins
This is where we are now. This Micro Wave ⑤ is subdividing into:
🟢 Sub-Micro Wave ① (Mar 2020 – Nov 2021): 💹 Stimulus Mania
Fundamentals:
Unlimited QE, COVID relief checks
Crypto/NFT mania, meme stocks (GME/AMC)
Retail explosion via Robinhood & Reddit
Price Action: Parabolic rally, overbought signals
SMC: Institutions faded retail euphoria mid-2021
🟡 Sub-Micro Wave ② (Nov 2021 – Oct 2022): 🔻 Inflation Reckoning
Fundamentals:
CPI > 9%, Fed hikes aggressively
Yield curve inversion, tech meltdown
Price Action: 0.236% retracement
SMC: Smart money rotated into energy, defense, and value stocks during panic
Sentiment : Retail fled, fear extreme — perfect accumulation zone
🔴 Sub-Micro Wave ③ (Oct 2022 – Est. 2027): ⚡ AI Supercycle Ignites
CURRENT WAVE IN PROGRESS
Fundamentals:
AI revolution (ChatGPT, LLMs, Robotics, Automation)
Cloud, semiconductors, defense, biotech surge
Fiscal policy dominance, wars & tech race 🧠
Price Action:
Clean impulse structure
Shallow pullbacks, breakout-retest continuation
SMC:
Institutions aggressively long AI/Defense (Nvidia, Palantir, defense contractors)
Liquidity injections in dips, stealth breakouts
Fibonacci Target: 3.618 extension ~11,200
Expected to peak in 2026
🟠 Sub-Micro Wave ④ (Est. 2027-2028): 🧯 Last Shakeout Before the Climax
Expect:
Profit-taking, geopolitical panic, credit stress
Retest of broken trendline or previous resistance zone
Fibonacci : Retrace 0.236–0.382 of Wave ③
SMC: Final accumulation before blow-off top
🔵 Sub-Micro Wave ⑤ (Est. 2028–Q1 2029): 🚨 Blow-Off Top: 20,000 Target
Fundamentals:
Peak optimism: “AI replaces everything”, euphoria
Retail mania, influencer ETFs
Fed/central banks possibly easing again to avoid slowdown
Price Action: Parabolic, low pullbacks, extreme momentum, RSI divergence, volume climax
SMC: Massive institutional distribution — quiet selling into strength
Target: ~20,000 (5.618 of Wave ①), final top of Supercycle (III)
🛑 What Comes After? SUPERCYCLE WAVE (IV): 🔻 Decade-Long Reset (2029–2040?)
Major correction, potentially multi-decade sideways or secular bear
Catalyst? AI bust, geopolitical war, credit collapse
"Stay focused on structure, not emotions." - FIBCOS
📘 Disclaimer: This is a structural, educational market outlook. Not financial advice. Please do your own due diligence and risk management.
#FIBCOS #ElliottWave #SmartMoneyConcept #MarketAnalysis #Gold #XAUUSD #ElliottWave #WaveTheory #SuperCycle #MacroTrend #SmartMoney #Fibonacci #PriceAction #Commodities #TechnicalAnalysis #LongTermOutlook

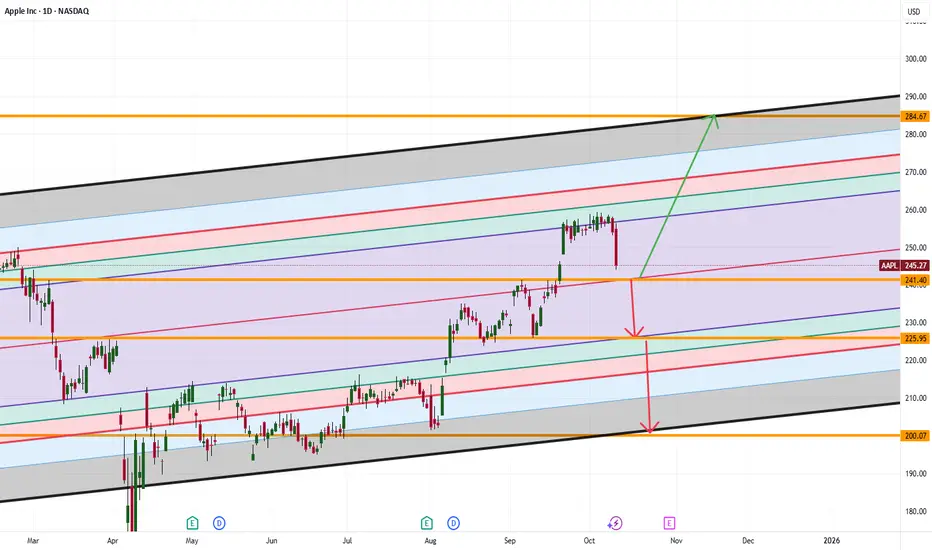
Apple’s $241 Bounce or Breakdown: Is This the Next Big Move?Apple’s stock price is moving down toward $241. This is an important zone. If Apple can stay above $241, it could jump up to $284. But if it falls below $241, the price might drop even more; maybe to $225 or even $200.
What do you think will happen next? Would you buy Apple if it drops to $241, or would you wait for a bigger move?
If you’re not sure what to do or have questions, ask me! Sometimes asking the right question gives you the answer you need to trade smarter. What’s your question about Apple right now?
Mindbloome Exchange
Trade Smarter Live Better
PepsiCo (PEP) Shares Jump Over 4% After Earnings ReportPepsiCo (PEP) Shares Jump Over 4% After Earnings Report — What’s Next?
Yesterday, PepsiCo Inc. (PEP) released its quarterly earnings report, which significantly exceeded expectations:
→ Earnings per share ($2.29) beat estimates of $2.26.
→ Gross revenue ($23.94 billion) also came in above forecasts of $23.94 billion.
According to The Wall Street Journal, PepsiCo will have a new Chief Financial Officer in a month — Steve Schmitt, a senior executive from Walmart. Analysts suggest that this leadership change could give the company a fresh boost, particularly as it continues to face challenges with sales growth, reflected in a months-long downtrend in its share price.
Technical Analysis of the PEP Chart
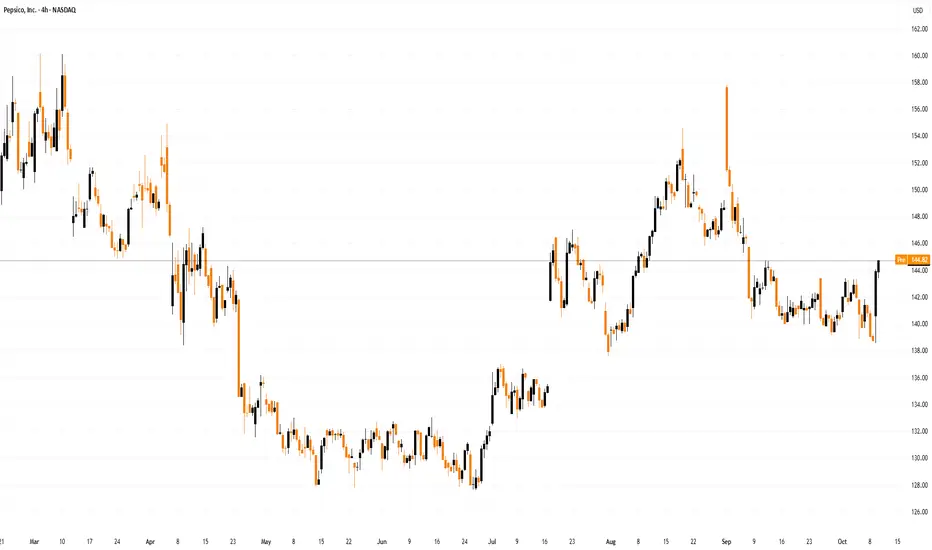
The PepsiCo share chart clearly highlights a disappointing trend, illustrated by the red descending channel.
However, there are signs that the situation could be shifting — and here’s why:
→ In May–June, the chart formed a relatively narrow range, which may reflect accumulation by large market participants who saw value in the stock at lower levels and began building long positions near a key psychological mark.
→ Between July and September, the share price rose from $130 to $150, suggesting a shift in market sentiment and indicating that institutional investors may have taken bullish positions.
While the long upper shadows above the $150 level reveal aggressive selling pressure, there are solid reasons for optimism:
→ PEP price movements suggest that the stock is attempting a bullish breakout above the upper boundary of the red descending channel;
→ as shown by the arrow, yesterday the price created a bear trap — dipping to a two-month low before rebounding sharply;
→ this could indicate that large players have shifted their control zone upwards, from $130 to $140.
If the bullish outlook proves correct, we could see price action developing within an upward channel (shown in blue), with the key resistance level for the bulls remaining near the psychological $150 mark.
This article represents the opinion of the Companies operating under the FXOpen brand only. It is not to be construed as an offer, solicitation, or recommendation with respect to products and services provided by the Companies operating under the FXOpen brand, nor is it to be considered financial advice.
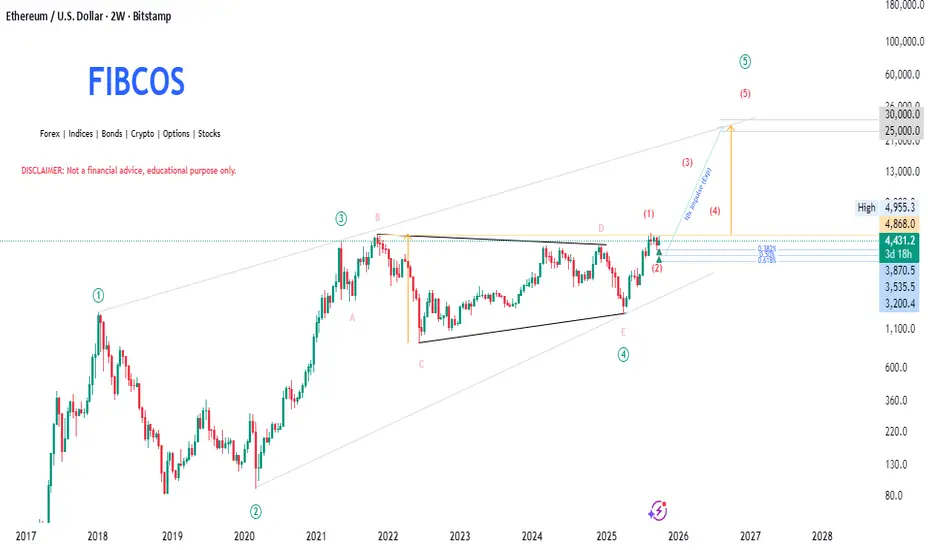
Ethereum(ETH) - Macro Outlook by FIBCOS🔍 Ethereum - Macro Outlook by FIBCOS 🧠
“From Contraction to Expansion – The Supercycle Awakens”
🌌 Super Market Cycle: The Final Push Begins
Ethereum is in the final stage of a Grand Supercycle 🌍 — a massive multi-year wave count aligning with the Elliott Wave Theory .
✅ Wave (1) and (2) established early strength
✅ Wave (3) peaked explosively in 2021 📈
✅ Wave (4) formed a beautiful contracting triangle (ABCDE) , a classic wave 4 corrective pattern
🟢 Now breaking out of Wave (4), we're entering Wave (5) — the euphoric leg 🚀
🌊 Wave Theory Magic: Riding the Impulse
We're deep into the impulsive sequence — and here's what stands out:
1️⃣ Wave (1) initiated the reversal from the triangle bottom
2️⃣ Wave (2) retraced perfectly to key Fib levels — golden pocket zone ✨
3️⃣ Current move is Wave (3) of (5) — historically the most powerful and extended wave 💥
🔮 Wave (5) targets extend toward $25,000–$30,000 based on Fibonacci projections 🧭
📐 Fibonacci Retracement & Extension: Precision Tools
After Wave (1), ETH retraced to the following golden zones:
🔵 0.382 – $3,870
🟣 0.50 – $3,535
🟢 0.618 – $3,200
These levels acted as strong demand zones 🛡️, where price was absorbed and reversed, showing institutional interest.
📈 For extensions:
Wave (3) targets: ~$15,000 (1.618 extension)
Wave (5) projection: $25K–$30K 🎯
🧠 Smart Money Concept (SMC): Liquidity Engineered Setup
SMC confirms the big players have already positioned:
🪤 ABCDE triangle = liquidity trap
🔥 Wave E = final sweep before the breakout
✅ Structure Break = Smart Money entry signal
🧱 Demand Zone @ ~$3,800–$4,200 = institutional orders filling 🏦
The Change of Character (ChoCH) + Break of Structure (BoS) = textbook confirmation of bullish intent 📚
🧱 Market Structure: From Consolidation to Expansion
We’ve broken multi-year resistance 💥
🔁 Previous All-Time High (ATH) now acting as strong support
📈 Higher highs and higher lows = full bullish market structure
🚀 Confirmed trend shift after accumulation → expansion phase
🔎 Price Action: Clean, Convincing, Bullish
The breakout candle is powerful:
✅ Big-bodied green candles
✅ Little-to-no upper wick = aggressive buyers in control 🐂
✅ Imbalance created below — potential “buy-the-dip” zones between $3,800–$4,200 📉🛒
ETH is now printing strength with every candle — the market is speaking clearly.
🌍 Macro-Fundamental Context – Ethereum’s Underlying Strengths
Ethereum’s fundamentals provide strong structural support for this technical forecast:
ETH ETF Approvals (Pending):
U.S. and global ETF prospects are building momentum, opening gates to institutional inflows akin to Bitcoin's ETF impact.
Layer-2 Scaling Adoption:
Networks like Arbitrum, Optimism, and zkSync are maturing rapidly, improving transaction efficiency and reducing on-chain congestion.
Ethereum 2.0 Transition/PoS Era:
Ongoing deflationary tokenomics (EIP-1559 burn + staking lock-up) are reducing effective circulating supply, supporting price growth.
DeFi Revival:
With macro liquidity cycles turning upward, usage and TVL (Total Value Locked) in Ethereum-based DeFi is expected to rise sharply.
AI x Blockchain Synergy:
Ethereum remains positioned to become the base layer for decentralized AI infrastructure — a potential catalyst for long-term valuation expansion.
These catalysts serve as the fundamental “fuel” behind the unfolding Wave (3) and the eventual Wave (5) .
🎯 Final Word: All Systems GO 🚀
The confluence is undeniable:
✅ Super Cycle 🔁
✅ Elliott Wave 📊
✅ SMC Smart Money 📈
✅ Price Action 🔍
✅ Market Structure 🏗️
✅ Fibonacci Levels 📏
✅ Fundamentals 🌍
💡 Ethereum is positioned to explode into its Wave (5) super-cycle with $30,000 as a potential macro target.
If you're looking for the high time frame narrative , this is as strong as it gets . Don’t chase. Plan the entry on retracements and ride the wave 🌊.
💬 "Structure unlocks direction, and Fibonacci refines destination." – FIBCOS
📘 Disclaimer: This is a structural, educational market outlook. Not financial advice. Please do your own due diligence and risk management.
#FIBCOS #ElliottWave #SmartMoneyConcept #MarketAnalysis #Gold #XAUUSD #ElliottWave #WaveTheory #SuperCycle #MacroTrend #SmartMoney #Fibonacci #PriceAction #Commodities #TechnicalAnalysis #LongTermOutlook
Reversal in progress?Is NESF starting to complete the Head phase of an inverse H&S pattern?
Still no end to the downtrend yet.
Probably need to wait another 12 months to see.
If the BOE further reduce interest rates, this will help its cost of capital.

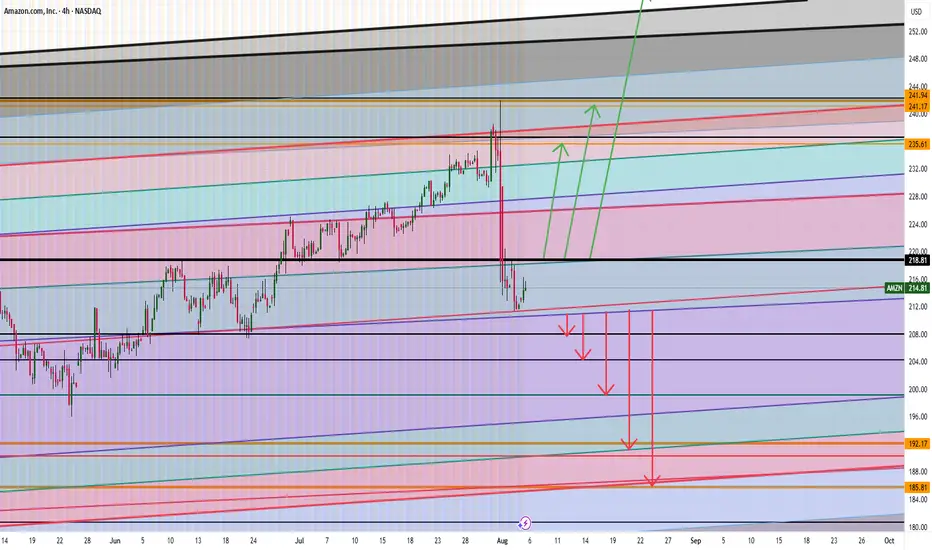
AMAZON ARE WE HEADING TO $258 ? HERE IS THE FULL ANALYSIS Hi Trading fam
So we have Amazon and based on what we are seeing we see two scenarios playing out:
Bullish:
If we can break and hold above 219 then we can see levels of : 235,241,and 258 being hit
Bearish:
If break the low of 210 then we hit 207,204, 199, 190 and then 185
Trade Smarter Live Better
Kris
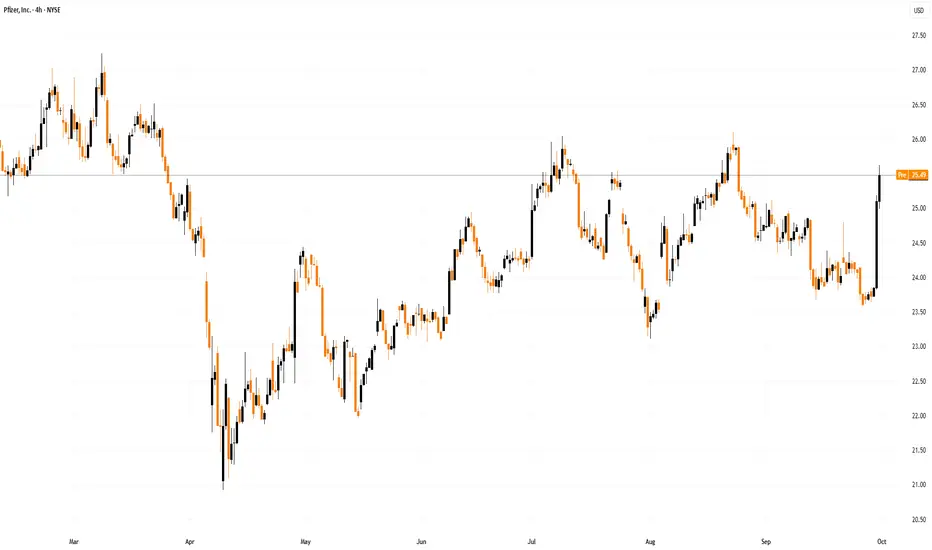
Pfizer and Pharma Stocks Rise After Trump DecisionPfizer Inc. (PFE) and Other Pharmaceutical Stocks Rise Following Trump’s Decision
According to media reports, US President Donald Trump launched a website allowing Americans to purchase medicines directly. He announced that Pfizer would offer some of its drugs on this platform and introduce new medicines to the US market at reduced prices. Trump added that his administration is working with other companies, including Eli Lilly, to reach “similar agreements.”
Reports state that Pfizer’s deal with the Trump administration will enable patients to receive significant discounts. In return, the company will receive a three-year exemption from any tariffs.
The news pushed pharmaceutical stocks to the top of yesterday’s gainers list:
→ Pfizer Inc. (PFE) rose by 6.8%
→ Merck & Co Inc. (MRK) rose by 6.8%
→ Eli Lilly and Co. (LLY) rose by 5.0%
Technical analysis of the PFE chart
The chart indicates that:
→ In the long term, PFE’s share price remains in a bearish trend, highlighted by the descending orange channel.
→ However, in April the stock reached its lowest level in nearly 13 years, after which the price began showing an upward trajectory, forming higher highs and higher lows within the ascending blue channel.
A strong fundamental driver yesterday caused PFE’s share price to rebound sharply from the lower boundary of the blue channel towards its median, encountering little resistance when breaking through the September local barrier at $24.75.
It is possible that positive market sentiment will persist and be leveraged by bulls to extend the rally. However, the real test of their resolve might come at resistance near the summer highs around $26.00.
A more substantial obstacle might lie in the $27–27.50 area, where multiple resistances converge, including:
→ the upper boundaries of both the blue and orange channels;
→ key highs from the first half of 2025.
Nonetheless, assuming the fundamental backdrop continues to be supported by positive news on progress in cancer treatments (Pfizer is conducting large-scale developments in this area, aided by its acquisition of Seagen, a pioneer in antibody-drug conjugates, or ADCs), this could lead to an attempt to break the long-term downward trend as early as this year.
This article represents the opinion of the Companies operating under the FXOpen brand only. It is not to be construed as an offer, solicitation, or recommendation with respect to products and services provided by the Companies operating under the FXOpen brand, nor is it to be considered financial advice.
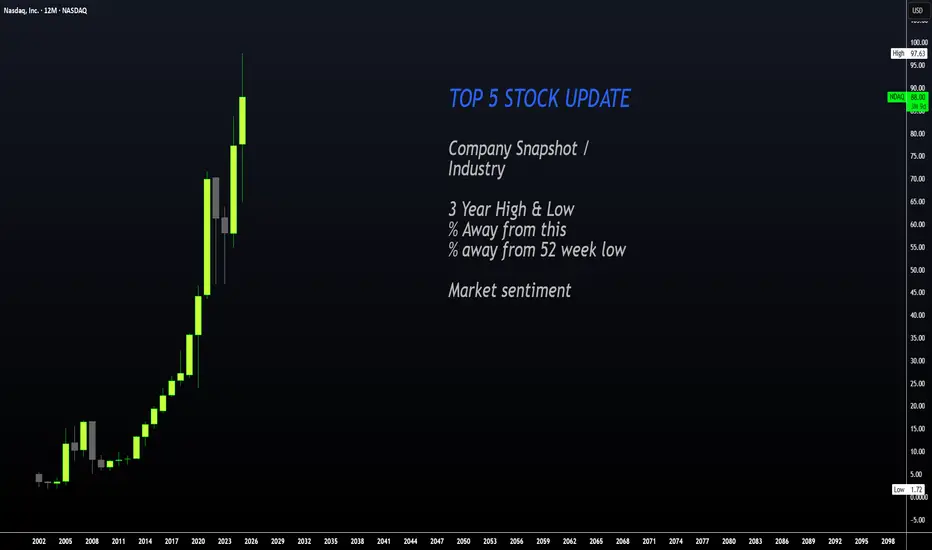
STOCKS Trading at 52 WEEK LOW - WatchlistHello Stonks Watchers 👀📈
Stocks that are hot on my watchlist right now for a possible buy , or a buy soon include:
1️⃣ Merck & Co. (MRK)
NYSE:MRK
Sector: Health Care
Last price: $81.51. 52-week low: $73.31.
% above 52-week low: 11.19%
Analysts are split: several bulls point to Keytruda pipeline upside and dividend support, but the consensus tilts toward “hold” as near-term risks (patent/biosimilar pressure) remain.
2️⃣ Costco Wholesale (COST)
NASDAQ:COST
Sector: Consumer Staples.
Last price: $943.26. 52-week low: $867.16.
% above 52-week low: 8.78%
Wall Street generally views Costco positively (membership model, resilient comps), with a consensus around “moderate buy” though some caution exists because the stock already trades at a premium.
3️⃣Saudi Aramco (2222.SR)
TADAWUL:2222
Sector: Energy
Last price: 24.95 (SAR). 52-week low: 23.13.
% above 52-week low: 7.87%
Market sentiment for Aramco is favorable for income investors because of its high, reliable dividend; investors watch oil fundamentals and geopolitics as the main swing factors.
4️⃣ONEOK, Inc. (OKE)
NYSE:OKE
Sector: Energy (midstream)
Last price: $71.55. 52-week low: $70.63.
% above 52-week low: 1.30%
Analysts and income-focused commentators highlight a strong dividend yield and attractive price targets, calling it a buy for yield/DFCF recovery in many writeups.
5️⃣The Trade Desk (TTD)
NASDAQ:TTD
Sector: Communication Services / Ad Tech
Last price: $52.03. 52-week low: $42.96
% above 52-week low: 21.11%
Long-term bulls point to programmatic ad recovery and profitable scaling, but consensus services show many firms at “hold” — sentiment is mixed while investors await sustained ad-spend improvement
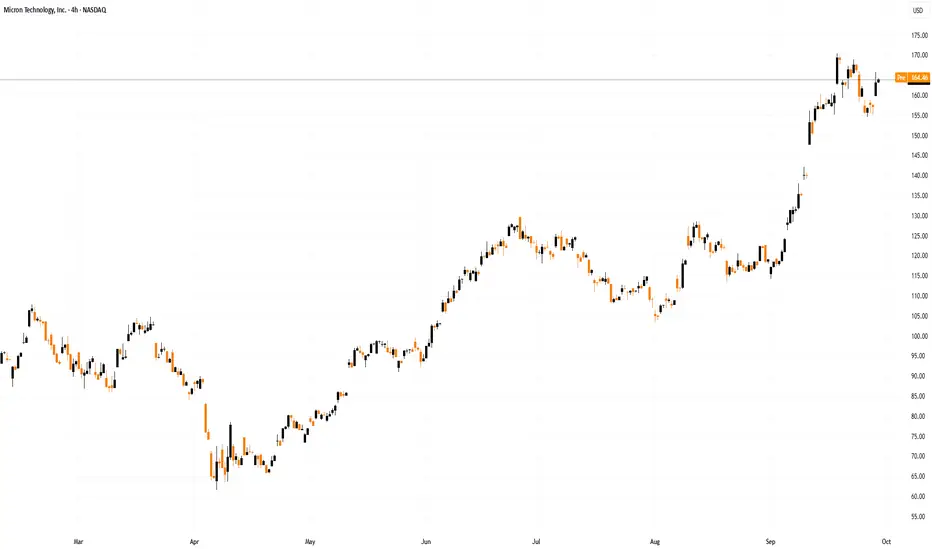
Analysis of MU Shares Following Earnings ReportAnalysis of MU Shares Following Earnings Report
Memory chip manufacturer Micron Technology (MU) published a positive financial report for Q4 of fiscal year 2025 on 23 September:
→ Q4 Revenue: Actual = $11.32 billion, up 46% compared with the same period last year.
→ Adjusted Earnings Per Share (EPS): Actual = $3.03 (analysts’ expectations = $2.87).
The main driver behind these strong results was heightened demand for high-performance memory needed for data centres and AI model training. Micron also published an optimistic outlook, forecasting revenue of between $12.2 billion and $12.8 billion in the next quarter.
Despite strong results and guidance, the share price reaction in the first week after publication has been moderate. Trading volumes were significantly above average, yet the price did not rise. Why?
1 → It is worth noting that Micron shares have nearly doubled in value since the start of 2025, which may indicate “bull fatigue.”
2 → A significant portion of the positive expectations tied to the AI boom is already priced into the current valuation.
Technical analysis shows more bearish signals.
Technical Analysis of MU Shares
Since early April, Micron shares have shown staggering growth of approximately 150%, with:
→ Price fluctuations forming an ascending channel (shown in blue). After breaking through the key resistance level at $130 in early September, the price rose towards the upper boundary of the channel, which now acts as resistance.
→ During this rise, the price exceeded the previous all-time high; however, further progress has clearly slowed. It is possible that the news of the record high, combined with a strong earnings report, created a buying frenzy that allowed large shareholders to take profits, thereby placing pressure on the price.
From a bullish perspective, the chart shows a correction pattern in the form of a “bull flag” (marked in red), suggesting a potential breakout and continuation of growth.
However, given the above, there are grounds to expect a deeper correction — for example, towards the median of the current channel, supported by a wide $135–150 zone (marked in purple), where the price previously rose particularly quickly, highlighting an imbalance in favour of buyers.
This article represents the opinion of the Companies operating under the FXOpen brand only. It is not to be construed as an offer, solicitation, or recommendation with respect to products and services provided by the Companies operating under the FXOpen brand, nor is it to be considered financial advice.
Webull Corporation — demand confirmation and growth potentialTechnical analysis: On the 4H chart, Webull Corporation (ticker BULL) is showing signs of a breakout from the accumulation channel. After a decline, the price stabilized in the 12.50–15.50 range, where demand confirmation is visible. The current level of 15.39 serves as a starting point for growth. The nearest upside targets are 17.40 and 20.40, with extended potential toward 25.30 and 41.00 if resistance is broken. Key support is located at 13.30–12.50, and losing this area may bring back bearish momentum.
Webull Corporation is a US-based fintech company offering online trading and investment services. Its platform provides retail investors with access to stocks, ETFs, options, and cryptocurrencies. Competing with Robinhood, Webull stands out thanks to advanced charts, analytics, and low fees. The growing popularity of online brokers and an expanding user base support the company’s long-term outlook.
As long as the accumulation structure holds and demand remains strong, the bullish scenario stays in focus. For long-term investors, the stock may be considered a buy-and-hold opportunity, supported by fintech sector growth and rising competition among online brokers.

Carrier Global (CARR) – Neckline Zone at RiskOn the Weekly timeframe, price action is showing potential weakness:
A Double Top pattern is visible at the top, and the price is now testing the critical neckline zone.
The global trendline has been broken with stronger-than-usual volume. Importantly, price has reached this trendline faster than in previous touches, showing weakening momentum.
Price has already moved below the EMA (21 & 50), which often signals trend reversal.
Both MACD and RSI are pointing towards continued bearish momentum.
The key area to watch is the neckline zone. If this zone fails to hold, the probability of deeper downside increases, potentially towards the lower support levels ($47–40 range).
Important Note:
This analysis is not a suggestion to open short positions. It simply highlights the risks for those considering BUY positions. In my view, it may be wiser to stay patient and wait until the price action provides clearer confirmation of strength before entering on the long side.
(This analysis is for educational purposes only, not financial advice.)

Bearish Flag Breakdown – Potential 20%+ DownsideOn the Weekly timeframe, a clear Bearish Flag pattern has formed and already broken downwards. According to classic technical analysis, the potential target is projected by the length of the flagpole, which points towards the $227 – $216 support zone.
Additional confirmations:
Price has broken below EMA (50), signaling a continuation of the downtrend.
MACD has crossed into bearish territory, with momentum weakening further.
RSI (14) is trending lower, currently near 40, suggesting more room to fall before oversold conditions.
Importantly, the selling volume has increased during the breakdown, adding strong confirmation to the bearish move.
Conclusion:
Downside continuation remains likely with targets in the $227–216 zone.
(This analysis is for educational purposes only, not financial advice.)

Coca Cola Are We Making New Highs or Dropping to $52 Good evening Trading Family
So here is the analysis if we can hold above 67.20 then we can see new highs being created all the way up to 80 dollars or higher.
However if we break below 67.20 we can see the market deeply correct back down to possibly as low as 52 levels.
Stay Sharp and follow the trend not your ego
Kris/ Mindbloome Trading

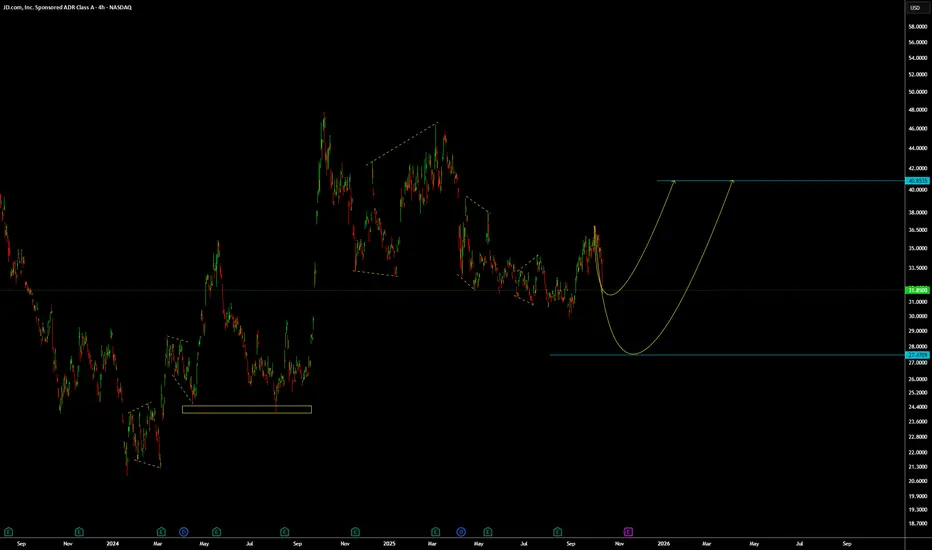
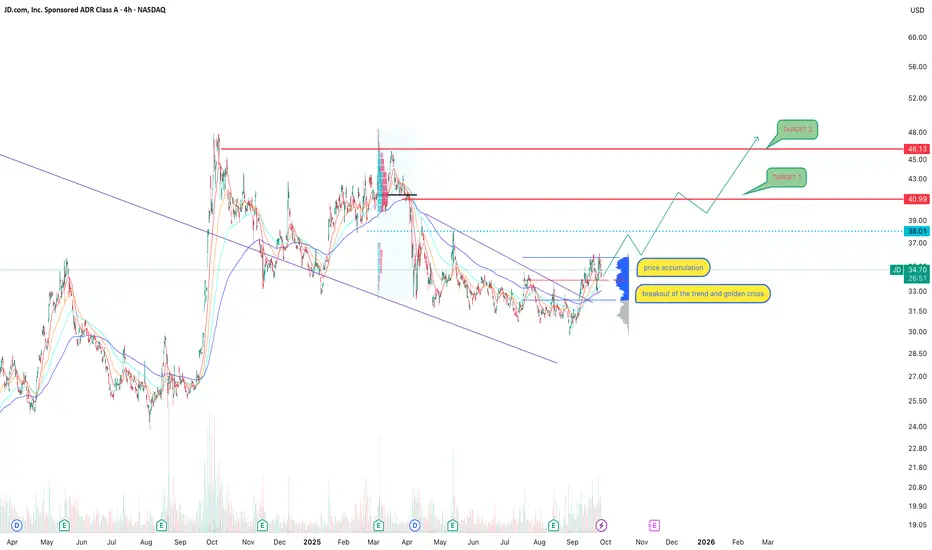
JD.com: accumulation, golden cross, and a chance to restart JD.com remains one of China’s largest e-commerce players, and despite macroeconomic headwinds, the company continues to hold its ground. Fundamentally, JD is focused on optimizing logistics, cutting costs, and expanding its cloud segment. Government policies aimed at boosting domestic demand also provide support. Risks remain tied to China’s economic slowdown and fierce competition from Alibaba and PDD, but at current levels the stock looks attractive for long-term investors.
Technically, the 4H chart shows a breakout of the descending trendline and the formation of a golden cross (50 EMA crossing above 200 EMA), confirming a medium-term trend shift. Price has consolidated above the accumulation zone and is now testing $34.50–35.00. If momentum holds, the next upside targets are $41.00 and $46.00, key resistance levels. A more conservative scenario involves a pullback toward $33.00–32.50, followed by another upward leg.
This is exactly the kind of market situation where investor expectations diverge from reality, and the longer it lasts the more it seems like a trend reversal is near. But as always, emotions must be set aside and clear signals awaited before committing.
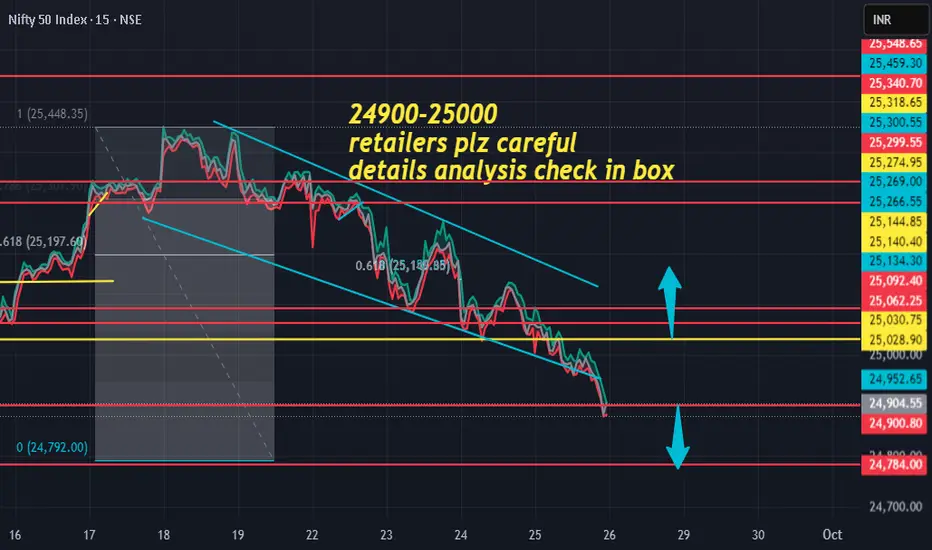
26 /sept/2026tgt was hit .
now
yesteray
my levels was multiples time provide safety to retail trraders and stop to trade in stoploss hunting zone.
now level for today .
25900-25000 strict range follow for retailer traders safety avoid stoploss hunting .
put below 25900
call above 25000
tgt extend 50/100/200 points.
LALPATHLAB BullishLALPATHLAB 🟢
Shows continuous profitable growth
EPS growth per year is seen by almost 10 to 15%
Sales growth is also consistent

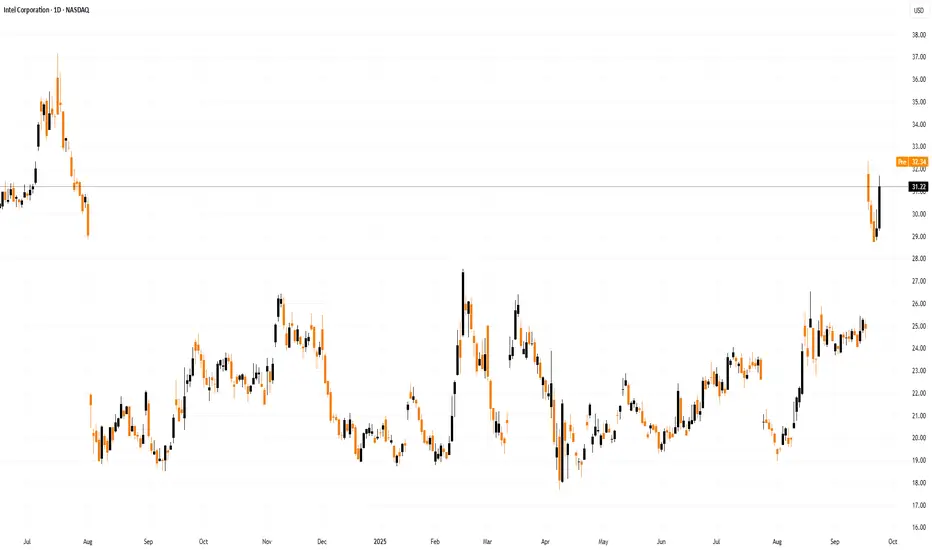
Intel (INTC) Shares Trade Around $30Intel (INTC) Shares Trade Around $30
In August, we noted that:
→ Intel (INTC) shares gained strong bullish momentum following reports that the US government was in talks to acquire a stake in the company;
→ the INTC chart was signalling that the depressed market, in place since 2021, was undergoing a fundamental shift in sentiment, with a potential rally foundation being formed.
Last month also brought the official announcement that Japanese conglomerate SoftBank Group would invest $2 billion in Intel. September, in turn, delivered further reasons for price gains:
→ On 18 September 2025, Nvidia officially announced a $5 billion investment in Intel and the launch of a multi-year strategic partnership. This came as a shock to the market: instead of competing, the two giants decided to join forces in developing new products. INTC shares gapped strongly higher, surpassing the psychological $30 mark for the first time this year.
→ More recently, Bloomberg reported that Apple is also considering investing in Intel. Although this remains at the level of speculation (with no official confirmation from either side), INTC shares rose by more than 6% yesterday.
Technical Analysis of INTC Shares
In earlier chart analysis, we highlighted the importance of the $20 level, which appeared to act as support from large players. This may have reflected confidence that the government would not allow a strategically important US company to be left behind in difficult times, particularly in the context of technological competition with China.
For many months, INTC shares had been in decline (shown by the red line). However, the price action in August–September has broken this pattern, confirming earlier assumptions. Higher lows and higher highs in 2025 have established an ascending channel (shown in blue), with key features as follows:
→ in early September, the price consolidated near the median, signalling a balance between supply and demand around $25;
→ September’s bullish news shifted the balance in favour of buyers, with INTC stock jumping towards the upper boundary of the channel.
From a bearish standpoint, potential obstacles to further growth include:
→ the psychological $30 level (which acted as support in May);
→ the upper boundary of the blue channel.
Although the market looks overbought, it is possible that:
→ buyers may refrain from taking profits in anticipation of longer-term gains;
→ and if positive rumours of further investment in Intel continue to be confirmed, this could drive an extension of the upward trend — potentially along a steeper trajectory (shown in orange).
This article represents the opinion of the Companies operating under the FXOpen brand only. It is not to be construed as an offer, solicitation, or recommendation with respect to products and services provided by the Companies operating under the FXOpen brand, nor is it to be considered financial advice.
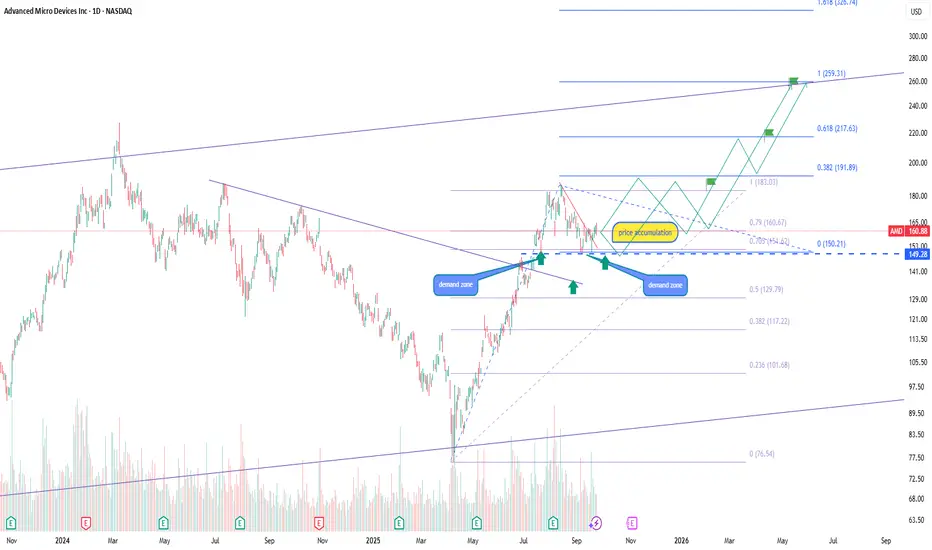
AMD reversal pattern and long-term growth potentialOn the AMD chart price holds the key support around 149–150 forming a base for continuation of the bullish trend. Above the consolidation zone at 160 targets open at 183, 217 and 259. In the longer-term perspective the structure points toward 326 and even higher as the trend remains bullish. Should a correction occur the 129 zone acts as major support to preserve the upward structure.
AMD keeps strengthening its market share in processors and GPUs, expanding rapidly in the server and AI segments. Strong demand for company products and its growing role in the AI ecosystem continue to attract institutional investors. Looking ahead to 2026, some analysts expect the stock to potentially reach levels around 900 per share.
Both the technical setup and fundamentals support further upside with near-term targets at 183, 217 and 259 while in the long-term a scenario above 300 and potentially up to 900 stays in focus for strategic investors. Risk-to-reward conditions provide a strong basis for holding existing positions and considering new entries. Additionally, investors may also look at opportunities through the AMD-linked ETF (AMDL).