GBP/USD Ready for a Year–End Breakout?Daily Technical Analysis
GBP/USD is currently trading around the 1.337 area, holding above a rising channel structure after breaking through the 1.322 demand zone at the start of December. Recent daily candles show slowing bullish momentum under a higher–timeframe supply zone extending toward 1.345–1.355 and potentially 1.360.
The technical outlook suggests a possible short–term pullback: a liquidity sweep below daily lows could bring price back toward the lower trendline and potentially into the 1.331–1.324 area before any continuation higher.
Bullish invalidation remains below 1.322.
The bullish continuation target remains 1.345, with potential extension toward 1.360 if momentum holds.
COT Positioning
Non–Commercials remain heavily short on the British Pound relative to longs (135,834 vs 60,319 contracts), indicating that most speculative positioning remains bearish on GBP. However, the latest weekly update shows a significant increase in long positions (+8,067) and a smaller increase in shorts (+3,402), suggesting a gradual sentiment shift with underlying bullish accumulation.
On the USD Index side, speculative positioning remains net short (28,652 short vs 14,778 long). Combined, this creates a medium–term directional bias supportive of GBP/USD upside: strengthening GBP + weakening Dollar Index is a potentially expansive backdrop.
Retail Sentiment
Retail sentiment currently shows 52% short and 48% long on GBP/USD. This is nearly neutral but slightly contrarian bullish, as the marginal majority of short positioning runs against the recent trend. Any pullback may encourage further retail short exposure, potentially setting up a bullish rotation afterwards.
Seasonality - December Bias
Seasonality confirms a historically bullish tendency in December:
– 20–year average: slightly positive
– 15–year average: positive
– 10–year average: slightly positive
– 5–year average: strongly positive
– 2–year average: strongly positive
This reinforces the potential for year–end upside continuation and supports a bullish narrative above 1.345 following any corrective pullback.
Trade Outlook
The base scenario remains a short–term pullback into key levels, followed by potential bullish continuation toward upper supply zones.
Short–term pullback zone: 1.331–1.324
Bullish continuation zone: 1.345–1.355
Primary extension target: 1.360
Conclusion
GBP/USD maintains a bullish daily structure. Despite heavy speculative short positioning, recent COT flows, positive seasonality, and balanced retail sentiment continue to support the idea of further upside into year–end. Technically, price is approaching a decision level below 1.345: I will be watching for a structured pullback before assessing the next bullish leg toward 1.360.
A break below 1.322 would invalidate the bullish structure and return price to a deeper accumulation phase.
Strategy

LIC | Weekly Bearish Options Setup | 30 Dec Expiry• Sell 870 CE
• Buy 900 CE
• Defined-risk bear call spread
Why this setup works NSE:LICI
LIC is trading below the mid-band with price failing to sustain above recent resistance. Momentum remains weak, RSI is slipping below the mid-zone, and the recovery attempts are getting sold into.
As long as price stays below the 860–870 resistance zone, upside looks capped. Stable IV keeps call spreads efficient for this weekly view.
View
Moderately bearish — expecting LIC to remain below resistance and drift sideways to down.
This idea is for education only. It’s not financial advice or a recommendation to trade.
#LIC #Nifty #WeeklyOptions #OptionsTrading #IndiaFNO #BearCallSpread #OptionSeller #PriceAction #NSEStocks #MarketAnalysis

GBPUSD - Relief Rally Into Resistance? Sellers Watching Closely📉GBPUSD remains overall bearish on the higher timeframe. Price is still trading within a descending structure, and the broader trend continues to favor sellers rather than buyers.
The recent upside move is best viewed as a corrective bounce, not a trend reversal. Price is now approaching a key confluence zone, where the former structure, horizontal resistance, and the descending trendline align.
This is the type of location where trend-following shorts become interesting. I’m not interested in selling blindly, but rather in waiting for lower-timeframe bearish confirmation once price reacts at this resistance zone.
⚔️As long as price remains below the descending trendline and fails to reclaim the range above, the bearish bias stays intact. A clean break and hold above this resistance would be the only thing that forces a reassessment.
For now, this looks like sellers getting another chance at a better price.
Will this resistance cap the move once again, or do bulls finally break the structure? 🤔
⚠️ Disclaimer: This is not financial advice. Always do your own research and manage risk properly.
📚 Stick to your trading plan regarding entries, risk, and management.
Good luck! 🍀
All Strategies Are Good; If Managed Properly!
~Richard Nasr

EUR/AUD: Is This Daily Rejection the Start of a Breakdown?1. COT Positioning
The latest COT data reflects a clear divergence between EUR and AUD positioning:
• EUR futures (Non-Commercial) continue to show strong net-long positioning, with +5,367 new long contracts added and the long/short ratio holding firm. This supports medium-term EUR strength.
• AUD futures (Non-Commercial) show an opposite movement, with +6,517 new short contracts added and a further reduction in speculative long exposure. This reinforces AUD weakness.
From a COT perspective, the gap between EUR strength and AUD weakness remains wide. This does not immediately justify a deeper EURAUD downside move unless commercial positioning begins to shift. However, extended net-long imbalances can sometimes precede corrective phases, meaning current EUR strength may be late-cycle rather than early-stage accumulation.
2. Seasonal Tendencies
December seasonality is notably skewed:
• The EUR historically performs well in December across all major lookback periods (20Y, 15Y, 10Y, 5Y, 2Y), creating a supportive seasonal tailwind.
• The AUD shows mixed to mildly positive seasonal behaviour at shorter timeframes, but lags the EUR significantly over the 10-year dataset.
Overall, seasonality favours EUR strength against AUD into year-end, adding a bullish seasonal bias to EURAUD.
3. Sentiment
Retail sentiment on EURAUD currently shows:
• 68% short
• 32% long
Such an imbalance typically acts as a contrarian bullish signal. As long as retail traders remain heavily short, upward pressure on EURAUD is likely to persist.
4. Daily Chart Structure
Price is currently rejecting a major daily supply zone after a sustained three-week upside rotation. The rejection aligns with key technical factors:
• descending trendline resistance
• previous distribution area
• RSI rejection from mid-range
Key levels:
• Daily supply: 1.7806 – 1.7921
• First downside target: 1.7558 demand
• Secondary liquidity zone: 1.7500 – 1.7440
The recent bearish move off supply suggests the start of a potential corrective phase. However, the higher timeframe structure remains bullish, and this decline may represent a pullback rather than a full structural reversal.
Macro factors (COT + seasonality + sentiment) lean bullish, which conflicts with the short-term downside impulse.
Short-term bias: Bearish corrective move toward 1.7558 demand
Medium-term bias: Bullish continuation unless 1.7440 breaks
The location is favourable for tactical shorts following the daily rejection, but aggressive management is required. Deep downside targets carry higher risk unless bearish momentum increases.

Swing Failure Pattern (SFP): When Price ReversesThe swing failure pattern is a liquidity event, not a candle pattern. It marks the moment when the market reaches for obvious stops, absorbs them, and reveals true intent.
An SFP forms when price trades beyond a well-defined swing high or low and then fails to hold acceptance outside that level. The extension triggers breakout entries and stop losses. The immediate rejection back inside the range confirms that the move was used to collect liquidity rather than to continue.
What the structure tells you
The key information is not the wick itself, but the context around it. The prior high or low must be obvious and widely watched. Equal highs, range extremes, or clean swing points carry the most liquidity. When price briefly breaks that level and closes back inside, the market signals that opposing orders have been filled.
This failure traps late participants. Breakout traders are positioned in the wrong direction, while stop losses from earlier positions have already been taken. That imbalance becomes fuel for the next move.
Why SFPs matter
SFPs often appear at major range boundaries or after extended directional moves. In ranges, they define the edges where reversals are most likely. In trends, they frequently mark local distribution or accumulation before a deeper retracement or full reversal.
The move after the SFP is usually cleaner than the move into it. Once liquidity is taken, price no longer needs to revisit the level. Structure shifts, momentum changes, and expansion follows away from the failed breakout.
How to use SFPs correctly
An SFP is not a signal by itself. It requires confirmation through acceptance back inside the range and alignment with higher-timeframe context. When combined with structure, it provides precise locations where risk can be defined tightly and intent is clear.
The market does not reverse because price touched a level. It reverses because liquidity was collected and the objective at that level was completed. The swing failure pattern is the footprint of that process.

BTCUSD — Trade Structure Update | Long Scenario ValidationThis idea outlines a long trade scenario on BTCUSD identified and evaluated using an analytical indicator focused on trade structure, risk boundaries, and statistical context .
The current configuration suggests a potential continuation toward the 91,750 area within the next 24 hours , provided the existing market structure remains intact.
🔍 Trade Structure
• Direction: Long
• Entry Zone: ~87,900
• Stop Loss: ~86,025
• Take Profit: ~91,750
• Risk : Reward: ~1 : 2
This scenario is not derived from a single signal. It is based on structural price behavior , volatility conditions, and historically observed market responses under similar environments.
📊 Statistical Context (Backtest)
For this type of configuration, the indicator provides historical context based on comparable market conditions:
• Net Profit: +660%
• Profit Factor: 2.08
• Win Rate: 51%
• Total Trades: 49
• Max Drawdown: −38%
• Test Period: 83 days
These metrics are presented solely to evaluate scenario stability and are not a prediction of future performance.
🧠 Interpretation
The current setup represents a structured continuation scenario with clearly defined risk parameters, where the potential outcome outweighs the predefined risk within the current market context.
The scenario remains valid until the defined risk boundary is violated .
⚠️ Important Notice
This publication is for analytical and educational purposes only.
It is not financial advice and does not guarantee results.
Past performance does not guarantee future outcomes.
Always apply proper risk management.

How to Use VWAP in Confluence with StructureVWAP is one of the few indicators that consistently adds value when used correctly. It does not predict direction and it does not replace market structure, but it provides a powerful reference point for where fair value sits within the current session or trend.
When combined with structural analysis, VWAP helps you filter trades, improve timing, and avoid impulsive entries that fight the underlying flow.
The first step is understanding what VWAP represents. It shows the average price weighted by volume, reflecting where most transactions have occurred. When price trades above VWAP, it signals that buyers are in control of the session.
When price trades below it, sellers dominate. This context becomes meaningful only when it aligns with the higher timeframe structure.
Start by establishing your bias through market structure.
If the higher timeframe is in an uptrend and price trades within a discount zone, VWAP becomes a dynamic confirmation tool. A reclaim of VWAP after a liquidity sweep or after a break of structure is one of the cleanest signals that buyers are stepping back in.
The same applies in reverse for downtrends: a VWAP rejection after a pullback into premium strengthens the short bias.
VWAP also adds clarity during intraday consolidation. Ranges often form around VWAP because it reflects the session’s equilibrium. Breakouts that occur away from VWAP without pullbacks frequently lack durability.
However, a breakout followed by a retest of VWAP shows acceptance and builds confidence in continuation. This combination turns a common indicator into a reliable filter rather than a standalone signal.
Another effective use of VWAP is identifying exhaustion. When price aggressively pushes far above or below VWAP, it often signals that the move is extended. This does not mean you fade the trend, but it does mean you tighten expectations and wait for structure to align before entering. Once price reconnects with VWAP and shows intent, the next move becomes more sustainable.
VWAP becomes particularly powerful when paired with session logic. Trading above VWAP in a bullish higher timeframe environment during London or New York sessions often leads to cleaner impulses.
Trading against VWAP during low-volume hours produces far more false signals. Timing, structure, and VWAP together create a cohesive framework.
Used in confluence, not in isolation, VWAP supports disciplined decision-making.
It aligns entries with momentum, filters low-quality setups, and clarifies whether the market accepts or rejects a level. When you combine VWAP with structure, liquidity, and session context, your trades become more intentional, less emotional, and significantly more consistent.
GBPJPY: COT & Seasonality Align for Bullish ContinuationCOT (Commitment of Traders): On GBP futures, Non-Commercial traders remain heavily net short, with an unbalanced structure and a further increase in short exposure over recent weeks. This positioning is typically contrarian in nature and remains consistent with continued upside potential in the cross. On the JPY side, Non-Commercials are still net long, but the broader context points to a structurally weak yen. Positioning momentum is fading, suggesting a higher risk of short covering rather than genuine defensive strength. From a relative perspective, the GBP vs JPY COT spread continues to favor further upside in GBPJPY.
Seasonality: Historical seasonality highlights December as one of the strongest months for GBPJPY, showing positive average performance across the 20-, 15-, 10- and 5-year datasets, with frequent accelerations during the second half of the month. This reinforces the broader bullish bias and reduces the probability of deep reversals as long as the technical structure remains intact.
Sentiment (retail): Retail positioning shows a clear majority short (around 80%), a classic setup that tends to support trend continuation and potential squeezes above highs, particularly when aligned with a well-defined trend and no signs of institutional distribution.
Daily technicals: The daily chart maintains a clean bullish structure, defined by higher highs and higher lows within an ascending channel. Price continues to trade above key value areas while respecting dynamic demand zones. The 206.5–205.5 area represents the first continuation demand, while a broader daily demand sits lower around 203–200, overlapping with a daily FVG and structural support. On the upside, 211.5–213 stands out as daily supply and the natural upside objective. Technically, there is room for an extension toward new highs as long as no structural breakdown or distribution signals emerge. The daily RSI remains constructive, with no meaningful bearish divergences, fully consistent with trend continuation.
Operational conclusion: The medium-term bias remains bullish. The preferred strategy is buying pullbacks into daily/H4 demand zones, with invalidation only below the key structural lows. Counter-trend shorts should be avoided. Short opportunities become relevant only if clear exhaustion signals appear at daily supply, supported by divergences and a confirmed structural shift, which are currently absent.

Gold Continues to Search for New HighsHello, smart and prosperous friends — what’s your view on OANDA:XAUUSD ?
Today, gold continues to maintain its bullish momentum and is currently trading around USD 4,305, marking its highest level since October 21. The main driver remains expectations that the Federal Reserve will continue cutting interest rates, which puts pressure on the U.S. dollar and supports the precious metal.
In the near term, market attention is focused on the U.S. Non-Farm Payrolls (NFP) report, along with retail sales and PMI data scheduled for release today. These key indicators could directly influence monetary policy expectations and gold price volatility.
From a technical perspective, the bullish structure remains clearly intact. Strong demand zones below are holding firmly, while recent pullbacks appear to be purely technical in nature.
Notably, the USD 4,350–4,360 area is showing signs of a weak high, suggesting there may still be room for price to sweep liquidity to the upside. As long as gold holds above its structural support, the preferred scenario remains buying on pullbacks, rather than selling against the prevailing trend.
What’s your take on gold prices today? Share your thoughts 👇.

USDJPY – Daily Compression at Key Demand: COT Divergence PointsFrom a COT perspective, the overall picture remains consistent with a phase of potential short-term structural weakening in the JPY, while at the same time showing signs of maturity in the USDJPY move. On JPY futures, Non-Commercial traders are still net long the yen (longs exceeding shorts), but the latest data highlights an increase in short positions alongside a reduction in longs, a typical distribution pattern following months of accumulation. At the same time, Non-Commercials on the Dollar Index remain heavily net short, suggesting that USD strength is increasingly fragile and driven more by tactical flows than by strong long-term conviction. This COT divergence historically tends to favor corrective moves on USDJPY rather than impulsive upside extensions.
On the daily chart, the technical structure is well defined: after the strong bullish impulse in November, price is developing a consolidation flag / descending channel, characterized by lower highs and compression toward a clearly defined daily demand zone between 154.00 and 154.50. This area has already been defended multiple times and aligns with a volume equilibrium zone. A clean break below this demand would open room toward the lower demand area around 152.00–152.50, while as long as price holds above the base of the channel, the bias remains corrective rather than structurally bearish. From a technical standpoint, the higher-probability scenario is a reaction from the demand zone with an attempt to break the upper trendline, rather than an immediate downside acceleration.
USDJPY seasonality in December has been historically positive to neutral-bullish over the past 10–20 years, with a tendency for recoveries in the second half of the month following early weakness. This supports the case for a technical rebound rather than a direct bearish continuation. Retail sentiment is almost perfectly balanced (51% long / 49% short), providing no extreme contrarian signal and reinforcing the idea of a market in a waiting and building phase, consistent with the current daily range and compression.
Overall, the operational bias remains neutral-to-bullish on weakness. The 154.00–154.50 area is a key reaction zone where a change in structure could justify tactical long exposure, with invalidation below daily demand. Only a decisive break and acceptance below 154 would shift the outlook toward a bearish continuation targeting 152, while a break of the descending trendline would confirm the resumption of the medium-term bullish trend toward 157.50–158.00.

DRI Darden Restaurants Options Ahead of EarningsIf you haven`t bought DRI before the rally:
Now analyzing the options chain and the chart patterns of DRI Darden Restaurants prior to the earnings report this week,
I would consider purchasing the 180usd strike price puts with
an expiration date of 2025-12-19,
for a premium of approximately $3.75.
If these options prove to be profitable prior to the earnings release, I would sell at least half of them.

Building Bias and Narrative in Trading (HTF-LTF)Bias is built top-down. The visuals make this clear. Higher timeframes define the environment. Lower timeframes refine execution. Mixing the two leads to impatience and overtrading.
Start with the high timeframe. Weekly and daily charts carry the highest impact on decision-making. They move slowly, but they define direction, value, and market regime. This is where patience matters most. If the higher timeframe is trending, your bias follows that direction. If it is ranging or transitioning, expectations on lower timeframes must be adjusted accordingly.
The first chart illustrates this trade-off clearly. As timeframes get lower, the impact of patience decreases while the risk of overtrading increases. This is why bias must be anchored higher. Lower timeframes react faster, but they lack authority without higher-timeframe alignment.
Once the environment is defined, map key levels on the higher timeframe. Major highs and lows, clear support and resistance, and obvious liquidity zones form the backbone of your narrative. These levels explain where market participants are positioned and where reactions are most likely to occur. Without them, lower-timeframe signals lose meaning.
Next, use momentum and structure to validate the story. Strong impulsive moves on higher timeframes confirm control. Weak follow-through or overlapping candles signal uncertainty. Momentum should support the directional bias defined earlier. If it does not, the narrative weakens.
Only then does the lower timeframe come into play. The second visual shows how the same market prints very different candles depending on timeframe. Weekly and daily charts compress noise into structure. Fifteen-minute and five-minute charts expand that structure into execution detail. Entries belong here, but only in the direction already defined.
The final table ties this together by trader type.
Long-term traders define trend on weekly charts and execute on daily.
Swing traders frame direction on daily and refine entries on four-hour.
Short-term traders align with four-hour structure and execute on hourly.
Scalpers still require hourly context before acting on fifteen-minute charts.
Bias is not prediction. It is alignment. The narrative flows from high timeframe context to low timeframe execution. When you respect this sequence, trades become selective, risk becomes clearer, and execution becomes calmer. The chart stops feeling random because you are reading it as a story, not reacting to each line.

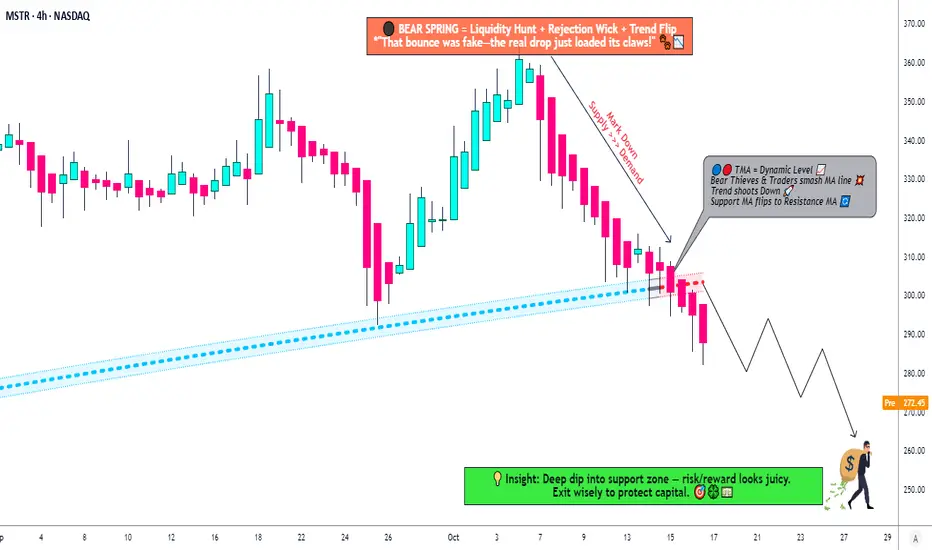
MSTR: Time to Short? Death Cross + Triangle Break Analysis🐻 MSTR "STRATEGY INC." - The Bear's Playground | Thief's Multi-Layer Setup 💰
📊 MARKET SNAPSHOT
Asset: NASDAQ:MSTR (Strategy Inc. - formerly MicroStrategy)
Current Price: ~$291.23 (Oct 17, 2025)
Setup Type: Swing/Day Trade - Bearish Confirmation
Strategy Style: "Thief Method" - Layered Limit Orders 🎯
🔍 THE SETUP - Why This Bearish Play Makes Sense
Ladies and Gentlemen, welcome to the Thief's playbook! 👋 MSTR just gave us a beautiful bearish signal with a triangular moving average breakdown. Here's what the charts are screaming:
🎯 The "Thief" Entry Strategy - Layered Limit Orders
This isn't your typical "buy now" play. We're sneaking in like a thief in the night with MULTIPLE SELL LIMIT LAYERS:
Entry Zones (Layer Your Shorts):
Layer 1: $310 (First resistance retest)
Layer 2: $300 (Psychological level)
Layer 3: $290 (Current consolidation zone)
💡 Pro Tip: Scale into your position! You can add MORE layers based on your risk tolerance (e.g., $305, $295, $285). The "Thief Method" is all about spreading your entries to catch the perfect price zones.
🛑 RISK MANAGEMENT - The Thief's Insurance Policy
Stop Loss: $320 🚨
(This is the Thief's emergency exit - if price breaks above this, the bears lost control)
⚠️ IMPORTANT NOTE:
Dear Thief OG's (Original Gangsters), this is MY stop loss level based on MY analysis. You should set YOUR OWN stop loss based on YOUR risk tolerance. Don't copy blindly - manage YOUR money, take YOUR profits (or losses) at YOUR own risk! This is YOUR trade, not mine. 💯
🎯 PROFIT TARGET - Where the Money's Hiding
Primary Target: $250 🎉
Why $250?
Strong historical support level
Oversold bounce zone (RSI typically rebounds here)
TRAP ALERT: Institutional buyers often accumulate at this level - be ready to ESCAPE with your profits before the bulls wake up! 🐂💤
⚠️ TAKE PROFIT NOTE:
Dear Thief OG's, $250 is MY target based on MY analysis. You can (and should) set YOUR own targets. If you're in profit at $270, $260, or even $280 - TAKE THE MONEY AND RUN! 💰 No shame in banking profits early. Remember: pigs get fat, hogs get slaughtered. This is YOUR trade, YOUR risk, YOUR decision!
🔗 RELATED ASSETS TO WATCH - The Correlation Game
MSTR doesn't trade in a vacuum! Keep your eyes on these correlated assets:
📈 Primary Correlation:
CRYPTOCAP:BTC (Bitcoin): ~$108,625 (Oct 17, 2025) - MSTR holds 640,000+ BTC (3%+ of total supply!)
Correlation Strength: 🔥🔥🔥🔥🔥 ULTRA HIGH
Why It Matters: MSTR is essentially a leveraged Bitcoin play. When BTC sneezes, MSTR catches a cold. Bitcoin's current bearish pressure directly impacts MSTR's valuation.
🔄 Secondary Watchlist:
NASDAQ:COIN (Coinbase): Crypto exchange - sentiment indicator
NASDAQ:RIOT (Riot Platforms): Bitcoin mining stock
NASDAQ:MARA (Marathon Digital): Another BTC-related equity
NASDAQ:CLSK (CleanSpark): Bitcoin mining operations
Key Point: If Bitcoin breaks below $105K support, expect MSTR to accelerate downward. Conversely, if BTC rallies back above $115K, this bearish setup could invalidate. Watch Bitcoin like a hawk! 🦅
📊 THE BIGGER PICTURE - Why MSTR Is Vulnerable Right Now
Bitcoin Pressure: BTC down -2.19% today, testing critical support levels
Institutional Caution: Recent S&P 500 rejection (not included in index) = credibility questions
Valuation Concerns: Trading at significant premium to NAV (Net Asset Value)
Technical Breakdown: Multiple MA crosses + trend reversal signals
Macro Headwinds: Risk-off sentiment in crypto markets (3-day consecutive decline)
🎓 THE THIEF'S WISDOM - Final Thoughts
This setup combines:
✅ Technical confirmation (MA breakout)
✅ Layered entry strategy (better average price)
✅ Clear risk management (defined stop loss)
✅ Realistic profit targets (strong support zone)
✅ Correlated asset monitoring (BTC relationship)
Remember: The market doesn't care about your opinion. Respect the charts, manage your risk, and don't get greedy. The "Thief Method" is about stealing profits intelligently, not gambling recklessly! 🎰❌
💬 TRADE SMART, NOT HARD!
This is a BEARISH SETUP with defined entries, exits, and risk parameters. Whether you're swing trading or day trading, the key is DISCIPLINE. Stick to your plan, don't chase, and protect your capital.
Questions? Thoughts? Drop them below! 👇
Let's build a community of smart traders who help each other win! 🤝
✨ If you find value in my analysis, a 👍 and 🚀 boost is much appreciated — it helps me share more setups with the community!
#MSTR #Bitcoin #BTC #TradingView #SwingTrading #DayTrading #BearishSetup #ShortSetup #CryptoStocks #TechnicalAnalysis #MovingAverages #LayeredEntry #RiskManagement #ProfitTarget #StrategyInc #MicroStrategy #ThiefMethod #TradingStrategy #StockMarket #NASDAQ
Mastering the Morning Breakout: The New York 15m/30m ORB SetupThe first 15-30 minutes of the market are often pure chaos for novices, but for professionals, it is where the day's structure is built.
The **Opening Range Breakout (ORB)** works because it defines the "Initial Balance"—the battleground where buyers and sellers fight for control. Once price breaks this zone with conviction, it often signals the true trend for the rest of the session.
**The Problem:**
Most traders fail at the open because they chase volatility. They enter on wicks, get trapped by fake-outs, or miscalculate their levels manually.
**The Solution (Chart Breakdown):**
In this NQ example, we strip away the noise and focus on pure structure:
1. **Define the Battlefield:** We let the first 15 minutes pass, or 30 minutes if you wish to wait for more confirmation.
2. **Wait for range to form** Notice the breakout. We don't guess. We wait for a **Candle CLOSE** outside the box.
3. **The Trigger:** The "BULL/BEAR" label only appears when buyers have proven they can hold price above or below the range. This filters out the "wicks" that stop out early shorts.
4. **Precision Targets:** Instead of guessing where to take profit, we use the 1x and 2x measured moves based on the range's own volatility.
**Why this approach saves accounts:**
It forces objectivity. By automating the levels and waiting for the confirmed break, you remove the emotional "FOMO" that ruins morning sessions. You aren't predicting the move; you are executing on confirmed momentum.
*This setup is running on a free community tool. You can add it to your chart using the link below to automate your own morning levels.*

4 TYPES OF TRADERS & THEIR RISK MANAGEMENT STYLES (MASTERCLASS)In the world of trading, your personality dictates your strategy. There is no "one size fits all" approach to closing a trade. Some traders prefer peace of mind, while others chase maximum potential returns.
Below are the four main types of traders based on how they handle Take Profit (TP) levels and risk. Identifying which one you are the first step to consistency.
1) THE EXTREME PROFIT LOCKER This trader closes the entire position the moment TP1 is hit or at a certain level like 1R.
PROS:
Immediate Profit: The moment TP1 is hit, the profit is secured in the wallet.
Zero Stress: No more emotional pressure or chart watching since the trade is fully closed.
Safety: No chance of the trade reversing into a loss because you are already out.
CONS:
FOMO (Fear Of Missing Out): You completely miss TP2, TP3, or any massive continuation rallies.
Limited Upside: You are capping your winners early, which means you need a higher win rate to be profitable long-term.
2) THE SMART FUND PROTECTOR This is the most balanced approach. This trader usually books 50% to 80% of the profit at TP1 and shifts the Stop Loss to Breakeven for the remaining position.
PROS:
Capital Preservation: Both the initial capital and a portion of the profit are locked in immediately.
Stress-Free Runners: You are "safe" even if the trade reverses, as the worst-case scenario is breaking even on the remainder.
Psychological Comfort: It is easier to hold for big targets when you have already banked money.
CONS:
Premature Stop-Outs: If price pulls back to entry after TP1 (a common occurrence) and then rallies, you get stopped out at breakeven and miss the big move.
Regret: You may feel frustration when the market pumps hard, but you are only holding a tiny "moon bag" position.
3) THE SMART NO TRAIL TRADER This trader focuses on math over comfort. Instead of closing fully or moving to breakeven immediately, they scale out based on their initial risk. For example, if their risk was $100, they lock in $100 profit at TP1 and keep the rest running without moving the Stop Loss to breakeven.
PROS:
Maximum Potential: This style gives the best chance to ride big trends and catch all TPs.
Balanced Math: At every TP, they cover their potential loss, ensuring the math works in their favor.
Room to Breathe: By not rushing to breakeven, they avoid getting stopped out by standard market volatility before the real move happens.
CONS:
Reversal Risk: If the trade reverses completely from TP1, they might end up with nothing or a full loss.
High Stress: Requires active monitoring, patience, and a strong stomach to watch profits turn into drawdowns during pullbacks.
Whipsaw Danger: Many trades pull back after TP1. This trader risks giving back open profits in exchange for the chance of a home run.
4) THE ONE TARGET HIGH R.R. PLAYER This trader operates with a "sniper" mentality. They do not take partial profits. They only lock profit at a specific, high-value level (e.g., 1:3 or 1:5 Risk-to-Reward). It is usually "All or Nothing."
PROS:
Profitability with Low Win Rate: Because the winners are so big (3x or 5x the risk), you can be profitable even if you lose 60% of your trades.
Efficiency: One winning trade covers multiple small losses.
CONS:
Low Win Rate: Since you target high rewards, price will reach your target less often.
Psychological Difficulty: This requires extreme patience and experience. It is mentally painful to watch a trade go up 2R (2x profit) and then reverse to hit your Stop Loss, but that is the cost of this strategy.
SUMMARY -
Each style has its own specific advantages:
The "Profit Locker" sleeps best at night.
The "Fund Protector" survives the longest.
The "No Trail Trader" maximizes trends.
The "High R.R. Player" plays the long-term probability game.
Choose the style that fits your risk appetite and how much time you can actively watch the charts.
- TUFFYCALLS

GBP/USD: Institutions Accumulate, USD Weakens – Key PullbackMacro Context and USD Index (DXY) – Neutral/Weak USD Bias
The COT report on the Dollar Index shows a configuration that suggests sustained bearish pressure on the USD:
Non-commercial traders are adding both long positions (+6,038) and short positions (+5,474), but the overall structure remains clearly short-dominant (32,207 shorts vs. 16,645 longs).
Commercials significantly increase their USD long exposure (+1,188), though their activity typically reflects hedging rather than a directional view.
Open interest rises sharply, signaling renewed institutional participation on the sell side of USD.
In summary, net pressure remains bearish on the USD, a condition that favors upside continuation in GBP/USD.
COT on the British Pound (GBP) – Clear Improvement in Institutional Sentiment
The GBP report is far more revealing:
Non-commercials aggressively cut long exposure (–19,354) while sharply increasing shorts (+15,403).
However, commercials substantially increase their GBP long exposure (+40,231) while reducing short exposure (+504).
This dynamic is typical of market turning points:
When non-commercials rapidly reduce longs and add shorts, it often represents short-term emotional selling.
Commercials, meanwhile, accumulate heavily, suggesting that current price levels are perceived as attractive value zones.
Interpretation:
GBP is likely entering a structural accumulation phase.
Combined with USD weakness → this supports a moderately bullish medium-term bias on GBP/USD.
Retail Sentiment – Contrarian Confirmation of Potential Upside
Retail short: 56%
Retail long: 44%
Retail positioning is predominantly short → classic contrarian signal → reinforces a bullish scenario for GBP/USD.
Seasonality – December Historically Bullish
December typically shows positive seasonal behavior, especially across the 5-year and 2-year curves.
The 10-year curve is slightly bullish as well; only the 20-year curve is mostly neutral.
Interpretation: December tends to favor accumulation and upward extensions, particularly in the second half of the month.
Price Action & Key Levels
Price recently bounced from the ascending channel highlighted in green.
A strong bullish impulse candle broke previous micro-structure, and the pair is now undergoing a technical pullback.
The blue zone (1.3160–1.3230) represents the major daily demand area that initiated the latest rally.
Primary Scenario (Bullish – Higher Probability):
A retracement toward 1.3240–1.3260 is expected, aligning with a retest of the ascending trendline.
From this region, a bullish continuation toward:
• 1.3420 (first supply zone)
• 1.3550 (intermediate liquidity pocket)
• 1.3600–1.3650 (macro supply and seasonal target)
The daily RSI remains neutral, with no signs of exhaustion, leaving ample room for further upside.

Ribbon Flip SignalsRibbon Flip Signals highlight the exact moment when market momentum shifts and the trend direction changes. When the ribbon transitions from bearish to bullish, a Buy Flip appears, signaling rising strength and a potential upward move. When the ribbon shifts from bullish to bearish, a Sell Flip appears, marking weakening momentum and a likely reversal or exit point.
Ribbon Flip Signals help traders spot trend changes early, filter out noise, and enter only when momentum aligns with direction. This makes every shift in the ribbon a clear, actionable signal rather than just a visual change.

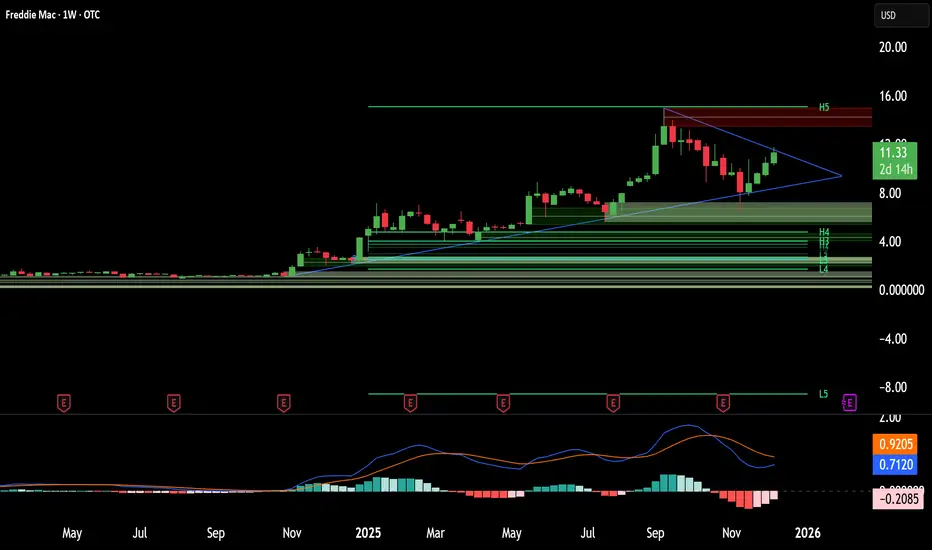
The Big Short’s Longest Bet: Can Freddie Mac Break Free?Michael Burry, the legendary bear of 2008, has flipped the script. The man who famously shorted the housing market now bets on its bedrock: Freddie Mac (FMCC). Shares rallied 10% Tuesday after Burry revealed a "personal" stake in the government-sponsored enterprise (GSE). He argues the mortgage giant stands on the precipice of a historic transformation. Yet, he warns of a "steep, windy, and rocky climb" ahead. Is this the ultimate contrarian play, or a value trap waiting to snap?
Geopolitics & Macroeconomics: The Housing Anchor
The global financial system rests heavily on the stability of US housing. Freddie Mac does not just fund American homes; it securitizes debt that underpins global bond markets. A successful privatization would send a powerful signal of US financial resilience to foreign creditors. Conversely, continued conservatorship limits US economic agility. The Trump administration’s push for privatization aims to unleash capital, reducing the government's balance sheet exposure while revitalizing the secondary mortgage market.
Business Models: The IPO Pivot
Freddie Mac’s business model is shifting from government ward to private competitor. For 17 years, it surrendered profits to the Treasury. Burry predicts a re-listing could unlock immense value, potentially pricing shares at 1.5 to 2 times book value. The core strategy involves shedding the "net worth sweep" shackles to rebuild capital. This transition requires a fundamental restructuring of how the enterprise prices risk and retains earnings, moving from a utility-like mandate to a growth-oriented equity story.
Technology & Cyber: AI in the Engine Room
Behind the ticker, Freddie Mac is quietly becoming a fintech juggernaut. The company now deploys advanced Artificial Intelligence (AI) and Machine Learning (ML) to modernize credit risk modeling. Innovations like "Automated Collateral Evaluation" (ACE) reduce the need for physical appraisals, streamlining the loan cycle. Furthermore, their deployment of "Early Warning Indicator" (EWI) models uses Natural Language Processing to predict operational bottlenecks. This tech-forward approach reduces defect rates and fortifies their cyber-defense posture against data breaches.
Science & High-Tech: Algorithmic Rigor
The science of risk is evolving. Traditional linear regression models often fail when economic conditions shift abruptly. Freddie Mac’s data scientists are exploring "Hamiltonian-constrained" neural networks to maintain ranking stability in volatile markets. By integrating physics-based optimization into financial modeling, they aim to solve the "concept drift" problem where models degrade over time. This high-tech rigorousness ensures that their multi-trillion-dollar portfolio remains robust against unforeseen economic shocks.
Management & Leadership: Steering Through the Storm
Leadership at Freddie Mac focuses on operational leanness. The management culture has pivoted from crisis survival to efficiency and digital transformation. They prioritize "mission-driven" business while preparing for the scrutiny of public markets. Burry suggests that even Warren Buffett could endorse this leadership by acquiring a stake. This vote of confidence would validate the management’s strategy of balancing affordable housing mandates with shareholder returns.
Conclusion: The Verdict
Freddie Mac is no longer just a distressed asset; it is a technology-empowered financial fortress awaiting liberation. Michael Burry’s entry signals that the risk-reward ratio has finally tipped. While the path to an IPO remains fraught with political hurdles, the fundamental drivers—innovation, leadership, and market necessity—are aligning. Investors willing to endure the volatility may find themselves holding the keys to the next decade’s most significant financial turnaround.
The Transformation Every Trader Must Make!!!Every trader begins with the same goal: “I want to make money.”
But the traders who last, the ones who grow, evolve, and eventually become consistent, go through a quiet transformation:
They shift from thinking about money...
to thinking about probability, structure, and process.
Here’s the transformation in three stages:
1️⃣From Outcome-Driven → Process-Driven
Beginners measure success by whether a trade wins or loses.
Professionals measure success by whether they followed their plan.
- Because a good trade can lose.
- And a bad trade can win.
- Confusing the two destroys growth.
Your job is not to win every trade!
Your job is to execute with integrity.
2️⃣From Prediction → Preparation
Beginners try to guess where the market will go.
They draw a level… then hope.
Professionals don’t predict, they prepare.
They plan both sides:
- If price does X, I do Y.
- If price breaks Z, I step aside.
- If the structure shifts, I adapt.
Prediction feeds the ego.
Preparation feeds the account.
3️⃣From Emotional → Probabilistic Thinking
Beginners think every trade is “the one.”
Professionals think in sample sizes.
- One trade means nothing.
- Five trades mean nothing.
- Fifty trades reveal the truth.
When you think probabilistically:
- Fear shrinks.
- Confidence grows.
- Discipline becomes natural.
Because now you see the market for what it is:
a place where anything can happen, but certain behaviors win over time.
📚 The Real Lesson
Trading becomes easier when you stop trying to force results and start building a process that produces results over the long run.
The market doesn’t reward intensity.
It rewards consistency, clarity, and adaptability.
Your transformation begins the moment you shift from:
“I need this trade to win”
to
“I need to follow my plan.”
That’s when you stop gambling… and start trading.
⚠️ Disclaimer: This is not financial advice. Always do your own research and manage risk properly.
📚 Stick to your trading plan regarding entries, risk, and management.
Good luck! 🍀
All Strategies Are Good; If Managed Properly!
~Richard Nasr

German Industrial Production Surges, but the Euro Remains UnderToday's Industrial Production s.a. (MoM) data for October surprised to the upside, showing a strong increase of 1.8%, compared to expectations of -0.4% and a previous reading of 1.1%. This marks one of the strongest monthly performances of the year, indicating renewed stabilization in Europe's largest economy.
The indicator, released by the Statistisches Bundesamt Deutschland, is a key measure of the health of the manufacturing and mining sectors-core drivers of the German economy. Typically, higher industrial production is considered positive for the euro, signaling better growth prospects within the Eurozone.
Market Reaction - A Brief Spike Followed by Reversal
Immediately after the release, the euro jumped approximately 20 pips against the US dollar. However, the move was short-lived. During the European morning session, the USD regained all losses and strengthened further, pushing EUR/USD back toward 1.1650, with continued bearish momentum on the single currency.
This price action suggests that investors remain unconvinced that a single positive data point is enough to change the broader negative outlook for the Eurozone.
Geopolitical Pressure and Investor Sentiment
Market sentiment today was influenced not only by economic indicators but also by political commentary. Recent criticism of the European Union by Elon Musk and Donald Trump-including claims that the EU should "return to nation-states"-has added to investor caution regarding European assets.
Although such remarks do not directly affect short-term indicators, they contribute to a broader environment of skepticism toward the Eurozone's long-term stability.
World-Signals Outlook for EURUSD
According to World-Signals, the euro is likely to remain under pressure in the coming days. Expectations of a Federal Reserve interest rate cut toward the end of the year are currently viewed by markets as a supportive factor for the US dollar, signaling continued resilience in the American economy.
Given this backdrop, a move in EURUSD toward 1.1700 appears unlikely in the near term. Instead, USD strength is expected to dominate, with potential for the pair to test lower levels if negative sentiment toward the Eurozone persists.

EUR/USD Is Walking Into a Trap: Liquidity Sweep is coming!Price Action & Structure
The current structure shows a corrective rally unfolding within an ascending channel (green dashed lines).
Price action is printing higher highs without fresh momentum, a typical sign of “distribution during a pullback.”
The market is now trading in the upper half of the channel, approaching a daily premium zone just below 1.1700–1.1750.
Daily RSI sits around 60–65, which aligns with an extended pullback, not the beginning of a true bullish trend.
COT Analysis
EUR Futures (CME)
Large speculators are increasing shorts more aggressively than longs → bearish reading on the euro.
Commercials
Commercial traders are adding longs while reducing shorts.
→ This is classic hedging behavior during extended bullish corrections.
USD Index COT
Non-Commercial:
Positioning shows speculators are covering USD longs, but not turning bullish on the euro.
This suggests a temporary squeeze, not a structural trend reversal.
Retail Sentiment
70% SHORT EUR/USD
30% LONG
Retail traders are heavily short and consistently squeezed during upside moves.
This is a classic setup for a fake bullish rally into premium zones, after which larger players typically reverse price.
EUR/USD Seasonality (December)
December is statistically bullish, with average performance between +0.8% and +1.4%.
Seasonal curves show a rise into mid/late December, followed by:
→ a pullback near month-end
→ a bearish setup after January 3rd (typical early-year USD strength)
Thus, the current rally aligns perfectly with seasonality:
December rally → distribution → January drop.
Conclusion
EUR/USD is completing a structural bullish pullback, not forming a new bullish trend.
The move toward 1.1700–1.1750 looks like:
✔️ a liquidity grab
✔️ seasonal pump
✔️ exhaustion before reversal

BTC Daily Swing Lab: 50/200 EMA + ATR Stop (Open-Source StrategyThis is a simple daily swing framework for BTC and other major crypto pairs.
Rule 1: Only trade long when the 50 EMA is above the 200 EMA.
Rule 2: Use an ATR-based trailing stop.
Rule 3: Exit when volatility catches up or the trend breaks.
I built this as a lab tool to study daily swings on BTC, ETH, SOL and other majors without over-complicating the rules.
CORE IDEA
1. Define a bullish regime: 50 EMA above 200 EMA.
2. Only look for long trades inside that bull regime.
3. Use an ATR stop to trail exits instead of guessing tops.
4. Close if the 50/200 EMAs lose their bullish structure.
The goal is not to catch every wiggle. The goal is to ride the middle of big daily moves with clear, testable rules.
HOW I USE IT ON BTC 1D
Timeframe: 1D
Direction: Long-only
I use it to:
* Stay out of chop when the 50 is under the 200.
* Study how ATR stops behave in different BTC cycles.
* Compare mechanical exits to my discretionary levels.
Try it on ETH, SOL or your favorite majors and see how the behavior changes.
HOW TO ADD IT
1. Open BTCUSD and switch to the 1D timeframe.
2. Add “Lab: Daily 50/200 EMA + ATR Stop (Long Only) – by FlyingOceanTiger” from the Indicators & Strategies tab.
3. Open Strategy Tester and scroll through past bull and bear cycles to see how it handled them.
Feel free to fork the code and experiment with your own rules (different EMAs, ATR settings, extra filters). If you build a variation you like, drop it in the comments so I can check it out.
DISCLAIMER
This is a research tool and not financial advice. Always do your own testing and manage your risk.

The F1 Mindset Every Trader Needs!!!Most traders behave like they’re trying to win the race on the first lap.
Full throttle. No patience. And then they wonder why they spin out before the finish line.
🏎 But in Formula 1, especially under the lights of Abu Dhabi, the winners don’t drive the fastest…
They manage the race the smartest.
And trading is no different.
Here are the three F1 lessons every trader should master:
1️⃣You Don’t Win by Being Fast => You Win by Being Controlled
F1 drivers don’t go maximum speed all the time.
They manage tyres, fuel, engine temperature, and track conditions.
In trading, your “tyres” are your capital.
Burn them early with emotional trades, and your race is over.
Consistency beats speed.
Control beats excitement.
2️⃣ Your Strategy Is Your Pit Crew
No F1 driver wins alone, they rely on a team that’s fast, disciplined, and precise.
For traders, your “pit crew” is your:
- trading plan
- risk management
- journaling
- strategy rules
- routines
When your system is aligned, your performance becomes predictable.
When it's sloppy, you get undercut by the market every time.
3️⃣ The Race Is Won on Corners, Not Straights
Every driver can accelerate on the straights.
Champions gain their advantage in the corners — the difficult, technical parts of the track.
In trading, the “corners” are:
- drawdowns
- losing streaks
- choppy markets
- hesitation
- volatility spikes
Anyone can trade a trending market.
True professionals shine in difficult conditions.
🏁 Final Lap Insight
The Abu Dhabi Grand Prix doesn’t reward the loudest driver, it rewards the most disciplined.
Trading is exactly the same.
✔ The market is your circuit.
✔ Your account is your car.
✔ Your rules are your race line.
✔ And your mindset determines whether you finish… or crash out on turn one.
Trade like an F1 driver:
calm, calculated, consistent, and always thinking about the full race, not a single lap.
⚠️ Disclaimer: This is not financial advice. Always do your own research and manage risk properly.
📚 Stick to your trading plan regarding entries, risk, and management.
Good luck! 🍀
All Strategies Are Good; If Managed Properly!
~Richard Nasr