$7.73 to $76.00 in 1 day! Another 800% runner $INKTAGAIN? Another 800% runner in a day? 🚀 Such massive moves became a daily thing these days? 😲 NASDAQ:INKT
Can't wait to see new one in the morning!
Strategy!

MP Materials Options Ahead of EarningsIf you haven`t bought MP before the previuos earnings:
Now analyzing the options chain and the chart patterns of MP Materials prior to the earnings report this week,
I would consider purchasing the 25usd strike price Calls with
an expiration date of 2025-6-20,
for a premium of approximately $2.97.
If these options prove to be profitable prior to the earnings release, I would sell at least half of them.

Soybeans Loading a Bounce? Demand Zone + COT1. Price Action & Technical Structure
Price has bounced off a strong daily demand zone (1011–969).
Today’s daily candle shows a clear rejection wick from the low, and RSI is signaling a potential reversal.
The market is trading inside a falling channel, currently near the lower boundary — setting up a possible breakout move.
Technical Targets:
• First upside target: 1039–1049
Invalidation: daily close below 990, which would confirm structural breakdown.
2. COT Report – Soybeans Futures (as of July 9, 2025)
• Non-Commercials:
+11,539 spreads | +7,017 shorts | –7,520 longs → Slight bearish pressure, though spreads suggest growing speculative complexity.
• Commercials:
+7,876 longs | –9,084 shorts → Moderate commercial bullish bias.
• Open Interest:
+8,076 contracts → Market activity increasing.
Overall COT positioning is neutral to slightly bullish, with growing signs of accumulation around the 1000 level.
3. Seasonality – MarketBulls
Historically, July is one of the weakest months for Soybeans:
• –44.82 (20Y avg)
• –36.86 (15Y avg)
• –34.74 (10Y avg)
However, early August shows signs of seasonal recovery, and price action is already diverging from typical seasonal behavior.
This makes a deeper breakdown less likely — we could be nearing the end of the seasonal weakness.
Operational Takeaway
Current Bias: Neutral-to-Bullish
Confluence of signals supports the idea of a technical rebound:
✅ Bullish reaction candle in demand
✅ Fibonacci support + lower trendline touch
✅ COT data stabilizing with rising open interest
✅ Seasonal weakness possibly exhausted

EUR/USD Reversal Ahead? COT + DXY Strength Signal Price has broken below the ascending channel that started in mid-May.
The current candle is rejecting the weekly supply zone (1.17566–1.18319), leaving a significant upper wick.
Daily RSI is losing strength but has not yet reached extreme levels.
A key daily Fair Value Gap (FVG) lies between 1.1600 and 1.1480, with the first potential downside target at 1.14802, which aligns with support and the FVG zone.
A deeper bearish continuation could push price towards 1.1350, but only if the FVG lows are clearly broken.
📊 COT Data (CME - Euro FX & USD Index)
Euro FX
Net long: +15,334
Commercials increased both longs (+13,550) and shorts (+9,913) → mild divergence.
Non-Commercials (speculators) increased shorts (+4,786) more than longs (+1,188) → speculative bias tilting bearish.
USD Index
Strong net long accumulation across all trader types: +4,597 net.
Non-Commercials added +3,590 longs, with only a minor increase in shorts.
→ USD strength continues, reinforcing potential weakness in EUR/USD.
🧠 Retail Sentiment
67% of retail traders are short EUR/USD → typically a contrarian bullish signal.
However, the price is already showing distribution, not accumulation, so we may see price push lower first to trap remaining retail longs, invalidating the contrarian signal in the short term.
📅 Seasonality
July is historically bullish, especially on the 2Y (+0.0142) and 10Y (+0.0106) averages.
However, the 15Y and 20Y averages show a much more moderate performance (+0.007 / +0.0025).
Based on current price action, the seasonal rally may have already played out with the run-up to 1.1830. A correction now seems likely, even if the broader macro remains supportive mid-term.
🧩 Conclusion
Despite historically bullish seasonality for July, both price action and COT data indicate distribution with early signs of reversal.
Retail sentiment is too skewed short for a major breakdown just yet, but the technicals support a short-term pullback toward more balanced levels.
USD strength from COT and DXY structure reinforces a corrective short bias for now.

XAUUSD SCALP TRADEentry based on 5m tf, so wait for the entry and take it, must use sl, you can take 1st entry at cmp, 3348.5 2nd at mentioned and set the target and forget.

The Power of Confluence: Building Trade Setups Using 3 Indicator🔵 INTRODUCTION
Many traders fall into the trap of relying on a single indicator to make trading decisions. While one tool might work occasionally, it often leads to inconsistent results. The key to consistency lies in confluence — the strategic combination of multiple indicators that confirm each other.
In this article, you'll learn how to build high-probability trade setups by combining three essential components: trend , momentum , and volume .
🔵 WHY CONFLUENCE MATTERS
Confluence refers to multiple signals pointing in the same direction. When different indicators agree, your trade idea becomes much stronger. It helps reduce noise, avoid false signals, and increase confidence in your entries.
Think of it like crossing a busy road: you wait for the green light, check both sides, and make sure no cars are coming. The more confirmations you have, the safer your move.
🔵 WHAT IS CONFLUENCE IN TRADING?
Confluence means agreement. In trading, it’s when different methods, indicators, or tools all point toward the same outcome.
Think of it like this:
One green light? Maybe.
Two green lights? Worth watching.
Three green lights? That’s a trade worth considering.
Imagine you're planning a road trip. You check the weather forecast (trend), Google Maps traffic (momentum), and ask a local for advice (volume). If all three say “go,” you’re more confident in your decision. Trading works the same way — using multiple tools to validate a setup reduces risk and removes guesswork.
Important: Confluence is NOT about cramming 10 indicators onto your chart. It’s about using a few that each offer different types of information — and only acting when they align.
🔵 THE 3-STEP CONFLUENCE SETUP
1️⃣ Identify the Trend (Using EMAs)
Before entering any trade, you need to know the market direction. You can use:
Moving Averages (e.g., 21 EMA and 50 EMA crossover)
Structure-based analysis (e.g., higher highs = uptrend)
Trade only in the direction of the prevailing trend.
2️⃣ Check Momentum (Using RSI, MACD, or Stochastic)
Momentum tells you whether the market supports the current trend or if it's weakening.
RSI above 50 → Bullish momentum
MACD histogram rising → Acceleration
Stochastic crossing above 20 or 80 → Momentum shifts
Avoid entering when momentum is fading or diverging from price.
3️⃣ Confirm with Volume (To Validate Participation)
Volume reveals the strength behind the move. A breakout or trend continuation is more reliable when it's backed by volume.
Look for:
Volume spikes at breakout points
Increasing volume in the direction of the trend
Volume confirmation after pullbacks or retests
No volume = no conviction. Watch how the market "votes" with actual participation.
🔵 EXAMPLE TRADE SETUP
Let’s say you spot a bullish trend with 21 EMA above 50 EMA. RSI is above 50 and rising. A pullback forms, and volume picks up as price starts to push higher again.
That’s trend + momentum + volume lining up = a confluence-based opportunity.
🔵 BONUS: HOW TO ENHANCE CONFLUENCE
Add price action patterns (flags, wedges, breakouts)
Use support/resistance zones for cleaner entries
Combine with higher timeframe confirmation
Wait for retests after breakouts instead of chasing
Confluence doesn't mean complexity — it means clarity.
🔵 CONCLUSION
The best traders don’t guess. They wait for the market to align. By combining trend, momentum, and volume, you filter out weak setups and focus only on the highest-probability trades.
Start testing confluence-based setups in your strategy. You’ll likely find more consistency, fewer fakeouts, and greater confidence in your execution.
Do you trade with confluence? What’s your favorite trio of indicators? Let’s talk in the comments.

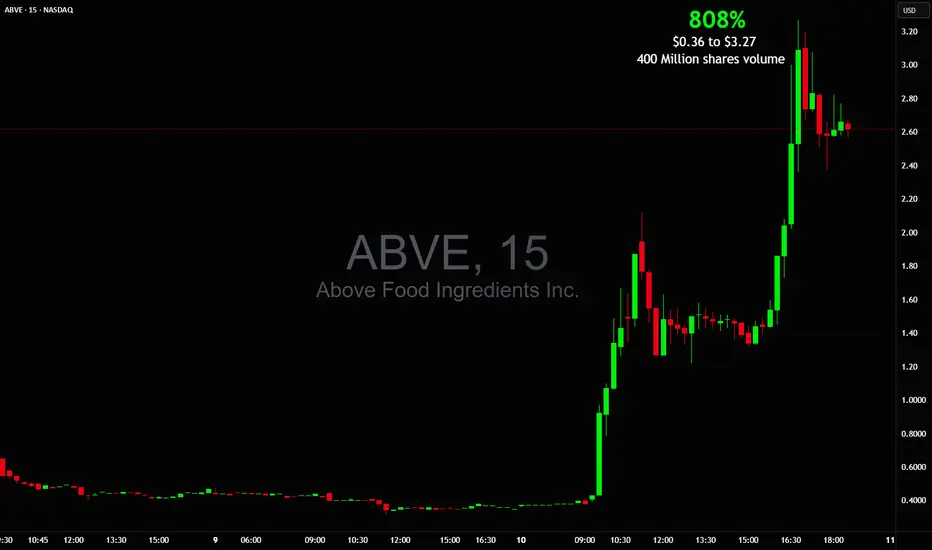
WOW! 808% in 1 day $0.36 to $3.27 on BIG 400M+ shares tradedMentioned it in chat several times with breakout prices
It traded more shares than NASDAQ:NVDA NASDAQ:TSLA NASDAQ:AAPL and NASDAQ:AMZN combined!
NASDAQ:ABVE picture perfect after hours squeeze
$MSTR Continues on last weeks path!NASDAQ:MSTR continues to breakout above the channel after a retest as support.
High Volume Node at $440 may proof tough but if price breaks through we could see a strong FOMO induced breakout into price discovery.
Analysis is invalidated below the channel at $358.
Safe Trading

Negative Risk/Reward: Hidden Edge or Hidden Danger?It’s a topic that sparks plenty of debate.
👉 Can a negative risk/reward ratio actually be part of a winning strategy?
Here’s our take, split between intraday trading and swing trading:
📉 Intraday Trading
☑️ Pros:
• Can work in high‑probability setups (mean‑reversion, range scalps)
• Quick targets often get hit before stops
• Stops can sit beyond liquidity grabs to protect the trade
⚠️ Cons:
• Needs a consistently high win rate
• Prone to slippage and fast spikes
• Can lead to over‑trading if discipline slips
If used, risk must always be pre‑defined — not adjusted mid‑trade.
⏳ Swing Trading
☑️ Pros:
• Occasionally helps avoid being stopped on deeper pullbacks
• Gives breathing room in trending markets
⚠️ Cons:
• Smaller targets vs bigger stops rarely pay off over time
• Lower win rate on higher timeframes makes it hard to sustain
• Exposed to news gaps & weekend risk
Overall, swing trading works best with positive R/R setups (e.g., 2:1 or higher).
☑️ Summary:
Negative R/R can work — but only if:
• The setup is statistically proven & high probability
• You keep risk strictly pre‑defined
• It fits the pair, timeframe & volatility
Most traders are better off sticking to positive R/R — but for experienced scalpers, negative R/R can be a tool rather than a trap.
💭 Do you use negative risk/reward in your strategy?
Only intraday, or do you apply it to swing trades too?
Drop your thoughts below —we're curious to hear how others approach it! 👇
Thanks again for the likes, boosts, and follows — really appreciate the support!
Trade safe and all the best for the week ahead!
BluetonaFX

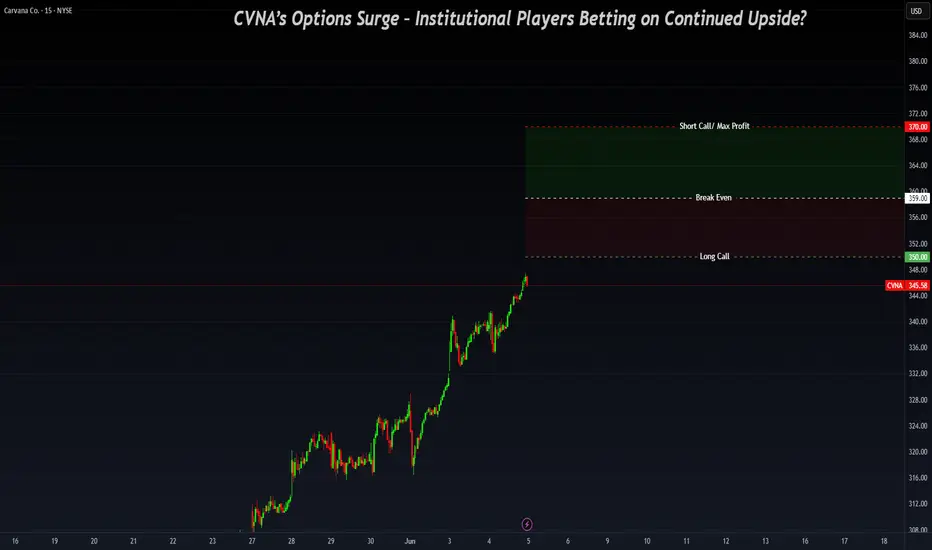
Carvana Leading Auto Retail – Outpacing LAD & AN-Financial Performance & Momentum:
Carvana reported a record-breaking adjusted EBITDA of $488M in Q1 2025, up $253M YoY, with an EBITDA margin of 11.5% (+3.8pp YoY). The company's strong operational efficiency positions it as a leader in the auto retail industry, nearly doubling the margins of competitors like Lithia Motors (LAD) and AutoNation (AN).
- Competitive Positioning & Growth Outlook:
Carvana’s EBITDA quality is superior due to lower non-cash expenses, enhancing long-term sustainability. The company expects sequential EBITDA growth in Q2 and targets 13.5% EBITDA margins within 5-10 years.
-Peer Comparison:
- Lithia Motors (LAD): EBITDA margin at 4.4% (up from 4% YoY), facing tariff-related headwinds that could impact pricing and demand.
- AutoNation (AN): SG&A as a percentage of gross profit rose to 67.5% in Q1, expected to stay between 66-67% in FY 2025, pressuring margins further.
-Options Flow & Institutional Activity - Key Levels: $350/$370
Recent institutional flow activity indicates strong positioning around $350/$370 strikes, potentially signaling a vertical spread in play rather than outright selling:
1️⃣ Momentum Confirmation:
- CVNA has strong upside momentum following its Q1 results, reinforcing a bullish outlook for near-term price action.
- Institutional traders may be accumulating bullish vertical spreads rather than unwinding positions.
Vertical Spread Setup ($350/$370 Strikes)
- Long Call ($350 Strike) → Signals expectations for further upside.
- Short Call ($370 Strike) → Caps max profit while reducing cost.
- Breakeven Price: $359 → CVNA must close above $359 for profitability.
Profit & Risk Zones
- Above $370: Maximum profit achieved.
- Between $359-$370: Partial profit zone (spread remains in play).
- Below $359: Spread loses value, making recovery dependent on extended upside momentum.
NZDUSD - The Bulls Are Exhausted! Hello TradingView Family / Fellow Traders. This is Richard, also known as theSignalyst.
📈NZDUSD has been overall bullish trading within the rising channel marked in blue and it is currently retesting the upper bound of it.
Moreover, the green zone is a strong weekly resistance.
🏹 Thus, the highlighted red circle is a strong area to look for sell setups as it is the intersection of the upper blue trendline and green resistance.
📚 As per my trading style:
As #NZDUSD is hovering around the red circle zone, I will be looking for bearish reversal setups (like a double top pattern, trendline break , and so on...)
📚 Always follow your trading plan regarding entry, risk management, and trade management.
Good luck!
All Strategies Are Good; If Managed Properly!
~Rich
Disclosure: I am part of Trade Nation's Influencer program and receive a monthly fee for using their TradingView charts in my analysis.

Why IonQ (IONQ) Could Be the NVDA of Quantum ComputingIf you haven`t bought IONQ before the rally:
Now you need to know that IonQ isn’t just another speculative quantum stock — The company is building a robust ecosystem around its best‑in‑class trapped‑ion architecture and targeting fault‑tolerant, networked quantum systems. With record bookings, major acquisitions, and a strong balance sheet, IonQ could emerge as the NVIDIA equivalent for quantum infrastructure.
Key Bullish Arguments
1) Superior Quantum Tech – Trapped‑Ion Advantage
IonQ’s trapped-ion processors boast 99.9% two-qubit fidelity, demonstrating higher accuracy and scalability than superconducting alternatives
These systems also operate at room temperature, meaning simpler deployment and lower costs
2) Ecosystem Strategy & Acquisitions
The $1.08B acquisition of Oxford Ionics (expected close in 2025) expands IonQ’s qubit control tech, pushing toward planned 80,000 logical‑qubit systems by decade’s end
Combined with ID Quantique and Lightsynq, IonQ is building a full-stack quantum and networking offering
3) Strong Revenue Growth & Cash Runway
Revenue soared from $22M in 2023 to $43.1M in 2024, with bookings of $95.6M
. Q1 2025 saw $7.6M revenue and EPS –$0.14, beating expectations; cash reserves near $697M provide years of runway
4) Real Commercial Deployments
IonQ sold its Forte Enterprise quantum system to EPB ($22M deal) for hybrid compute and networking, marking real-world commercial applications
5) AI & Quantum Synergy
Involvement in NVIDIA’s Quantum Day and hybrid quantum‑classical AI demos (e.g., blood pump simulation with Ansys, ~12 % faster) indicates strategic synergy and positions IonQ as a critical piece in the future AI stack
Recent Catalysts:
Texas Quantum Initiative passes – positions IonQ at forefront of U.S. state-backed innovation
Oxford Ionics acquisition pending – major expansion in qubit scale & tech
Barron’s analyst buys – industry analysts see long-term potential; IonQ among top quantum picks
Broader quantum optimism – McKinsey & Morgan Stanley forecasts highlight synergy between quantum and AI, benefiting IonQ

WOW $4 to $74 Big 1,655% in just 2 daysGet ready for new power runners to emerge from this AMEX:BMNR move

$MSTR Megatrend Continuation?NASDAQ:MSTR is market leader in the CRYPTOCAP:BTC strategic reserves strategy and has set the benchmark.
After a nearly 20x rally profit take is exceptive, price has held up extremely well through the last 6 months only dropping to the .236 Fibonacci retracement and weekly pivot. As Bitcoin continues into price discovery expect the MSTR rally to continue with renewed tailwinds.
It is an extremely hated stock as well as its collection of yield baring derivatives. The keeps the social mood / sentiment low which could prove further tailwind for growth.
I am looking at a terminal target this cycle of around $1500 at the R5 weekly pivot.
Safe trading

Master the Trio => to Level Up Your Trading🧠Most traders obsess over chart patterns and price action—but lasting success comes from mastering three pillars together:
Technical Analysis. Risk Management. Trading Psychology.
Miss one, and the structure collapses.
Let’s dive into each one, and see how they work together like a high-performance trading engine:
📈 1. Technical Analysis – Think in Layers, Not Lines
Most traders draw lines. Great traders read behavior.
Instead of asking “Is this support holding?”, ask “Why would smart money defend this level?”
Markets aren’t driven by lines—they’re driven by liquidity, trapped traders, and imbalances. That’s why:
A fakeout isn’t failure—it’s often a feature.
A breakout isn’t a buy signal—it’s bait.
Trendlines aren’t magic—they’re just visualizations of collective bias.
🔍 Advanced tip: When analyzing a chart, map out:
Where liquidity is resting (above equal highs/lows, tight consolidations)
Who’s likely trapped (late buyers at resistance, early sellers during accumulation)
Where the market must not go if your bias is correct (invalidations)
The real edge? Seeing the chart as a battle of intentions, not just candles.
🛡️ 2. Risk Management – Your License to Play the Game
Every trade is a bet. But without proper risk, it’s a gamble.
Risk management isn’t just about stop losses—it’s about position sizing, asymmetry, and survival.
I risk no more than 1% per trade , regardless of conviction.
I aim for 2R minimum —because even with a 50% win rate, I still grow.
I define my invalidation before I enter, never after.
You can’t control the outcome, but you can control your exposure. That’s professional.
🧠 3. Trading Psychology – Where Most Traders Break
You can have the perfect setup and smart risk, but still sabotage yourself.
Why? Because emotion overrides logic —especially when money is on the line.
Ever moved your stop? Chased a candle? Closed a trade too early, only to see it hit your TP later?
That’s not lack of skill—it’s lack of emotional discipline.
What works for me:
Journaling every trade—not just the result, but how I felt
Practicing “sit tight” discipline after entries
Reminding myself that no single trade matters—only the process does
You don’t trade the chart—you trade your beliefs about the chart. Master yourself first.
🔄 Final Thoughts
Trading isn’t just about entries.
It’s a mental game played on financial charts, where edge lies in understanding market mechanics, protecting capital, and staying emotionally grounded.
TA shows you the “what”
Risk shows you the “how much”
Psychology decides the “how well”
Master all three—and you’ll separate yourself from 95% of traders.
💬 Which of the three is your strongest? And which one needs more work?
Let’s grow together—drop your thoughts in the comments 👇
All Strategies Are Good; If Managed Properly!
~Richard Nasr

+266% in ONE DAY from $1.30 to $4.75 $RCT🔥 +266% in ONE DAY from $1.30 to $4.76 🚀
Spotted the setup early, but my official safety criteria checklist wasn't all green due to price action until later when it was too late NASDAQ:RCT
Sometimes discipline keeps you out early on even when the move goes wild

Sharing the advanced Bollinger Bands strategyHere are the Bollinger Band trading tips: *
📌 If you break above the upper band and then drop back down through it, confirm a short signal!
📌 If you drop below the lower band and then move back up through it, confirm a long signal!
📌 If you continue to drop below the middle band, add to your short position; if you break above the middle band, add to your long position!
Pretty straightforward, right? This means you won’t be waiting for the middle band to signal before acting; you’ll be ahead of the game, capturing market turning points!
Let’s break it down with some examples:
1. When Bitcoin breaks above the upper Bollinger Band, it looks strong, but quickly drops back below:
➡️ That’s a “bull trap”—time to go short!
2. If Bitcoin crashes below the lower band and then pops back up:
➡️ Bears are running out of steam—time to go long and grab that rebound!
3. If the price keeps moving above the middle band:
➡️ Add to your long or short positions to ride the trend without being greedy or hesitant.
Why is this method powerful?
It combines “edge recognition + trend confirmation” for double protection:
1. Edge Recognition—spot the turning point and act early.
2. Trend Confirmation—wait for the middle band breakout and then confidently add positions!
You won’t be reacting after the fact; you’ll be ahead of the curve, increasing your positions in the trend’s middle and locking in profits at the end. This is the rhythm of professional traders and the core logic of systematic profits!
Who is this method for?
- You want precise entry and exit points.
- You’re tired of “chasing highs and cutting losses.”
- You want a clear, executable trading system.
- You want to go from “I see the chart but don’t act” to “I see the signal and take action.”
Follow for more. Make sure to like this if you found it useful.

85% of Traders Are Wrong on GBPCAD - I'm Going Short!📊 COT Analysis
GBP:
Non-Commercials remain net long with 106,282 longs vs 63,425 shorts. However, long positions are decreasing (-4,794) while shorts are slightly increasing (+3,983), suggesting profit-taking or a potential shift in sentiment.
Commercials are strongly net short (35,707 longs vs 87,770 shorts), with a significant reduction in both longs (-24,958) and shorts (-33,457) — a clear reduction in overall exposure.
→ Non-Commercial positioning is still bullish, but momentum is fading.
CAD:
Non-Commercials remain heavily net short (28,154 longs vs 94,487 shorts), but notable changes are taking place: sharp increase in longs (+8,503) and a significant cut in shorts (-18,307), pointing to a possible reversal in sentiment.
Commercials are net long with a rise in both longs (+1,834) and shorts (+31,186), indicating potential hedging as expectations shift.
→ CAD strength is emerging in the COT data, supporting a potential bearish move on GBPCAD.
📈 Seasonality – June/July
GBP tends to perform poorly in June across all historical averages (-0.004 / -0.006). July shows slight positivity but is statistically insignificant.
CAD has a mildly negative June, but July is historically its strongest month (+0.006 / +0.007 on 20Y and 15Y averages).
→ Seasonal bias favors CAD strength in the June–July transition.
🧠 Retail Sentiment
Retail traders are 85% long on GBPCAD, a strong contrarian signal.
→ Such imbalance increases the odds of a correction or reversal to the downside.
→ Confirms short bias.
📉 Price Action & RSI
Price surged into strong resistance at 1.8779 (triple top area).
Current daily rejection + RSI in overbought territory suggest a potential swing high forming.
Natural downside target: 1.8400–1.8450 (prior structure and base of the move).
→ Ideal short setup from resistance with confirmation via bearish price action.

AUDCHF at Make-or-Break Zone: Smart Money Reversal or Breakdown?1. Price Action
Price is currently trading within a descending channel, with 0.5244 hovering near a key demand zone (0.5150–0.5200), where a first bullish reaction has already occurred.
The structure suggests a potential fake breakdown, with room for a rebound toward static resistances at 0.5330, and possibly 0.5450.
RSI is rising from oversold, showing signs of a potential bullish divergence.
📌 Technical bias: Waiting for confirmation of a reversal at key support.
Upside targets: 0.5330 > 0.5450.
Ideal stop-loss below 0.5160.
2. Retail Sentiment
72% of retail traders are long, with an average entry at 0.5551, now facing a 300+ pip drawdown.
This increases short-term contrarian bearish pressure, but also signals liquidity above the highs, which could be targeted before a true bullish reversal.
3. Commitment of Traders (as of June 17, 2025)
AUD – Bearish
Massive drop in both commercial longs (-60k) and shorts (-60k) suggests broad disengagement.
Non-commercials remain net short (-69k), with overall open interest declining.
CHF – Neutral to Bullish
CHF also sees declines in positioning, but commercial traders remain firmly net long (+51.7k).
Non-commercials are net short (-25.5k).
📌 COT Conclusion: AUD remains structurally weaker than CHF, but both currencies are showing signs of positioning uncertainty. This compression phase may precede a technical rebound on AUDCHF.
4. Seasonality
AUD
June historically shows modest strength on 10Y and 5Y averages.
However, 2Y data points to weakness → any rally may be short-lived or fragile.
CHF
CHF tends to be strong in June, especially on 20Y and 10Y views.
Yet, short-term (2Y) data shows end-of-month weakness, suggesting possible profit-taking ahead.
✅ Operational Outlook
Short-term bias: Long AUDCHF (corrective rebound)
Medium/long-term bias: Bearish (still in a downtrend)

MKC McCormick & Company Options Ahead of EarningsAnalyzing the options chain and the chart patterns of MKC McCormick & Company prior to the earnings report this week,
I would consider purchasing the 85usd strike price Calls with
an expiration date of 2026-1-16,
for a premium of approximately $1.40.
If these options prove to be profitable prior to the earnings release, I would sell at least half of them.
Disclosure: I am part of Trade Nation's Influencer program and receive a monthly fee for using their TradingView charts in my analysis.

Ready for a new day, please bring another doubler like $EYENReady for a new day, please bring another doubler like NASDAQ:EYEN $5 to $10 or NYSE:SRFM yesterday which were the only 2 trades made and 2 nice wins🙏🏻

Retail is 86% Long on GBPCHF… But Smart Money Is Setting a Trap📊 1. RETAIL SENTIMENT
Long Positions: 86% – Average Entry: 1.1196
Short Positions: 14% – Average Entry: 1.0999
Current Price: 1.1010
Analysis:
Retail positioning is heavily skewed towards longs, with the average long entry significantly above the current market price. This creates vulnerability to downside pressure through stop-loss hunting or a bearish squeeze. Such extreme retail bias often acts as a contrarian signal: smart money may continue pushing the price lower to flush out retail traders before any meaningful reversal occurs.
🧾 2. COMMITMENTS OF TRADERS – COT REPORT (June 10, 2025)
🔹 British Pound (GBP)
Non-Commercials (Speculators): Net Long increasing by +7.4K → now at +51.6K
Commercials (Hedgers): Net Short decreasing by -13.9K → now at -60.5K
Total Open Interest: Decreased by -19K
Interpretation:
Speculators are maintaining strong long exposure on GBP, while commercials are covering some shorts—potentially signaling a short-term pause in bullish momentum. However, the drop in overall open interest suggests possible consolidation or short-term uncertainty.
🔹 Swiss Franc (CHF)
Non-Commercials: Net Shorts reduced by -2.7K
Commercials: Net Longs increased by +2.5K
Total Open Interest: Increased by +5.6K
Interpretation:
The CHF is gaining strength. Commercial participants are increasing their long exposure while speculators reduce their shorts—this positive divergence supports a bullish outlook on CHF, especially against retail-heavy long pairs like GBP.
📈 3. CHF SEASONALITY – JUNE
Average CHF Performance in June:
20-Year Avg: +0.0099
15-Year Avg: +0.0138
10-Year Avg: +0.0099
5-Year Avg: +0.0039
Analysis:
Historically, June is a seasonally strong month for the Swiss Franc. This seasonal bias aligns with current macro conditions, reinforcing the bullish case for CHF.
📊 4. TECHNICAL ANALYSIS (Daily Chart)
Pattern: Descending channel with a recent false breakdown and re-entry
Key Support Zone: 1.0980–1.1000 → tested and defended with a bullish wick
Target Resistance: 1.1170–1.1200 → prior retail cluster, supply zone, and average long entry
Scenario: A confirmed breakout of the channel could trigger a short squeeze toward 1.1170–1.1200
📌 STRATEGIC OUTLOOK
The current GBP/CHF setup is technically and sentimentally delicate. The price sits on a major daily demand zone, while sentiment and macro flows suggest downside pressure remains in play—but also allow room for a potential contrarian rally (short squeeze).
👉 Action Plan:
Wait for intraday/daily confirmation:
Go long above 1.1045 (breakout confirmation) → target 1.1170
Go short below 1.0980 (bearish continuation) → target 1.0860
USDCHF 15M ANALYSISThe analysis of my next trade works like this
Our entry is: BULLISH
(1) The 4H trendline broke
(2) We retested the 4H support
(3) We wait for a break and retest of our most recent 15 minute support
(4) We comfirm the bullish direction with our volume indicator (we want to see big volume that surprasses the 20 ema that is included in the volume indicator) and a bullish candlestick close.
IF YOU LIKED THE ANALYSIS PLEASE DROP A FOLLOW
