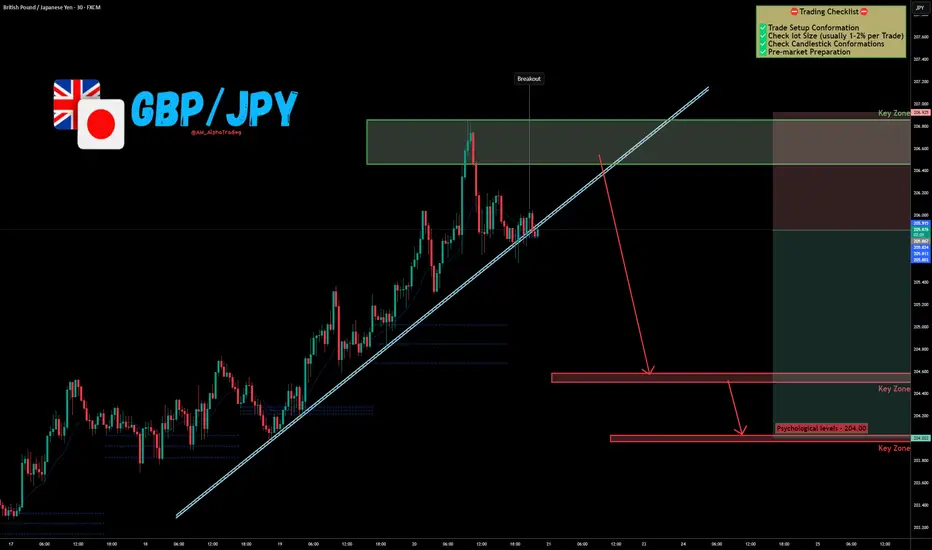
GBP/JPY Rejection at Supply → Next Stop: 204.00 !The GBP/JPY Pair, Price has been trading within a Trendline Breakout on the M30 chart, forming consistent lower highs and lower lows. Price action is now testing the lower boundary of the pattern, signalling a possible breakdown.
✅Market Context:
1️⃣Downward structure building inside the pattern.
2️⃣Sellers are showing strength near support levels.
3️⃣Breakdown below the trendline indicates momentum continuation toward lower zones.
✅Trade Plan :
Entry: Sell after confirmed breakdown below the support (Candle close below trendline or retest of the breakout).
💰Take Profit (TP): At the Key Zone – major support area identified ahead.
🛑Stop Loss (SL): Above the pattern structure / recent swing high.
✅Psychological Discipline:
1️⃣Stick to plan – No Revenge Trades.
2️⃣Accept losing trades as part of the strategy.
3️⃣Risk only 1–2% of your account balance per trade.
✅ Support this analysis with a
LIKE 👍 | COMMENT 💬 | FOLLOW 🔔
It helps a lot & keeps the ideas coming!
⚠️ Disclaimer: This analysis is for educational purposes only and does not constitute financial advice. Forex trading involves high risk. Trade only with capital you can afford to lose and always do your own research.
Supply_and_demand
EUR/USD – Buy Setup DevelopingThe EUR/USD is now showing potential for a buy opportunity after sweeping the trendline liquidity. The pair appears ready to rebound from the 1.15162 level, which aligns with a 1-hour Order Block—adding further confluence for a bullish reaction.
This area may serve as a strong support zone, suggesting a possible upward move if price holds above it.

EUR/USD Analysis – Potential Buy OpportunityThe EUR/USD pair may start moving upwards to fill the liquidity void left during its decline over this week.
If a 15-minute candle closes above 1.15379 or inside this Order Block , this could present a good buying opportunity, with potential for the price to continue rising toward the Liquidity void
Keep a close eye on price action and ensure proper risk management before entering any trade.

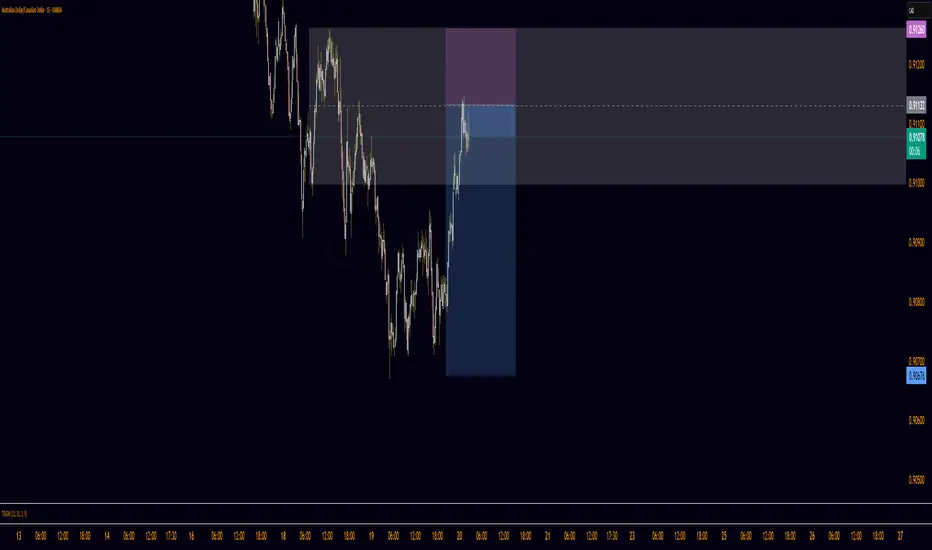
EUR/CAD - Bearish Flag (20.11.2025)🧠 Setup Overview TICKMILL:EURCAD
EUR/CAD is forming a clean Bearish Flag Pattern after a strong impulsive drop.
Price is trading below the EMA, inside a rising corrective channel — a classic continuation structure. With cloud resistance above and repeated rejections from the upper flag boundary, bearish momentum is building. A confirmed breakdown below the lower trendline could trigger the next bearish leg.
📊 Trading Plan🔻 Sell Bias (Primary Scenario)
Watch for a candle break & retest below the flag
Enter short after confirmation
🎯 Targets:
1st Support: 1.6137
2nd Support: 1.6109
❌ Invalidation:
A strong candle close above 1.6230 cancels the bearish view
⚡ Fundamental Outlook – Today (20 Nov 2025)
CAD Fundamentals
1️⃣ Canadian Dollar strengthened as crude oil prices saw a mild rebound, supporting CAD (commodity-linked currency).
2️⃣ Bank of Canada remains cautious, but no new signs of easing have emerged — giving CAD some underlying firmness.
EUR Fundamentals
3️⃣ Euro under pressure due to rate-cut expectations in early 2026 as European economic data remains soft, especially in manufacturing.
4️⃣ Risk-off sentiment pushes flows toward safer currencies, indirectly affecting EUR negatively.
➡️ Fundamentals support a continuation move lower for EUR/CAD.
#EURCAD #Forex #BearishFlag #PriceAction #TechnicalAnalysis #EUR #CAD #ForexTrader #TradingSetup #KABHI_TA_TRADING #ChartsDontLieTradersDontQuit #TradingViewCommunity #SupportAndResistance #BreakoutStrategy
⚠️ Disclaimer
This analysis is for educational purposes only.
Not financial advice — always use proper risk management.
💬 Support My Work ❤️
If this setup helps you:👍 LIKE the post💬 COMMENT your view🔔 FOLLOW for daily setups
Your support motivates me to keep posting high-quality analysis!

EURUSD Short Setup if Key Level BreaksIf the EURUSD manages to break below the 1.15243 level, a potential short opportunity may develop around 1.15273. However, this setup is not confirmed yet, and the key element here is patience and proper validation.
For this scenario to become valid, the market must first close a 15-minute candle below 1.15243. Such a close would indicate that the price has successfully broken through the level and is showing signs of rejection from the 15-minute orderblock, suggesting that sellers are stepping in with intention.
This type of confirmation is essential because it filters out false breaks and ensures that the market is truly shifting momentum. If this rejection is validated, then the retest of 1.15273 could provide a precise and clean entry for short setups, with structure and liquidity alignment supporting the move.
Until that break and close happen, the level remains a potential reaction point rather than a confirmed bearish continuation signal. As always, waiting for clear confirmation helps avoid entering the market prematurely, especially during periods where liquidity sweeps are common.

The Arena of XAUUSD-GOLD: New Round BeginsMy friends, Good Morning,
I have prepared a gold analysis for you in a swing trading structure.
The timeframe of this analysis is 4 hours.
In my XAUUSD-GOLD analysis, I will open sell positions between 4124.0 and 4176.0.
My targets are: TP1 - 3995.0 and TP2 - 3969.0.📊
This analysis is purely for your information.
To my friends who support each of my analyses with their likes,
I share these analyses thanks to your likes, because every single like from you is my greatest source of motivation to keep posting.
I sincerely thank all my friends who leave a like. 🙏
With respect and love.❤️

Advanced Supply and Demand (HORC Trend + SnD StructureAfter studying the charts for some time, I’ve realized that candlesticks are all we need to make money in the market. The question is: can you read the story of market participants — where they showed their hand and revealed their intentions before a break of structure or a change of character, creating imbalances as they seek balance?
A concept called HORC is what I follow. It’s an advanced supply-and-demand framework that incorporates knowledge of participant behavior. In this series I will share what I’m looking at and my intentions.
Warning
Nothing shared here is financial advice; I am not an expert. I am still learning and figuring this out.
GBP/USD - Fundamental Ahead - UK Tax & Upcoming Budget The GBP/USD Pair, Price has been trading within a wedge Pattern on the H1 chart, forming consistent lower highs and lower lows. Price action is now testing the lower boundary of the pattern, signalling a possible breakdown. FPMARKETS:GBPUSD
✅Market Context:
1️⃣Downward structure building inside the pattern.
2️⃣Sellers are showing strength near support levels.
3️⃣Breakdown below the trendline indicates momentum continuation toward lower zones.
✅Trade Plan:
Entry: Sell after confirmed breakdown below the support (Candle close below trendline or retest of the breakout).
💰Take Profit (TP): At the Key Zone – major support area identified ahead.
🛑Stop Loss (SL): Above the pattern structure / recent swing high.
✅Psychological Discipline:
1️⃣Stick to plan – No Revenge Trades.
2️⃣Accept losing trades as part of the strategy.
3️⃣Risk only 1–2% of your account balance per trade.
✅ Support this analysis with a
LIKE 👍 | COMMENT 💬 | FOLLOW 🔔
It helps a lot & keeps the ideas coming!
⚠️ Disclaimer: This analysis is for educational purposes only and does not constitute financial advice. Forex trading involves high risk. Trade only with capital you can afford to lose and always do your own research.

GBP/CAD - Triangle Breakout (17.11.2025)🧠 Setup Overview
GBP/CAD has broken below a symmetrical triangle, signaling a potential bearish continuation after repeated rejections from the upper trendline. The pair is now trading under the breakout level, with sellers showing strong control. If bearish momentum continues, the next support zones become key targets.
📊 Trading Plan 🔻 Bearish Scenario (Primary Bias)
Look for a clean breakdown retest and rejection for confirmation
Bearish continuation expected toward the support areas below
🎯 Targets:
1st Support: 1.8335
2nd Support: 1.8287
⚡ Fundamental Outlook — Today (17 Nov 2025)
GBP Sentiment – The Pound remains under pressure as markets expect the Bank of England to stay cautious, given ongoing inflation uncertainty and slowing economic data.
CAD Sentiment – The Canadian dollar stays supported by stable Bank of Canada policy and improving expectations around the energy sector.
– Rising US bond yields indirectly support CAD’s strength through its correlation with risk-on flows.
➡️ Overall: Fundamentals align with the bearish bias on GBP/CAD.
#GBPCAD #Forex #TechnicalAnalysis #TriangleBreakout #PriceAction #CAD #GBP #ChartPatterns #ForexTrader #TradingView #KABHI_TA_TRADING #ChartsDontLieTradersDontQuit #BearishSetup #MarketOutlook #FXMarket
⚠️ Disclaimer
This analysis is for educational purposes only and not intended as financial advice.
Always wait for confirmation and follow your risk management rules.
💬 Support My Work ❤️
If this helped you:
👍 LIKE, 💬 COMMENT, and 🔔 FOLLOW
Your support encourages more clean chart breakdowns & daily setups!

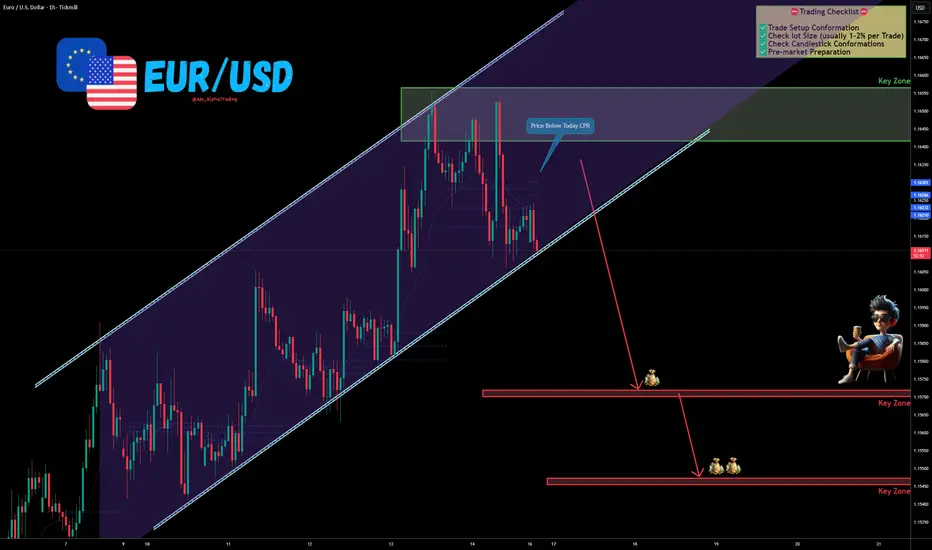
EUR/USD – Channel Breakdown Possibility | CPR Rejection Signals The EUR/USD Pair, Price has been trading within a Channel Pattern on the H1 chart, forming consistent lower highs and lower lows. Price action is now testing the lower boundary of the pattern, signalling a possible breakdown.
✅Market Context:
1️⃣Downward structure building inside the pattern.
2️⃣Sellers are showing strength near support levels.
3️⃣Breakdown below the trendline indicates momentum continuation toward lower zones.
✅Trade Plan:
Entry: Sell after confirmed breakdown below the support (Candle close below trendline or retest of the breakout).
💰Take Profit (TP): At the Key Zone – major support area identified ahead.
🛑Stop Loss (SL): Above the pattern structure / recent swing high.
✅Psychological Discipline:
1️⃣Stick to plan – No Revenge Trades.
2️⃣Accept losing trades as part of the strategy.
3️⃣Risk only 1–2% of your account balance per trade.
✅ Support this analysis with a
LIKE 👍 | COMMENT 💬 | FOLLOW 🔔
It helps a lot & keeps the ideas coming!
⚠️ Disclaimer: This analysis is for educational purposes only and does not constitute financial advice. Forex trading involves high risk. Trade only with capital you can afford to lose and always do your own research.
ETH — Signs of StrengthEthereum has printed a lower low at point B, but quickly reclaimed the low of A — another sign of strength despite overall market weakness.
From a Wyckoff perspective, the elevated volatility around A may indicate a Selling Climax (SC), where panic selling was actively absorbed. The lower low at B followed by a sharp recovery fits the structure of a Terminal Shakeout, which reduces the floating supply before a potential Mark-Up phase.
Price is currently interacting with the descending R-line. A breakout above this level may signal the start of a bullish impulse.
What I expect next:
— Potential bullish breakout above the R-line
— Formation of a local uptrend within the channel
— Move toward the 3,350–3,450 resistance zone, where the mid-term trendline is located (marked as Target)
— Possible confirmation of a shift toward a more bullish market tone heading into the new week

EUR/USD – Falling Wedge Breakout | Bulls Eye Key Resistance ZoneTICKMILL:EURUSD The EUR/USD Pair , Price has been trading within a Wedge Pattern on the H1 chart, forming consistent higher highs and higher lows. Price action is now testing the upper boundary of the Pattern, signalling a possible breakout.
✅Market Context:
1️⃣Strong Upward Structure Inside the Pattern.
2️⃣Buyers are showing strength near Resistance.
3️⃣Breakout above the Trendline indicates Momentum continuation toward higher zones.
✅Trade Plan:
Entry: Buy after Confirmed Breakout above the Resistance (H1 candle close above trendline or retest of the breakout).
💰Take Profit (TP): At the Key Zone – a Major Resistance area identified ahead.
🛑Stop Loss (SL): Below the Pattern Structure.
🟢 Technical Outlook:
Pattern: Falling Wedge (Bullish Reversal)
Confirmation: Breakout & Retest
Targets: 1.1650 → 1.1770
Support Zone: 1.1500 – 1.1450
Momentum: Bullish bias gaining strength
✅Psychological Discipline :
1️⃣Stick to plan – No Revenge Trades.
2️⃣Accept losing trades as Part of the Strategy.
3️⃣Risk only 1–2% of your account balance per trade.
📊 Fundamental View:
The Euro is gaining momentum after recent comments from ECB officials indicating cautious optimism around inflation stability. Meanwhile, the USD faces mild pressure as traders anticipate possible rate cuts by the Federal Reserve in the coming months. Market sentiment currently favors risk assets, giving EUR/USD short-term upside potential.
✅ Support this analysis with a
LIKE 👍 | COMMENT 💬 | FOLLOW 🔔
It helps a lot & keeps the ideas coming!
⚠️ Disclaimer: This analysis is for educational purposes only and does not constitute financial advice. Forex trading involves high risk. Trade only with capital you can afford to lose and always do your own research.

XAU USD - correction playing out of ABC
I'm referring to the Daily price chart and key counts are in line with Wave counting and supply and demand curve trading levels based on fair value gap intervals of weekly trading sessions plotted to a daily chart at intervals of 60.
Current wave - 3 of 5 in the Elliott wave count.
Experiencing ABC corrective structure.
Corrective structure B has formed now nicely at $4,232. XX and rejected nicely, with a newly supply formed - based on A point of structure holding at at $4,372 - $4,217 zone within the inside candle.
Price has nicely breached the wick and sold off accordingly.
Now what happens?
two things -
1. Price will fall to $4000.00 and use this psychological zone and the previous order block to create and nice order block and move up - retaining the Demand control.
2. This looks to be a setup of a technical alignment of a drop, base, drop where price channel or corrective wave from Point B - to point C is forming.
The gap between on the daily structure left shows between $3,850 - 3,720 est is the real zone of interest where the Demand driver will derive from.
Master Key for zones
Black = Three Month
Blue = Monthly
Purple = weekly
Pink = Consolidative box example (Daily)
Orange = Daily
White = Wave
Red = Lines - Fibonacci, wave alignment.
Risk Warning
Trading leveraged products such as Forex, commodities and CFDs, carries with it a high level of risk and so may not be suitable for every investor. Prior to trading the foreign exchange, commodity or CFD market, consider your investment objectives, level of experience and risk appetite. You should never risk more than you can afford to lose. If you fail to understand or are uncertain of the risks involved, please seek independent advice and remember to conduct due diligence as criteria varies to suit the individual.
Below are some of the take aways from the video - please listen again incase any detail is missed.
Do you enjoy the setups?
Professional analyst with 8+ years experience in the capital markets
Focus on technical output not fundamentals
Focus on investing for long term positional moves
Provide updates where necessary - with new updated ideas tracking the progress.
If you like the idea, please leave a like or comment.
To all the followers, thank you for your continued support.
Thanks,
LVPA MMXXIV

Gold: buyers defend the key demand zoneGold has reached the major demand zone at 4026–3993 — the same area where strong bullish reactions appeared multiple times in the past. The chart shows several reversal structures forming right inside this zone, while the price retests previous liquidity sweeps and a fair-value imbalance created before the last upward impulse.
Technically, gold remains inside a local descending channel, but the main focus is on the reaction from the demand zone. This level is supported by previous BOS signals, high-volume reactions and a clear accumulation base. EMA lines remain above the price, confirming the short-term bearish impulse, but zones like this often become the starting point for medium-term reversals.
Fundamentally, gold stays under pressure due to a strong USD and Fed expectations; however, macro-risks and safe-haven demand continue to prevent a deeper decline. If buyers hold 4026–3990, a recovery toward the major supply zone at 4210–4268 becomes highly probable.
Tactically: the main scenario is to look for confirmations to go long inside the demand zone. First target: 4170–4180. Main target: 4210–4268. If the zone breaks down, gold may head toward 3950.
If demand holds, the next impulse may come much faster than the market expects — gold often moves sharply once liquidity is collected.

$DOT / Polkadot - Life SupportWith price coming out of the accumulation range in a downtrend and collapsed under weekly mitigated support/demand.
Price is now retesting this weekly level in a textbook 'break & retest'.
Bulls need to reclaim this area for a chance, other than that it could be curtains.

XAUUSD-GOLD-4H / at a Crossroads: Symmetrical Triangle AnalysisDear Traders,
I’ve prepared a special XAUUSD–gold analysis for you. Gold is currently moving within a symmetrical triangle formation. If gold breaks upward within this triangle and closes a candle, the first target will be the 4160 level. If it breaks downward, the first target will be the 3800 level.
I share these insights because I truly value you. Each follower is precious to me, and together we are like a family here. Every like and show of support motivates me to continue providing these analyses. Thank you sincerely to everyone who stands by me.
With respect and affection.
-TraderTilki

GBP/CAD Rejection at Supply → Next Stop: 1.8350📉 GBP/CAD Analysis – Rising Wedge Breakdown in Motion
GBP/CAD has broken down from a Rising Wedge formation, signaling a potential bearish continuation. Price rejected strongly from the Key Zone (≈1.8550–1.8580), followed by a break + retest of the supporting trendline.
If downside pressure holds, we may see price move toward the Key Zone near 1.8350 (psychological level).
🔎 Technical Insights
✅ Rising Wedge breakdown confirms bearish structure
✅ Retest of support-turned-resistance
✅ Momentum shifting lower
🎯 Downside target → 1.8350 (Key Zone)
A clean continuation move could unfold if sellers sustain control below current structure.
🌍 Fundamental Outlook
• The Bank of Canada (BoC) remains cautious as inflation pressures ease, reducing expectations for aggressive tightening…supportive for CAD strength.
• The Bank of England (BoE) faces slower growth and uncertain monetary outlook, limiting GBP momentum.
• Softer UK business activity + Canada’s stable macro backdrop may help fuel further decline.
Overall fundamentals reinforce bearish sentiment on GBP/CAD.
✅ Support this analysis with a
LIKE 👍 | COMMENT 💬 | FOLLOW 🔔
Your engagement keeps the content flowing!
⚠️ Disclaimer:
This outlook is for educational purposes only. It is not financial advice. Please conduct your own analysis before trading.

USD/JPY - Wedge Breakdown |Watch 150.00 & 148.00✅ USD/JPY Analysis – H4 Chart - Rising Wedge Breakdown Potential
Price is currently respecting a Rising Wedge structure, showing signs of exhaustion near the Key Zone (≈154.20–154.70). We’ve seen a break + minor retest, indicating possible bearish continuation if sellers maintain pressure.
A drop toward the Psychological Level – 150.00 remains likely, followed by a deeper move into the 148.00 Key Zone if momentum continues.
✅ Market Context:
1️⃣Downward structure building inside the pattern.
2️⃣Sellers are showing strength near support levels.
3️⃣Breakdown below the trendline indicates momentum continuation toward lower zones.
✅ Trade Plan:
Entry: Sell after confirmed breakdown below the support (Candle close below trendline or retest of the breakout).
💰Take Profit (TP): At the Key Zone – major support area identified ahead.
🛑Stop Loss (SL): Above the pattern structure / recent swing high.
✅Psychological Discipline:
1️⃣Stick to plan – No Revenge Trades.
2️⃣Accept losing trades as part of the strategy.
3️⃣Risk only 1–2% of your account balance per trade.
✅ Support this analysis with a
LIKE 👍 | COMMENT 💬 | FOLLOW 🔔
It helps a lot & keeps the ideas coming!
⚠️ Disclaimer: This analysis is for educational purposes only and does not constitute financial advice. Forex trading involves high risk. Trade only with capital you can afford to lose and always do your own research.

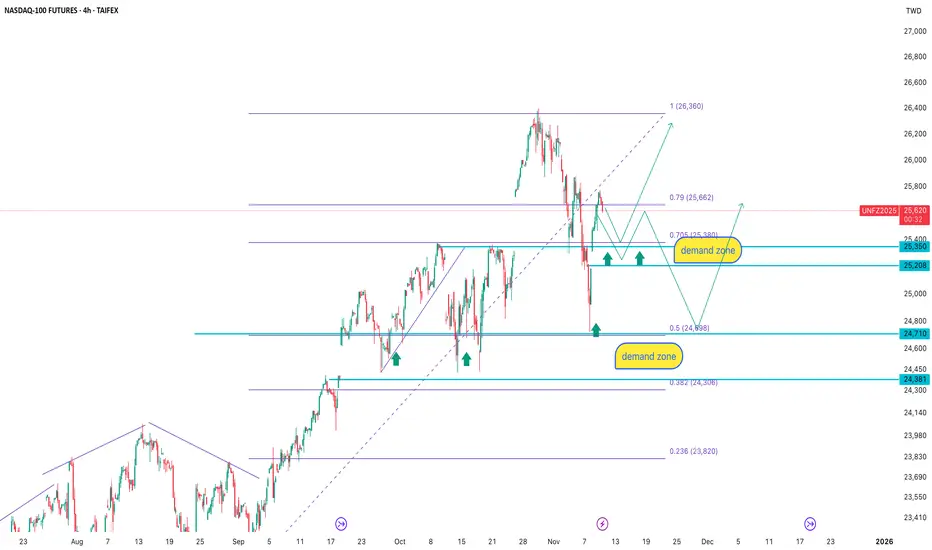
NASDAQ-100 4H: demand is not gone, only waiting for the priceAfter the recent upward impulse, the price retraced into the key demand zone at 25 350–25 208, an area that has repeatedly triggered buying reactions in the past. T
he latest correction pushed the price into the 0.79–0.705 Fibonacci range, which frequently acts as a retest zone before continuation.
Below that lies an even stronger demand zone at 24 710–24 381, aligning with the 0.5 Fibonacci level and previous volume accumulation.
The trading logic here is simple: don’t chase the move, let the price come to demand and wait for confirmation.
As long as the market structure holds, the primary scenario remains bullish from demand zones with a target toward 26 360 and potentially higher.
Fundamentally, NASDAQ remains supported by expectations of softer Fed policy, strong tech capital inflows, and continued investment in AI, cloud, and data-center infrastructure. Smart money accumulates on corrections, not on peaks.
When price falls into demand, it’s not fear — it’s opportunity.
AUD/JPY - Bullish Flag (03.11.2025)🧠 Setup Overview:
AUD/JPY is forming a Bullish Flag Pattern on the 30-minute chart — a continuation setup suggesting potential upside momentum after consolidation. The price has respected the flag support zone and is attempting a breakout above the descending channel, signaling renewed bullish pressure.
💡 Technical Plan: Pattern: Bullish Flag Pattern
Bias: Buy after confirmation breakout and retest
Support Zone: 100.650 – 100.700
Entry Zone: Near 100.850 – 100.900 (after breakout confirmation)
Targets:
🎯 1st Resistance: 101.460
🎯 2nd Resistance: 101.753
Invalidation: Close below 100.600 negates the bullish bias
🌏 Fundamental Insight (Today – 3 Nov 2025)
The AUD finds strength as China’s manufacturing PMI beats expectations, improving sentiment for commodity-linked currencies.
Meanwhile, the JPY remains under pressure due to continued Bank of Japan dovishness and yield differentials favoring risk assets.
Market tone is risk-on, further supporting bullish momentum in AUD/JPY.
⚠️ Disclaimer:
This setup is shared for educational purposes only. It is not financial advice. Always do your own analysis and apply proper risk management before trading any setup.
#AUDJPY #Forex #TechnicalAnalysis #PriceAction #BullishFlag #BreakoutTrading #Ichimoku #KABHI_TA_TRADING #ChartsDontLieTradersDontQuit #ForexSetup #MarketAnalysis #TradingView #FXMarket #BuySetup #ForexCommunity #AUD #JPY #ForexTrader
💬 Support My Work ❤️
If you find this analysis useful — LIKE 👍, COMMENT 💭, and FOLLOW 🔔 for more daily Forex chart updates and trade setups!

XAU/USD Intraday Plan | Watching 3957–3918 for Buyer ReactionGold remains in consolidation after failing to break above the 4042 resistance yesterday. The rejection from the MA200, followed by a break below the 3989 support level.
Price is now trading around 3982, approaching the First Reaction Zone (3957–3918). If this zone fails to hold, further weakness could expose the Support Zone (3884–3851), followed by the HTF Support Zone (3820–3781) as deeper reaction levels.
To shift momentum back to the upside, buyers need to reclaim 3989 and 4042, with the MA200 continuing to act as a major dynamic resistance.
📌 Key levels to watch:
Resistance:
3989
4042
4090
4142
Support:
3957
3918
3884
3851
🔎 Fundamental Focus:
There are no major economic releases on the calendar today, but traders should remain cautious as political headlines and broader fundamental developments can still drive sharp moves in gold.

GBP/AUD - Bearish Flag Pattern in H1GBP/AUD – Sell Entry (H1 – Flag Pattern)
The GBP/AUD Pair, Price has been trading within a Flag Pattern on the H1 chart, forming consistent lower highs and lower lows. Price action is now testing the lower boundary of the pattern, signalling a possible breakdown.
✅Market Context:
1️⃣Downward structure building inside the pattern.
2️⃣Sellers are showing strength near support levels.
3️⃣Breakdown below the trendline indicates momentum continuation toward lower zones.
✅Trade Plan:
Entry: Sell after confirmed breakdown below the support (Candle close below trendline or retest of the breakout).
💰Take Profit (TP): At the Key Zone – major support area identified ahead.
🛑Stop Loss (SL): Above the pattern structure / recent swing high.
✅Psychological Discipline:
1️⃣Stick to plan – No Revenge Trades.
2️⃣Accept losing trades as part of the strategy.
3️⃣Risk only 1–2% of your account balance per trade.
💬 Support the community: If you found this useful, drop a 👍 like and share your thoughts in the comments!
⚠️ Disclaimer: This analysis is for educational purposes only and does not constitute financial advice. Forex trading involves high risk. Trade only with capital you can afford to lose and always do your own research.

AUD/JPY - M30 - Bullish Channel FormationAUD/JPY – Buy Entry (M30- Channel Pattern)
The AUD/JPY Pair, Price has been trading within a Channel Pattern on the M30 chart, forming consistent higher highs and higher lows. Price action is now testing the upper boundary of the Pattern, signalling a possible breakout.
✅Market Context:
1️⃣Strong Upward Structure Inside the Pattern.
2️⃣Buyers are showing strength near Resistance.
3️⃣Breakout above the Trendline indicates Momentum continuation toward higher zones.
✅Trade Plan:
Entry: Buy after Confirmed Breakout above the Resistance (H1 candle close above trendline or retest of the breakout).
💰Take Profit (TP): At the Key Zone – a Major Resistance area identified ahead.
🛑Stop Loss (SL): Below the Pattern Structure.
✅Psychological Discipline :
1️⃣Stick to plan – No Revenge Trades.
2️⃣Accept losing trades as Part of the Strategy.
3️⃣Risk only 1–2% of your account balance per trade.
💬 Support the community: If you found this useful, drop a 👍 like and share your thoughts in the comments!
⚠️ Disclaimer: This analysis is for educational purposes only and does not constitute financial advice. Forex trading involves high risk. Trade only with capital you can afford to lose and always do your own research.
