Gold Breakout and Potential RetraceHey Traders, in today's trading session we are monitoring XAUUSD for a buying opportunity around 3,330 zone, Gold was trading an a downtrend and successfully managed to break it out. Currently is in a correction phase in which it is approaching the retrace area at 3,330 support and resistance zone.
Trade safe, Joe.
Support

$ENS / USDT 1D FAKEOUT ON FLAG? Incoming Pump? 📊 $ENS/USDT Perpetual Contract – Daily Timeframe Analysis
🟢 Bullish Setup
A bullish flag is forming on the daily chart — a continuation pattern indicating potential upward movement.
- Price recently entered into the golden pocket of the Fibonacci retracement tool marked from $16.881 – $25.241 on the third touch of the flag's resistance, triggering a fakeout, it now rests in the first Fair Value Gap.
- The strong wick rejection on the 3rd retest of the resistance/supply indicates bearish strength, momentarily pushing price lower.
- Despite this, the overall pattern remains valid as long as price respects the Golden Pocket and FVG zone below.
✅ If price closes above the golden pocket, it could present an excellent leveraged entry or spot position, with high reward potential off 67%.
🔴 Bearish Scenario
- So far, every test of the **4H supply zone** has resulted in rejection — showing persistent seller control at short-term resistance.
- If buyers fail to defend the golden pocket and recover the bullish trendline, the structure confirms a break. (Downtrend)
The confirmation of bearish pressure is the:
1) Large wick (Creating a shooting start candle pattern)
- Signaling bearish reversal.
2) Large Bearish Marubozu Candle.
- Indicates strong continuation of a downtrend.
3) Candle close below Trend line support.
- Showing Bears were able to successful make a major move.
🔽 In that case, we look to short after FVG confirmation and scalp down toward the daily demand zone.
📌 Patience is key. Let the price show intent before entering.
Please let me know what your thoughts are!

LTC (Litecoin) – Swing Long Setup from Support ZoneLTC is currently pulling back into a key support area between $89 – $96, which has historically provided strong bullish reversals. The zone aligns with a potential higher low on the daily timeframe, making it a solid area for a risk-reward favorable swing long.
🔹 Entry Zone:
$89 – $96 (structural support and previous demand zone)
🎯 Take Profit Targets:
🥇 $133 – $146 (key resistance and prior local highs)
🥈 $180 – $190 (macro range highs and psychological barrier)
🛑 Stop Loss:
Hard stop at $80 (clear break of structure and invalidation of higher low)

GOLD LONG IDEAGold has been extremely bullish in the last few months on higher time frame.
Monthly : Bullish
Weekly : Bullish
Daily: Bullish
4HR : Bullish
I will be buying this bullish trend retracement on 4HR time frame.
But I want to see a bullish price action before I enter the trade for long.
My overall target is the major high created in April.
My RR is 1:5.

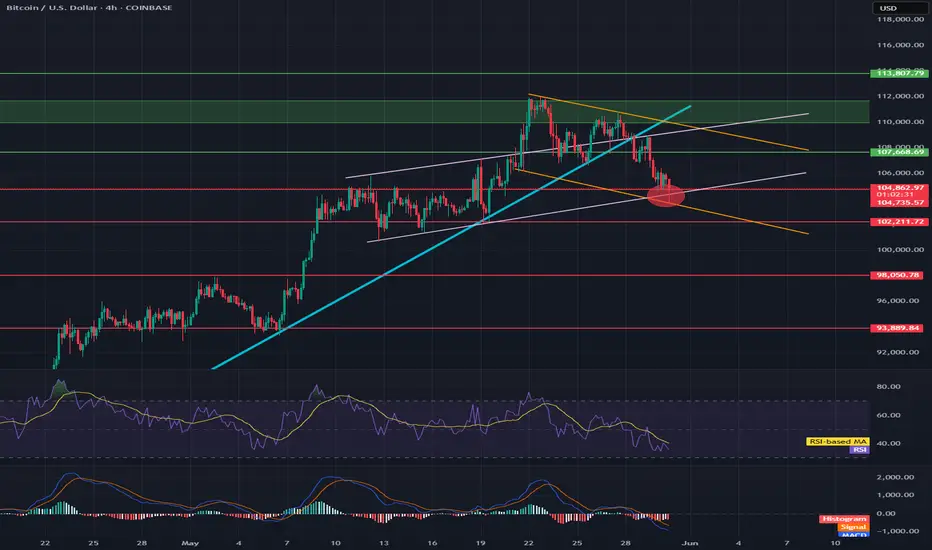
Bitcoin Daily Technical Overview (BTC/USD)Currently, Bitcoin (BTC/USD) is trading around $104,800. Up slightly but still digesting a sharp reversal that rattled short-term bulls.
Recent Price Action: Rejection From $112K
Back on 22nd May, Bitcoin surged to a new high near $112,000, fueled by bullish momentum, institutional flows, and strong on-chain accumulation. However, that breakout was swiftly rejected, and BTC fell as low as $103,400.
This kind of "bull trap" reversal highlights a few key dynamics:
1) Overextended sentiment: The rally above $110K was not supported by volume or follow-through, suggesting exhaustion.
2) Profit-taking by large holders or institutions likely triggered a cascade of stop-losses, accelerating the decline.
3) Liquidation clusters in leveraged long positions likely exacerbated the drop.
Bitcoin is now attempting to reclaim stability around the $104K–$105K range.
🔍 Technical Snapshot
- Support Zones at $103,000 and $93,200
- Resistance Levels at $112,000 (ATH)
Price is still above the 50 & 200-day SMAs, which could be a bullish longer-term signal.
In addition, the price remains above the upper band of the cloud, but momentum is stalling. A decisive bounce off the cloud could reignite bullish sentiment. Or falling into the cloud could trigger more uncertainty and downside.
Macro tailwinds: Concerns over U.S. fiscal stability and potential Fed rate cuts could keep Bitcoin attractive as a non-sovereign asset.
📈 Projection Scenarios
Bullish Case:
If BTC consolidates above $107K, we could see another attempt and retest of $112K.
Bearish Case:
Failure to hold above $103K could see Bitcoin revisit $100K, and if that breaks, downside opens toward the $93K level.
🧭 Insight & Takeaway
The current reversal serves as a healthy reminder that no trend goes up in a straight line. Especially not in crypto.
It likely shook out overleveraged longs, reset sentiment, and may give the market room to breathe before the next leg up.
The long-term trend remains intact, but expect more volatility before any clean break to new highs.
Always DYOR and DYODD and manage your risk.

PENDLE – Bullish Continuation Setup from Key Support ZonePENDLE remains one of the standout performers in the crypto space, maintaining its bullish market structure even amid broader market uncertainty. With price currently holding well above key support, this presents a favorable opportunity for a swing long position, especially if the broader market stabilizes.
📥 Entry Zone:
$3.50 – $4.30
🔹 Confluence with previous resistance turned support
🔹 Demand zone within bullish structure
🔹 Ideal for scaling in
🎯 Take Profit Targets:
🥇 $5.45
🥈 $6.30
🥉 $6.85
🛑 Stop Loss:
Daily close below $3.00
Structure breakdown

RNDR (Render) – Higher Low Setup for Potential Upside ExpansionRENDER is holding strong above the $3.50–$4.00 support zone, forming what appears to be a higher low — a classic sign of potential trend continuation. This setup provides a favorable risk-to-reward ratio with clearly defined invalidation and upside targets.
📥 Entry Zone:
$3.50 – $4.00
🔸 Holding above demand
🔸 Prior resistance now acting as support
🔸 Potential higher low setup
🎯 Take Profit Targets:
🥇 $6.00 – Previous local top / liquidity pocket
🥈 $8.00 – Major resistance zone from prior cycle
🥉 $10.00 – Psychological round number + HTF extension target
🛑 Stop Loss:
Daily close below $2.50
Clears invalidation of the structure
Below HTF support base

HDFC AMC – Bullish Flag Formation on Daily ChartHDFC AMC is currently exhibiting a bullish flag formation, a classic continuation pattern following a strong vertical rally. The recent price action is consolidating within a downward-sloping channel, typically seen as a pause before the next leg up.
Key Technical Levels:
Flag upper boundary (first resistance): Around ₹4,400
Flag high / prior resistance: ₹4,583.65
All-time high: ₹4,867.00
A breakout above the flag’s upper line could signal fresh buying momentum with the potential to first retest the flag high and possibly challenge the all-time high if the breakout sustains.
Fundamentals Snapshot:
Dividend Yield: 1.64%
ROCE: 43.3%
ROE: 32.4%
PE Ratio: 37.09 (vs Industry PE of 20.70)
Growth Metrics:
Compounded Sales Growth:
10 Years: 13%
Compounded Profit Growth:
10 Years: 19%
Stock Price CAGR:
5 Years: 10%
This combination of strong technical setup and solid financial performance suggests HDFC AMC remains a strong contender in the asset management space.
Recent escalations along the India-Pakistan border have led to military confrontations, increasing uncertainty in the broader market. If tensions worsen, volatility may rise, and market sentiment could turn risk-off, impacting financial market. Traders should stay alert for any escalation news.
Disclaimer:
This post is for educational purposes only and is not financial advice. Please do your own research or consult a financial advisor before making any investment decisions. Market conditions and geopolitical developments can change rapidly.

BTC/USD 4h Char ReviewHello everyone, I invite you to review the current situation on BTC taking into account the 4-hour interval. We can see how the price is maintained just below the upward trend line, while a downward trend channel may be forming locally.
Here you can see how the price decline is maintained in a strong support zone from $ 105,000 to $ 103,150, however, if the support zone is broken, the price may quickly fall to the support area at $ 100,700
Looking the other way, you can see that when the trend reverses, we first have resistance at $ 106,560, the next is at $ 108,590, and then you can see very strong resistance at the level of the last ATH in the area of $ 112,000.
On the MACD indicator and the RSI indicator, you can see how we are maintaining in the lower part of the range, which indicates that the price bounce is still taking place to continue the growth.

Solana (SOL) Rectangle (4H)BINANCE:SOLUSDT appears to be forming a rectangle, clearly visible on the 4H chart.
Key Levels to Watch
• $160: Support
• $185: Resistance
Measured Targets
Activated, respectively, with a 4H close with good volume below support or above resistance.
• $135: Rectangle Short Target
• $210: Rectangle Long Target

USD-CHF Growth Ahead! Buy!
Hello,Traders!
USD-CHF is approaching a
Key horizontal support area
Around 0.8189 which is a
Strong level so after the retest
A local bullish correction
And a move up are to be expected
Buy!
Comment and subscribe to help us grow!
Check out other forecasts below too!
Disclosure: I am part of Trade Nation's Influencer program and receive a monthly fee for using their TradingView charts in my analysis.

Will BTC hold its price?Hello everyone, I invite you to review the current situation on BTC. When we enter the four-hour interval, we can see how the BTC price has left the ongoing upward trend line at the bottom, and what's more, we can see how the current movement is creating a local downward trend channel in which the price is currently on the border of the previously created upward trend channel, which gives a strong support point.
Here we can see how the current downward movement has entered the support circle that starts around $ 104,800 and ends around $ 102,200, this is the place where two conflicting channels have converged. If these supports do not hold the price, we can see a quick recovery to around $ 98,000, and then to the level of $ 93,900.
Looking the other way, we can see that when the trend reverses, we first have resistance at $107,670, then a resistance zone from $110,000 to $111,700 is visible, at the border of two channels, and then resistance is visible around $113,800.
On the MACD indicator, we can see a return to the downtrend, while on the RSI we return to the lower part at the lower border, which could potentially provide energy for a future upward movement.
Render – Re-Entry Opportunity After Hitting First TargetRENDER hit the first take profit target (TP1) with a ~52% gain — great execution. Now, after the expected pullback, price is approaching a key support zone, offering a second swing trade opportunity.
🔹 Entry Zone:
Around $4.00 support
🔁 Previous resistance turned support
🧭 Psychological level and structural base
🎯 Take Profit Targets:
🥇 $4.80 (recent local high / resistance)
🥈 $5.40 (next significant supply zone)
🛑 Stop Loss:
$3.69 (below key support & invalidation level)

AMD LONG IDEA: AMD IS READY FOR A GOOD BULLISH RUNAMD is bouncing off the monthly time frame key level that is acting as support for price.
On weekly time frame and daily we had a shift in market structure from bearish trend to bullish.
I will be buying AMD on this retracement to the recent weekly gap created by price.
Once I see a good bullish price confirming that the retracement is over, i will enter for a buy trade.
My overall target is the 187 price level.

Litecoin Is Forming A Bullish PatternLitecoin with ticker LTCUSD made nice and clean five-wave recovery back to 100 area in the 4-hour chart, which confirms support in place and bullish reversal, so it can be a higher degree wave (1), thus more upside is expected for a higher degree wave (3) after current complex W-X-Y correction in wave (2) that can be in final stages. First support is here around 90-85 area, while second deeper one would be at 80 area.

Bitcoin is correcting to support. Possible growth to 110.000Bitcoin failed to hold above 110000, but at the same time the price is forming a flat. The support has not been tested yet (the cascade of orders below the level has not been touched) and within the uptrend the area of 106700 plays an important role.
Based on bitcoin is inside the flat you can consider trading between its boundaries.
Scenario: Within the current movement, the price is likely to form a retest of the 106700 support with the aim of liquidation and accumulation inside the flat. False break of support may attract buyers and in this case bitcoin may test 110000 again.

WLD (Worldcoin) – Long Spot Trade Setup After 180% RallyAfter a massive 180% surge, WLD is showing signs of exhaustion and is likely to retrace toward the next major support zone. A pullback into the $1.22 – $1.35 area provides a favorable entry opportunity for continuation of the trend, assuming support holds.
🔹 Entry Zone (Support):
$1.22 – $1.35
🎯 Take Profit Targets:
🥇 $1.65 – $1.85 (prior consolidation and resistance zone)
🥈 $2.40 – $2.65 (upper range resistance / extension target)
🛑 Stop Loss:
Just below $1.10 (below structural support and invalidation level)

DEEPAK FERTILIZER - Breaking Out in DTF, New ATHDEEPAKFERT has resistance weakening on the Daily charts and has given a breakout with good volume and making a new ATH.
The target of this pattern signals an upside potential of 20% from the current price level in the medium term.
The stock is trading above its 50- and 100-day exponential moving averages (EMAS). The range is more than 1.5X, and the Volume is also 1.5X the average.
CMP- Rs. 1449.80
Target Price- Rs. 1650 (~20% upside)
SL- 1356
Disclaimer: This is not a buy/sell
recommendation. For educational purpose only. Kindly consult your financial advisor before entering a trade.

PNUTUSDT – Breakout Brewing from Bullish Pennant!PNUT Bullish pennant Formation – 200%+ Potential Incoming?! 👀🔥
Hey Traders! If you're all about high-conviction plays and real alpha, smash that 👍 and tap Follow for more setups that actually deliver!
PNUT is consolidating inside a bull pennant after a massive 200%+ rally earlier this month. Currently, it's sitting near the lower support zone, forming higher lows—a sign of growing pressure for an upside move.
🔍 Setup Highlights:
Bull Pennant forming
Strong bounce zone (green box)
Potential breakout path marked in projection
📌 Trade Idea:
Entry: $0.31–$0.28 support zone
Targets: $0.39 / $0.46 / $0.55 / $0.72
SL: Below $0.27
Leverage: 5x–10x (only for experienced traders)
Keep a close eye—once PNUT clears the triangle resistance, things could move fast.
What are your thoughts?

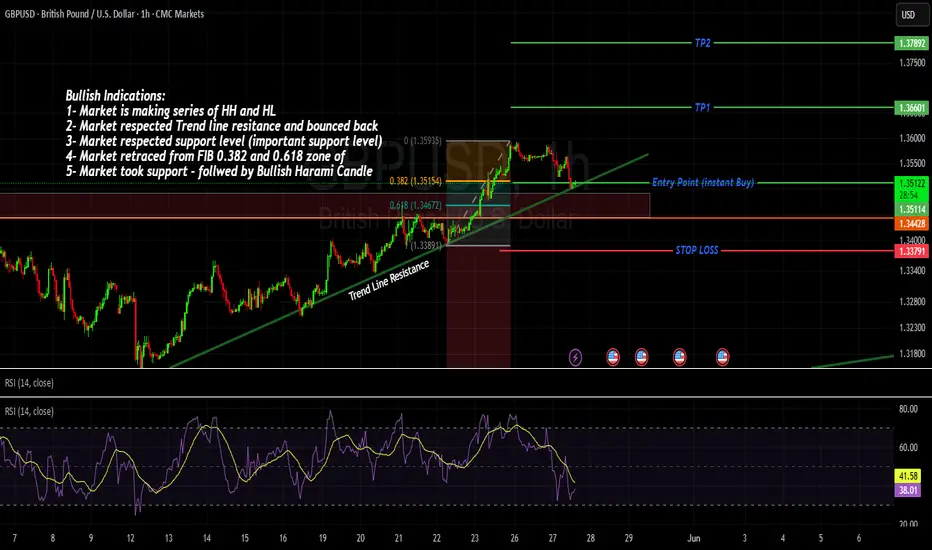
GBPUSD - SO MANY BULLISH CONFLUENCES ! Bullish Indications:
1- Market is making series of HH and HL
2- Market respected Trend line resistance and bounced back
3- Market respected support level (important support level)
4- Market retraced from FIB 0.382 and 0.618 zone of
5- Market took support - followed by Bullish Haram Candle
Entry point - Instant Buy
SL below last LH (Although too much, but safe play)
TP1 and TP11 (with 1:1 and 1:2)
JTO Approaching Breakout Point – Watch This Wedge!🚀 JTO Falling wedge Formation – 100%+ Potential Incoming?! 👀🔥
Hey Traders! If you're all about high-conviction plays and real alpha, smash that 👍 and tap Follow for more setups that actually deliver! 💹💯
JTO has been consolidating within a falling wedge on the daily timeframe for months and is now approaching the apex of the structure.
The price has shown strong demand around the $1.85–$2.00 support zone and is now attempting to push above the wedge resistance trendline.
Technical Highlights:
Falling wedge formation, typically a bullish pattern
Support holding firm at the $2.00 psychological level
Potential for a breakout retest and continuation if volume confirms
Trade Setup
Entry: CMP and add more in the green box(up to $1.8)
Targets: $2.48 / $2.84 / $3.30
Stop Loss: Below $1.85
Risk-to-Reward: Well-structured setup with defined invalidation
A confirmed breakout from this structure could open the door for a strong upside move. Keep an eye on volume and market momentum for confirmation.
What do you think about this? Share your views in the comment section.

Potential NEO 1H ScalpBITGET:NEOUSDT is currently testing resistance around $6.66 with RSI in overbought territory, which could trigger a short-term pullback.
A 0.5–0.618 retracement into the unmitigated hourly FVG ($6.39–$6.47) could provide a compelling long entry, while allowing an RSI reset and potentially forming an IH&S pattern.
The measured target for a breakout above ~$6.66 would be ~7.00 (still valid in case of a direct breakout without a pullback).
Setup 1
• Trigger: Pullback to $6.39–$6.47 and reversal
• Invalidation: Sustained break below $6.39
Setup 2
• Trigger: Break above $6.66 with volume
• Invalidation: Failure to hold $6.66 after breakout

Everybody loves Gold Pt1Everyone loves gold.
With sufficient pips in the bag, we start week 22 with the analysis on gold as highlighted on the chart.
Trade parameters:
SL: 50pips
dtp : dynamic Take profit as momentum leads.

Cardano (ADA) Rectangle + Internal Uptrend (1D)BINANCE:ADAUSDT has spent months ranging between ~$0.51 and ~$1.15, and the structure now clearly qualifies as a rectangle pattern.
After a 3rd touch on support in April, Cardano is showing strength with steady higher lows and a reclaim of a key High Volume Node (HVN).
Key Levels to Watch
• Main Demand: ~$0.51-$0.58
• Rectangle Support: ~$0.51
• Rectangle Resistance: ~$1.15
• Internal Uptrend Support: Rising diagonal from April
• HVN Zone: ~$0.75 — key volume cluster
• Rectangle Midline: ~$0.83 — also a previous S/R
• Main Supply: $1.10–$1.32
Measured Target
If price breaks above $1.15 with volume, the rectangle measured move points to ~$1.80.
Context
ADA has respected this range for nearly half a year. A breakout could mark the start of a macro bullish leg.
Triggers
• Bullish: Clean daily close above $1.15 with volume → $1.80 target activated. For a safer entry, it could be worth waiting a full breakout from the main supply above $1.32.
• Bearish: Breakdown of the ascending trendline and HVN → Potential return to ~$0.51. Failure to hold that level could lead to further downside to the previous ~$0.30 demand zone.
