BNB Ascending Channel (1W)BINANCE:BNBUSDT remains within an ascending channel dating back to January 2024, with multiple strong reactions at both boundaries.
After testing the upper boundary and hitting a new ATH last December, it entered a clear downtrend (orange trendline) that led to multiple attempts at the channel's support.
Price action is now getting compressed, and we could see a breakout soon.
Key Levels
• To the upside, the main resistance remains ~$700 area.
• Above that, CRYPTOCAP:BNB could have a shot at a new ATH and potentially the channel's upper boundary in the ~$900 area.
• To the downside, in case of a channel breakdown, $400 seems the first logical support (important S/R for previous swings).
Still very uncertain and in a No-Trade Zone until a breakout is confirmed.
Support

ADA 1-Year EMA Reclaim and Reversal (1D)After a double bottom at ~$0.50, BINANCE:ADAUSDT reclaimed the 1-year EMA (red) with a ~+9% large bodied daily candle, potentially shifting back to a bullish bias.
Key Levels to Watch
• $0.50-$0.58: Current support, a break below it would invalidate any bullish setup.
• $0.73-$0.77: Current resistance, 0.236 fib extension, HVN, and key S/R in place since February 2022. This is the most crucial level that the bulls need to reclaim.
• $1.10-$1.30: Main supply zone, with significant weekly and daily sell order blocks, plus 0.618 fib extension.
A daily close above above $0.77 would offer a good chance at retesting 2024's highs.

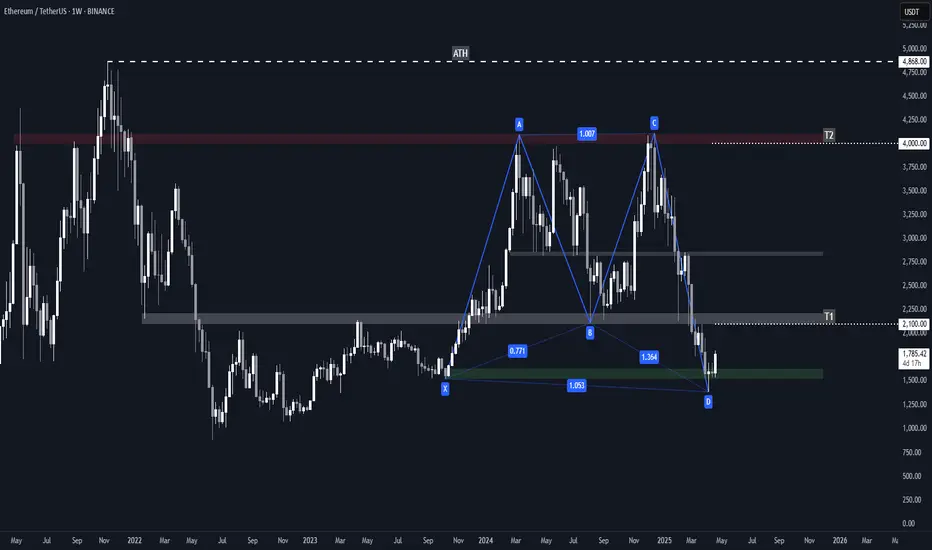
ETH Bullish Navarro 200 Harmonic Pattern + Key Levels / TargetsHarmonic Structure: Navarro 200
Ethereum's weekly chart showcases a fully formed Navarro 200 pattern, identified by:
• A deep B-to-D leg extension (~1.364) — beyond typical harmonic norms, validating the Navarro classification.
• Precise internal Fibonacci alignments:
- XA retracement to B = ~0.771
- BC extension to D = ~1.364
• Completion of point D in a historical demand area around $1500, indicating a potential reversal zone (PRZ).
This harmonic pattern suggests a bullish reversal scenario, contingent on price holding above the $1500 level.
Demand Zone: $1500–$1600
This green box zone represents a major accumulation range from early 2023:
• High volume support — confirmed by prior consolidations.
• On-chain data supports this as a major ETH acquisition zone (1.5M+ ETH bought).
• Current bounce from this area following a liquidity sweep reaffirms it as a strong demand base.
Failure to hold this zone could invalidate the bullish harmonic setup.
Target Zones (Based on Navarro 200 Mechanics)
• T1: $2100–$2200
- Historically significant support-turned-resistance.
- Converges with structural highs and prior breakdown area from mid-2024.
- First logical profit-taking or reaction point following a D-point reversal.
• Mid-Zone: ~$2800
Though not labeled as a target, this is a key supply region to monitor:
- Past consolidations and price rejection.
- Mid-range of the overall pattern.
- Also aligns with prior bullish support in 2024 that flipped to resistance.
• T2: $4000–$4100
- Strong weekly supply zone marked in red.
- Aligns with point C of the pattern.
- Also a psychological barrier near the previous all-time high area ($4,868).
- Likely to see heavy resistance if price rallies that far.
Risks to Watch
• Failure to hold the $1500–$1600 demand zone could send ETH into deeper retracement.
GBPJPY IS A BUY (Britsh Pound-CPI News)TP: 190.00+
SL: 187.00
There is support forming for GBPJPY, which we could be looking for a buying opportunity. We have CPI news for the British Pound Dollar that could make this possible on Wednesday.

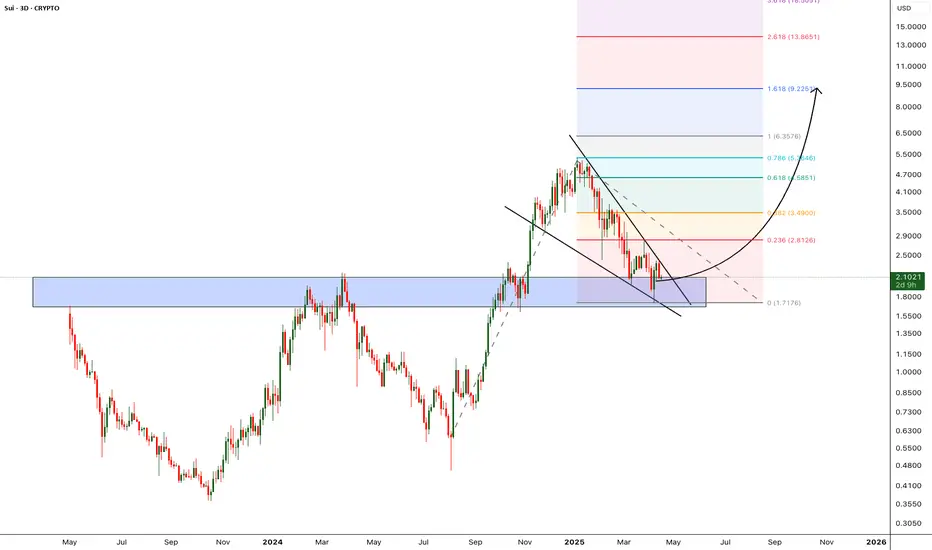
SUI - Double Digit is next - Alt season LeaderCorrection of the SUI is over, currently trading around the previous Support zone. i'm expecting this support to hold and bounce back from the support zone.
Once the price breaks from the falling wedge pattern we can expect the bullish momentum to start and hit new all time high.
Entry: after wedge breakout
Target 1: 2.8
Target 2: 3.49
Target 3: 4.5
Target 4: 5.3
Target 5: 6.3
Target 6: 9.2
SL below 1.68
Cheers
GreenCrypto

GOLD 30M ANALYSISIn this analysis we're focusing on 30m time frame for GOLD. To identify the best buying area and POI for our buy trade setup. In this chart price is creating trendline support and also price break it's previous high. So overall market trend was bullish. According to the market trend my Bias was also bullish. Let's see when price retest and come to our entry zone. Once price comes observe the behavior of price and if price give any bullish confirmation then we'll execute our trade. Let's delve deeper into these levels and potential outcomes.
Always use stoploss for your trade.
Always use proper money management and proper risk to reward ratio.
This is just my analysis.
#XAUUSD 30M Technical Analysis Expected Move.

STX Downtrend Breakout + 2x Bull RSI Divergences (1D)BINANCE:STXUSDT broke out of its downtrend after printing two Bull RSI Divergences in a row, and retesting a demand zone dating back to 2019.
Key Levels to Watch
• $0.45: Main Demand Zone, relevant since 2019. A break below it would invalidate the setup.
• $1.20: Arguably the most important S/R throughout STX's history, in place since March 2021 and potentially a strong resistance, also currently reinforced by the 200-day EMA. If reclaimed, it would most likely shift the bias to bullish.
• $2.70-$3.00: Main Supply Zone to overcome for new ATHs, dating back to April 2021.
Definitely worth taking a look at the chart on the monthly timeframe as well, to grasp the full significance of these levels.
All things considered, this seems a high-conviction trade, with a clean invalidation and a very good R/R.

EURUSD ANALYSISEUR/USD – 2H Bullish Continuation Play
Following a sharp breakout, EUR/USD is gracefully pulling back toward the 1.1095–1.1149 demand zone, now acting as support. This zone holds significance as a potential launchpad for the next bullish wave.
A higher low formation here could ignite continuation toward 1.1471, with extended upside into 1.1605, presenting a clean and favorable risk-to-reward opportunity.
The structure is clear, the momentum is aligned, and the setup reflects a well-composed bullish scenario ideal for patient and precise execution.
▫️ Impulsive breakout
▫️ Retracement to demand zone (1.1095–1.1149)
▫️ Looking for higher low → continuation
🎯 TP1: 1.1471
🎯 TP2: 1.1605
🛡️ Clean R:R, perfect for trend followers.
#EURUSD 2H Technical Analysis Expected Move.

GOLD TODAY OUTLOOKXAU/USD – 30-Minute Technical Setup
Gold has been gliding upward, respecting a clean ascending structure, printing higher highs with strength. But as price taps into the $3,242–$3,267 supply zone, momentum begins to fade.
A potential rejection here signals a structural shift. If the trendline breaks, we could see a clean move down toward the $3,176 demand zone, with $3,203 acting as soft interim support.
This setup reflects precision and patience , anticipating a transition from bullish strength to calculated bearish correction, with a balanced risk-to-reward approach.
Confirmation is very important.
Always use stoploss for your trade.
Always use proper money management and proper risk to reward ratio.
This is just my analysis.
#XAUUSD 30M Technical Analysis Expected Move.

AI Sector Watch – TAO Pullback OpportunityAI-related tokens are showing real strength lately, and TAO has led the charge with a series of green candles. However, the most recent candle suggests potential for a cool-off into support—which could form a higher low and provide a great entry opportunity.
📍 Entry Zone:
$279 (potential higher low formation)
🎯 Take Profit Targets:
🥇 $292
🥈 $317
🛑 Stop Loss:
Below $260 (look for daily close confirmation)
📊 Notes:
If price consolidates above $279 and bounces, it confirms strength.
Watch for volume drop during the pullback—bulls want a light retrace before resuming higher.
If TAO breaks and holds above $292 quickly, you may want to trail your stop.

Good Support168 - 172 is a Very Strong Support Level.
However, 176-177 is an Important Resistance
on Weekly Basis.
Weekly Closing above 170 would be a Positive Sign.

XAUUSD Gold Bearish Setup for upcoming week.XAUUSD Sell Setup – Short from Resistance at 3350
Gold (XAUUSD) has approached a key resistance level around 3350, where previous price action suggests potential for bearish reversal. With the current momentum showing signs of exhaustion, we’re looking for a short opportunity from this zone.
Trade Idea:
Sell Entry: 3350 (resistance level)
Target 1: 3310 – Minor support / first reaction zone
Target 2: 3290 – Key support area
Target 3: 3250 – Major support & potential full TP zone
Stop Loss: Above recent swing high (suggested: 3360–3370)
Analysis:
Price has formed a potential double top / rejection wicks near 3350, signaling possible downside. A break below 3310 will likely accelerate bearish momentum.
Risk Management:
Use proper lot sizing and move SL to breakeven after TP1 for a safe ride to lower targets.

Defined Resistance Zone465 - 502 is a Resistance Zone.
Those who are already holding it, should keep
the Stoploss of 339.
Fresh Entrants may wait for 502 to Cross & Sustain
targeting 545 - 550 & then 600 - 650.

USDJPY – Strong Bounce Incoming from Key Support?Price has tapped into a major support zone that’s held strong since early 2024. With confluence from the Fibonacci 0.618–0.65 retracement overhead, we could see a sharp bullish reversal targeting that region.
🟧 Strong support – historically reactive
📈 Potential bullish reversal in play
📊 Fib confluence at 152 – key reaction area
⏳ Watching for confirmation signs before entry
A clean structure here—could turn into a solid mid-term long setup.
Thoughts? Reversal or continuation lower?

Is This The End of Pullback?BINANCE:SUPERUSDT has entered the support zone between 0.5142 – 0.4754 after a strong impulsive move to the upside.
This support zone is considered valid due to multiple rejections that occurred within this area in the past—indicating strong buyer interest.
Ideally, this is where we expect price to bounce and resume the bullish trend. The first sign of confirmation would be a break above 0.5272, which may open the path toward higher targets.
However, the bullish scenario remains valid only if the price stays above 0.4983—a key invalidation level.
Note:
If this level is breached before a clear candlestick confirmation, the candle pattern being used to validate the move becomes invalid.
Even if the price breaks below the invalidation level, as long as it remains within the support zone, the support is still valid — but it would require the formation of a new bullish candlestick pattern to re-confirm the potential for an upward move.

Still Bullish.Still Bullish.
Long Consolidation Box - Breakout
Still has the potential to touch 26 - 27
Huge Volumes; though candle of 24-03-2025
closed red due to heavy selling but...

XRP Long Swing Setup – Key Support IncomingXRP is pulling back and now approaching a critical support zone between $1.85 - $2.00. This area has historically acted as a launchpad for bullish momentum, and with the broader market eyeing a bounce, it offers a strong risk-to-reward opportunity.
🛒 Entry Zone:
$1.85 – $2.00
🎯 Take Profit Targets:
🥇 $2.20 – $2.35
🥈 $2.60 – $2.75
🛑 Stop Loss:
Just below $1.70 (keep an eye on daily candle closes)

DOGE Trade Setup – Structure Shift in Progress?DOGE just swept the $0.13 liquidity, shaking out weak hands, but price is still holding strong above the $0.15 key support zone. If we get a daily close above $0.18, that could lock in a bullish structure shift and kickstart the next leg up.
📌 Trade Details:
Entry: Around $0.16
Take Profit Targets:
🥇 $0.23
🥈 $0.30
Stop Loss: Daily close below $0.14

$RKLB preparing for takeoff? 3...2...1... NASDAQ:RKLB : Good support in the $15 area, good volume in that buy zone and floating above it's 200EMA/SMA, 50EMA/SMA and a nice weekly candle. Targets: $21.80, $22.50 and mega momentum towards $25.
WSL.

ETH is fighting in the support zoneHello everyone, I invite you to review the current situation on ETH. When we enter the one-day interval, we can see how the ETH price moved in a strong downtrend channel. What's more, we can see that the price fell below the main uptrend line.
As we can see, the price is currently fighting to break out on top in the support zone from $ 1690 to $ 1350, in a situation if this zone was broken, we could see another strong drop to the support area at $ 884 at the previous low after the bull run.
On the other hand, if ETH gets wind in its sails again, it must first pass through the resistance zone from $ 1952 to $ 2100, while further on there is a very strong zone from $ 2500 to $ 2740.
However, here, taking into account the one-day interval, the RSI indicator shows a breakout above the top of the border, which may affect the potential end of the current uptrend.

TAO RectangleBITGET:TAOUSDT has been trading in a well-defined rectangle for the last 16 months.
Key Levels
• $195 - Support, with demand zone extending to ~$260
• $470 - Midline, S/R band extending between $460-$490
• $745 - Resistance, with supply zone extending to $640
Despite a recent fakeout to the downside, TAO recovered support and might be headed for another move to the upside.
Targets
• $1300 in case of a sustained break above $745
• $50 in case of a sustained break below $195

JASMY Falling Channel BreakoutBINANCE:JASMYUSDT just broke out of its falling channel, with strong volume despite it being a weekend move, and is attempting to reclaim the previous support zone around $0.016.
Observations
• Second clear breakout from a descending structure in the last year.
• Good volume spike backing the move — first meaningful demand since the December peak.
• Attempt to reclaim the $0.016 support zone, which had acted as a base throughout 2024.
Key levels
• A daily close above the resistance would confirm the breakout.
• Holding above ~$0.016 would be an even stronger bullish sign.
• Next major resistance at $0.041-$0.045 from the previous supply zone.
• Watch the 1-year EMA above $0.021 as a potential shorter-term resistance.
If momentum continues, this could be the start of a larger trend reversal, with $0.041 as the first upside target.
