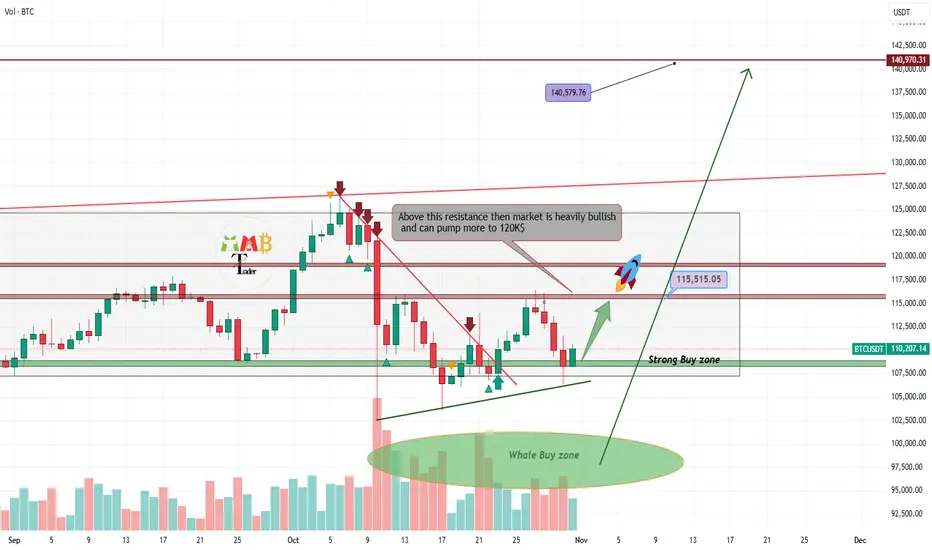
Bitcoin soon will hit 140K$ as new ATHAs the chart illustrates, Bitcoin continues to consolidate within a well-defined range, bounded by the key support at $100,000 and the significant resistance at $117,000. Periods of such compression are typically followed by a decisive directional move, which establishes a new trend path.
Our analysis favors a resolution to the upside. A confirmed breakout, characterized by a decisive daily close above the $117,000 resistance level, would be a strong technical signal. This would invalidate the current range-bound structure and likely reactivate the primary bullish trend.
Such a breakout would open a clear path for price discovery toward new all-time highs. The initial projected technical target following a successful breach is the $140,000 zone, which represents the next major psychological and technical objective.
DISCLAIMER: ((trade based on your own decision))
<<press like👍 if you enjoy💚
Support and Resistance
THE KOG REPORTTHE KOG REPORT
Quick KOG Report this week.
Firstly, we would say it’s the first trading day of the new month so maybe an idea to let the market find it’s feet before jumping in. We’re only going to share the potential path this week and the red box target levels on the breaks. We’ll also stick with some of the red boxes from last week with the new levels to watch out for.
RED BOXES:
Break above 4010 for 4016, 4030, 4044 and 4050 in extension of the move
Break below 4001 for 3995, 3986, 3971 and 3959 in extension of the move
Please do support us by hitting the like button, leaving a comment, and giving us a follow. We’ve been doing this for a long time now providing traders with in-depth free analysis on Gold, so your likes and comments are very much appreciated.
As always, trade safe.
KOG

ETHEREUM: $4,250 Target in Sight Amid Wide Consolidation 📈ETHEREUM is currently undergoing a consolidation phase.
The price is stuck within a wide horizontal channel on the 4-hour timeframe.
We see a strong positive bullish reaction at its support level, leading to a bounce and the formation of a minor resistance.
The violation of this minor resistance indicates a change of character, suggesting a high probability of local buyer dominance.
Our target is at 4250 range resistance.

US CRUDE OIL (WTI): Bullish Move from Key LevelI am quite pleased with how 📈USOIL reacted on a significant horizontal support level on a 4-hour time frame.
Following this test, the pair started to consolidate and form a horizontal range.
A breakout above the resistance of this range provided a strong bullish signal.
We are currently seeing a positive bullish reaction and can anticipate further growth when the market opens.
Our target levels are 61.53 and 62.06.

AUDUSD Breakout and Potential Retrace!Hey Traders, in today's trading session we are monitoring AUDUSD for a selling opportunity around 0.65800 zone, AUDUSD was trading in an uptrend and currently is in a correction phase in which it is approaching the retrace area at 0.65800 support and resistance area.
Trade safe, Joe.

EUR/AUD downside pressure intensifiesEUR/AUD finds itself just above a key zone consisting of horizontal support at 1.7600 and the key 200-day moving average, providing decent two-way trade setups depending on how the near-term price action evolves.
Should we see a break and close beneath both levels, it would allow for shorts to be established below the 200DMA with a stop above for protection, targeting 1.7465 or 1.7400 initially depending on desired risk/reward from the trade. The option would also be there to sell the break should we see a close beneath 1.7600, allowing for a stop to be placed above targeting the same levels. However, consider squaring or even flipping the trade should the price be unable to break beneath the 200DMA.
Should the price continue to hold above 1.7600, you could flip the setup and establish longs, allowing for a stop to be placed beneath the 200DMA for protection. 1.7726 or the intersection of the 50DMA with horizontal resistance at 1.7800 screen as logical targets.
Momentum indicators favour downside over upside, increasing the appeal of bearish setups. RSI (14) is trending lower beneath 50, pointing to building downside pressure. MACD has confirmed the bearish message, crossing the signal line from above before pushing into negative territory.
Good luck!
DS

LINK – Calm Before the Storm?Chainlink is currently consolidating within a neutral accumulation range between $15.5–18.9, showing clear volatility compression on declining volume.
The chart structure combines a downtrend channel, Fibonacci retracement, and a projected volatility cone, all converging toward a potential breakout window around mid-November.
A daily close above FIB 0.236 could trigger the next wave toward $19.9; $21.9; $23.3. While on the other hand, losing $15.5 would likely send LINK back into a deeper correction.
RSI and EMAs are still neutral, so patience is key here.
Sibos conference (Nov 4–5) could be the catalyst that wakes the price up, especially if Chainlink or partners reveal new integrations or institutional news.
Right now, it’s all about patience — volatility is loading, and this looks like the calm before the storm.
Breakout > $18.9
Breakdown < $15.5

Mapping the Next Possible Move | Key Breakout and Demand ZonesGold (XAUUSD) is currently consolidating between key structural zones, showing a balanced tug-of-war between buyers and sellers. The 4025 area remains the short-term resistance to watch — a clean break and close above this level could confirm bullish continuation toward 4075 and the major supply zone around 4150.
On the other hand, failure to sustain above 4025 may trigger a short-term pullback. The 3925–3960 zone has acted as a strong demand area where buyers have consistently stepped in, making it a crucial support for potential bullish rejections and trend continuation.
At this stage, the next possible move will likely depend on how price reacts around these two major zones:
Bullish scenario: Break and retest above 4025 → potential rally toward 4150.
Bearish scenario: Rejection at 4025 → possible correction toward 3925 demand.
Overall sentiment remains neutral-to-bullish as long as price holds above the demand area. Watching for a confirmed breakout or clear rejection structure before taking directional trades is key.

USDJPY Bullish BreakoutPrice is in strong uptrend we are looking for continuation trades to join the bullish momentum.
Price broke out strongly from resistance zone at (153.292 - 152.952).
Price entered into consolidation phase we are waiting for pullback to the key level to join the move.

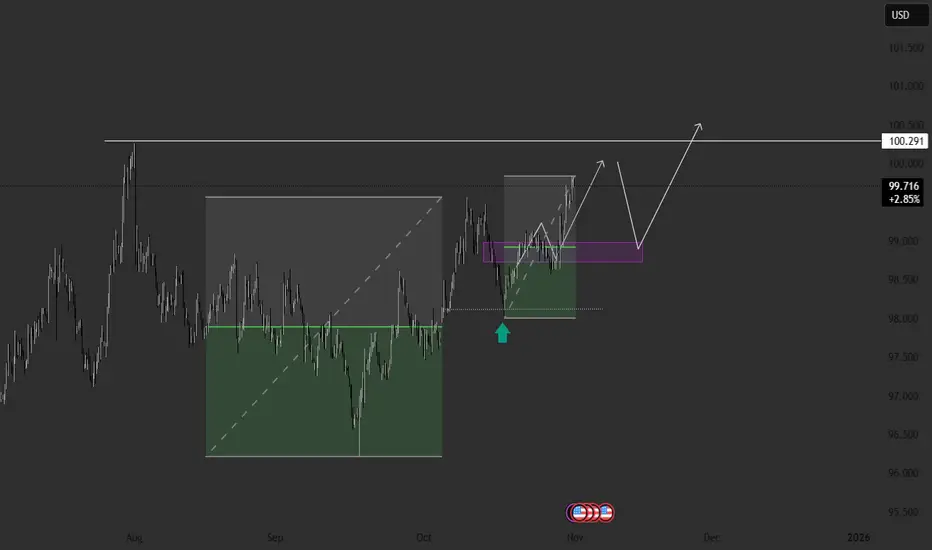
DXY Weekly Outlook – Two Key Scenarios AheadAs expected in the previous review, the price has reached the local point B.
Now the market stands at a crossroads, so let’s look at the possible scenarios for the upcoming week.
Plan A – Correction Within the Daily Order Flow
The first scenario suggests a slight correction.
The price may move into a small pullback within the daily order flow, find support there, and continue the movement toward point B.
As long as the market structure remains bullish, this scenario stays the main one.
Plan B – Possible Decline
However, we don’t cancel the bearish scenario.
Right now, the price is trading inside the weekly key level, and taking out the fractal high often acts as an indicator of a possible trend reversal.
That’s why, if the price breaks below the lower boundary of the daily order flow, I’ll start considering short setups.
Summary
Overall, the structure is still under pressure from major levels, and the coming week will show who takes control — buyers or sellers.
I’ll continue to monitor the reaction within the daily order flow zone and update the outlook in the next review.
NZDJPY near one of the major buy zonesThe NZD/JPY is currently approaching the previously breached trendline resistance, which has now transitioned into a key support level. This retest of the former resistance-turned-support presents a favorable opportunity to consider long positions. We will initiate a long trade within this support zone and define our profit target accordingly.
DISCLAIMER: ((trade based on your own decision))
<<press like👍 if you enjoy💚

Expecting decrease in supply by end of yearBased on the current OPEC's report (October 2025) there is an increase in supply.
The supply will be reduced by the end of year.
In relation to the MFE and MAE we are getting closer to MAE.
We're heading to a discount price (ICT)
Add long position below 44USD

US Dollar: Still Bullish! Wait For The Pullback, Then Buy It!Welcome back to the Weekly Forex Forecast for the week of Nov. 3 - 7th.
In this video, we will analyze the following FX market: USD Dollar
The USD is still bullish, and buys are still valid until there is a definitive bearish BOS.
There is a LQ-Low and a +OB below current prices, drawing prices to it. There, I will look for an HP trade to the upside.
So short term bearishness before the continuation higher.
Should the market break the low of the +OB, then buys are invalidated.
Enjoy!
May profits be upon you.
Leave any questions or comments in the comment section.
I appreciate any feedback from my viewers!
Disclaimer:
I do not provide personal investment advice and I am not a qualified licensed investment advisor.
All information found here, including any ideas, opinions, views, predictions, forecasts, commentaries, suggestions, expressed or implied herein, are for informational, entertainment or educational purposes only and should not be construed as personal investment advice. While the information provided is believed to be accurate, it may include errors or inaccuracies.
I will not and cannot be held liable for any actions you take as a result of anything you read here.
Conduct your own due diligence, or consult a licensed financial advisor or broker before making any and all investment decisions. Any investments, trades, speculations, or decisions made on the basis of any information found on this channel, expressed or implied herein, are committed at your own risk, financial or otherwise.

ADAUSDTBINANCE:ADAUSDT is wait for breakout trendline for start bullish trend so we wait for this breakout and ADA give best signal for buy.

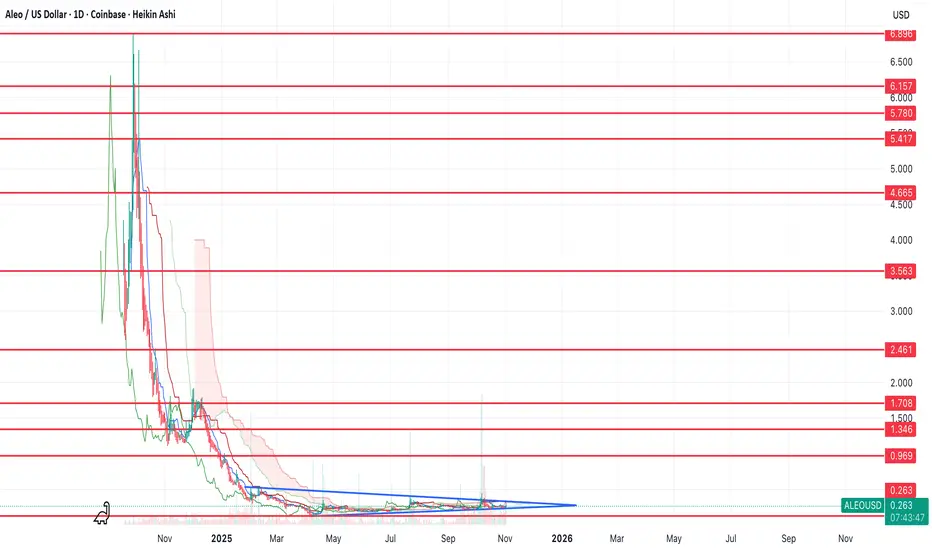
$ALEO bottom in?After correcting from September until now, it looks like ALEO is forming a bottom here and is ready for a reversal.
If we can break out to the upside, then I think we could see a move to one of the upper resistance levels for a 3x+ gain.
Let's see how it plays out over the comings weeks/months.
AXSUSDT and SLPUSDT are next 10X do not lose it Both AXS and SLP are fundamentally robust tokens with strong interlinked utilities. From a technical perspective, they are currently trading at a historically significant support zone, suggesting a potential market bottom. This convergence of positive fundamentals and oversold technical conditions presents a compelling case for a substantial upward revaluation. A significant price appreciation, potentially reaching a 10X return, is a plausible scenario upon a market resurgence.
DISCLAIMER: ((trade based on your own decision))
<<press like👍 if you enjoy💚

GOLD (XAUUSD): Support & Resistance Analysis for Next Week
Here is my structure analysis for Gold for next week.
Support 1: 3868 - 3927 area
Support 2: 3766 - 3830 area
Support 3: 3690 - 3736 area
Resistance 1: 4023 - 4109 area
Resistance 2: 4187 - 4245 area
Resistance 3: 4357 - 4383 area
Consider these structures for pullback/breakout trading.
❤️Please, support my work with like, thank you!❤️
I am part of Trade Nation's Influencer program and receive a monthly fee for using their TradingView charts in my analysis.

Gold Congestion: Clear Levels, Unclear DirectionAfter forming a local low at 3887 last week — a level perfectly aligned with the October ATH area — OANDA:XAUUSD started to recover from the recent 5k pips decline, retesting the 4050 resistance zone, which previously acted as strong support.
Since mid-last week, price action has entered a consolidation phase. Despite high intraday volatility, the structure is beginning to compress into a clear congestion pattern.
This range, roughly 1k pips wide, provides traders with well-defined reference points:
- Support: 3950–3960 zone – a break below this area would likely reopen the path toward the recent 3887 low.
- Resistance: 4040–4050 zone – a confirmed breakout above could trigger a continuation toward 4150.
At this stage, I am slightly bullish, given the sharp rejections from 3920 last week and the emerging ascending triangle structure, which often precedes upward continuation.
Still, confirmation is required — the market must decide whether this congestion is accumulation or distribution.

EURUSD: Support & Resistance Analysis For Next Week 🇪🇺🇺🇸
Here is my latest structure analysis and
important supports & resistances for EURUSD for next week.
Consider these structures for pullback/breakout trading.
❤️Please, support my work with like, thank you!❤️
I am part of Trade Nation's Influencer program and receive a monthly fee for using their TradingView charts in my analysis.

SOL Up to 190 then down to 150Technical analysis. This is what it's all about man. Forecasting price.
So, I predict it's going to $190 because that's where my stop is, as I just entered short for no good reason in this sideways choppy market. Now price is guaranteed to hit my stop loss before actually making a huge move in my initial direction.
If I get stopped out, I'll lose $1000.
But I dont know, I haven't looked at metal commodities in the last few days, but those were coming down recently, so maybe people will start selling these kind of risky gold/crypto assets.
I'd also be curious about a possible gold-btc rotation thing. Has anyone looked into that? Let me know.

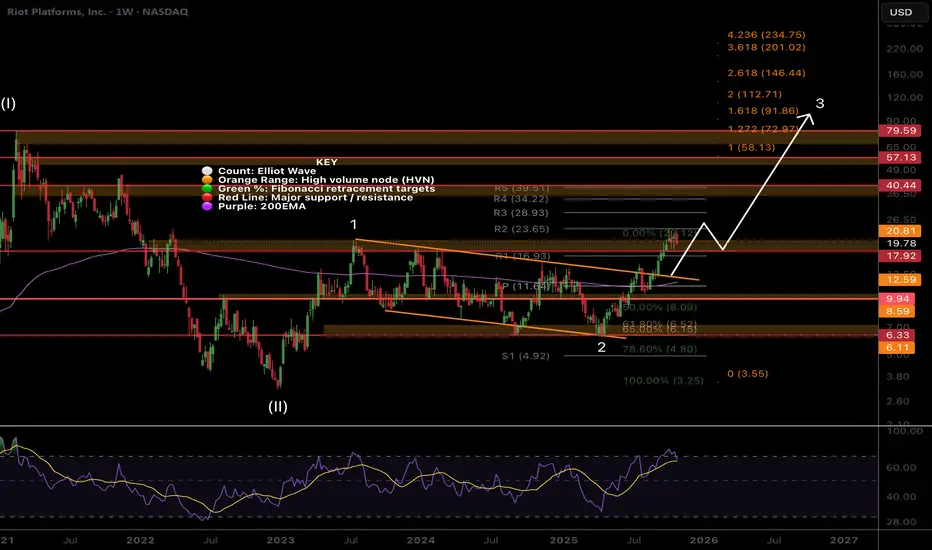
RIOT, nothing changed, Higher...Riot is another low cap volatile asset that keeps people afraid with its wild swings as I am seeing panic in my comments across platforms.
Price remains in momentum breaking out of the channel in a wave 3 with a minimum target of the 1.618 Fibonacci extension at $91, a 4x from here. Wave 2 completed at triple support- Fibonacci golden pocket, High Volume Node and channel boundary before quickly overcoming the weekly pivot and 200EMA. Breaking out above wave 1 is a show of strength.
Price should stall at the High Volume Nodes as supply comes in; $21, $40 and $57 but ultimately they should be overcome.
🎯 Terminal target for the business cycle could see prices as high as $112 based on Fibonacci extensions
📈 Weekly RSI is oversold with no divergence and can remain here for months as price keeps increasing.
👉 Analysis is invalidated if we close back below $9
EURJPY -400pips dump coming Technical analysis indicates that the 178.00 level represents a significant technical resistance for EUR/JPY, further reinforced by a converging trendline. A bearish rejection from this resistance confluence could precipitate a corrective decline. We anticipate a potential downward movement of at least 400 pips upon a confirmed rejection at this level.
DISCLAIMER: ((trade based on your own decision))
<<press like👍 if you enjoy💚

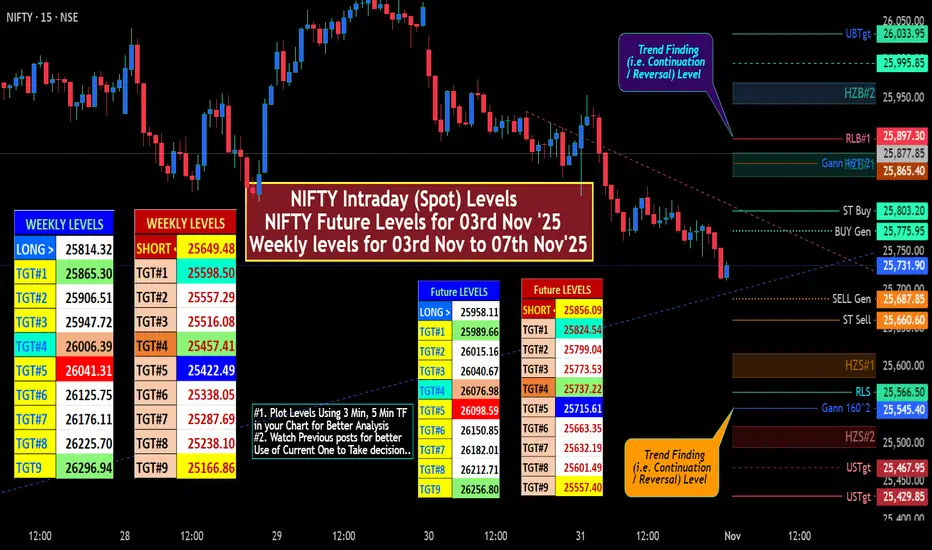
NIFTY IntraSwing (Spot) Futue Levels for 03rd Nov '25✍🏼️ "Future Levels" mentioned in BOX format.
✍🏼️ "WEEKLY Levels" mentioned in BOX format.
🌡️Plot Levels Using 3 Min, 5 Min Time frame in your Chart for Better Analysis
L#1: If the candle crossed & stays above the “Buy Gen”, it is treated / considered as Bullish bias.
L#2: Possibility / Probability of REVERSAL near RLB#1 & UBTgt
L#3: If the candle stays above “Sell Gen” but below “Buy Gen”, it is treated / considered as Sidewise. Aggressive Traders can take Long position near “Sell Gen” either retesting or crossed from Below & vice-versa i.e. can take Short position near “Buy Gen” either retesting or crossed downward from Above.
L#4: If the candle crossed & stays below the “Sell Gen”, it is treated / considered a Bearish bias.
L#5: Possibility / Probability of REVERSAL near RLS#1 & USTgt
HZB (Buy side) & HZS (Sell side) => Hurdle Zone,
*** Specialty of “HZB#1, HZB#2 HZS#1 & HZS#2” is Sidewise (behaviour in Nature)
Rest Plotted and Mentioned on Chart
Color code Used:
Green =. Positive bias.
Red =. Negative bias.
RED in Between Green means Trend Finder / Momentum Change
/ CYCLE Change and Vice Versa.
Notice One thing: HOW LEVELS are Working.
Use any Momentum Indicator / Oscillator or as you "USED to" to Take entry.
⚠️ DISCLAIMER:
The information, views, and ideas shared here are purely for educational and informational purposes only. They are not intended as investment advice or a recommendation to buy, sell, or hold any financial instruments. I am not a SEBI-registered financial adviser.
Trading and investing in the stock market involves risk, and you should do your own research and analysis. You are solely responsible for any decisions made based on this research.
"As HARD EARNED MONEY IS YOUR's, So DECISION SHOULD HAVE TO BE YOUR's".
Do comment if Helpful .
In depth Analysis will be added later (If time Permits) eekly levels for 03rd Nov to 07th Nov'25