Arkham (ARKM) Structure Analysis (1D)Interesting chart for BINANCE:ARKMUSDT
Apologies for the trendlines mess, but they're all potentially relevant.
Watch for
• Bounce at ~$0.49 (0.786 Fib)
• Break above the yellow and orange resistance trendlines (~$0.57)
These conditions could form a Cup & Handle pattern and lead to a retest of the $0.80-$0.85 supply zone.
If that it broken, it could set the next target to ~$1.25.
Support and Resistance

XAUUSD M15 Support & Resistance Levels🚀 Here are some key zones I've identified on the 15m timeframe.
These zones are based on real-time data analysis performed by a custom software I personally developed.
The tool is designed to scan the market continuously and highlight potential areas of interest based on price action behavior and volume dynamics.
Your feedback is welcome!

CETUS/USDT – Spot Accumulation Idea from Strong Support ZoneOn the daily chart, CETUS is currently trading near a well-established **support zone** that has historically acted as a strong demand area. This **Buy Zone** offers an attractive opportunity to accumulate CETUS for a potential mid-term move.
### 🔹 Key Points:
* **Buy Zone:** Between **\$0.102 and \$0.123**
This range has repeatedly shown strong support, making it a favorable area to accumulate spot positions or enter with low leverage (max 2x).
* **Trading Style:** **Spot accumulation**, no leverage or max 2x leverage – focused on swing positioning rather than short-term trades.
* **Risk Management:**
If the price reaches **\$0.13256**, consider **moving the stop-loss to entry** and **partially realizing profits** to secure gains while letting the rest ride toward higher targets.
---
### ⚠️ **Disclaimer:**
This is a personal trading idea based on technical analysis and **not financial advice**. Always do your own research and assess your risk tolerance. Crypto investments carry high risk and may not be suitable for every investor.

GOLD – Bullish Momentum Builds Above 3347, Watch 3366 Break#GOLD | Technical Analysis
The price is currently moving around the pivot level at 3347, which is the key to determining the next direction.
Bullish Scenario:
As long as it stabilizes above 3347, and especially breaks 3366, we expect the bullish momentum to continue toward the resistance at 3404, with potential to test 3431 and the key resistance at 3483.
Bearish Scenario:
If the price breaks below 3347, it may lead to a correction down to 3329, and if this level fails, the move could extend toward the support zone around 3265–3245.
Resistance: 3366, 3404, 3431
Support: 3329, 3265, 3245


US500 potential buyUS500 is setting up for a classic Wyckoff spring. This is a high probability set up with high risk to reward (5R+)
Here is what needs to happen
For situations 1 and 2,
a. price should break blue support (traps sellers and shakes out weak hands)
b. price should then close above any of the 2 blue supports with high volume
c. enter at the close of that bar or retest of the blue line
d. T.P @ recent high.
What do you think? how would you approach this better?

PEPE Ready to Rip? 3 Take-Profits Lined Up from This Key SupportPEPEUSD is currently forming a potential bullish reversal near the key support zone between 0.00001060 and 0.00001099. This level has acted as a solid demand zone previously, with price bouncing off this range multiple times in the recent past. The current price action suggests consolidation above this level, hinting at potential accumulation by buyers.
We can observe a compression in volatility, with recent candles showing smaller bodies and longer wicks near support—classic signs of weakening bearish momentum. The prior price rejection from the 0.00001318 zone and the smooth retracement to support further confirm this as a healthy correction rather than a trend breakdown.
The DPO (Detrended Price Oscillator) is hovering close to zero, suggesting the asset is entering a potential pivot zone. A move into positive territory would support the bullish scenario, ideally confirmed by an increase in volume on the breakout above short-term resistance.
This setup is particularly attractive for scalpers or short-term traders, aiming to capture quick momentum surges across multiple resistance levels.
📌 Trade Setup
• Entry Zone: 0.00001167–0.00001177
• Stop-Loss (SL1): 0.00001060
• Take-Profit 1 (TP1): 0.00001318
• Take-Profit 2 (TP2): 0.00001443
• Take-Profit 3 (TP3): 0.00001603
Strategy Note: The risk-to-reward ratio is highly favorable, particularly for TP2 and TP3. The setup allows for flexible scaling of positions as price hits each resistance level. With no immediate macro threats on the 4H structure and price defending support, this setup offers a clean bullish opportunity.


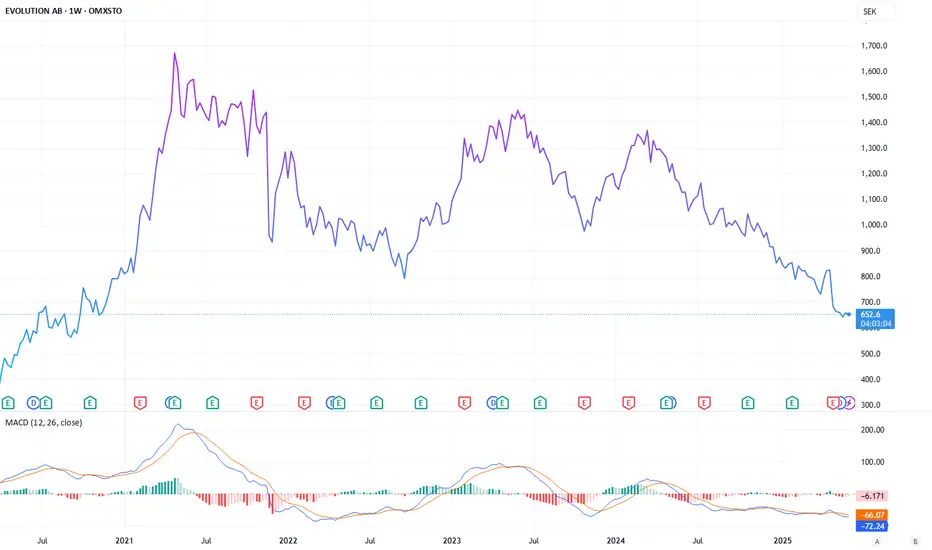
Evolution: How to Profit from Casinos Without the Risk of LosingOMXSTO:EVO CAPITALCOM:USDSEK FOREXCOM:EURSEK
The allure of casinos has always been a double-edged sword-promising riches, but delivering some risks at the same time. Yet, for savvy investors, there’s a way to tap into this lucrative world without rolling the dice. Evolution is introducing itself as a Stockholm-based leader in online casino solutions, whose recent dip in stock price has created a pretty good opportunity for those seeking both growth and income. Traded in Swedish krona, Evolution may offer a chance to diversify portfolios while capitalizing on a sector that thrives regardless of economic cycles.
Evolution’s stock has seen better days. Once soaring at 1500 krona, shares have tumbled to 652 krona, a steep decline driven by the company’s strategic pivot. As it shifts from gray markets-like those under Curaçao licenses-to fully regulated environments in Europe and Asia, Evolution is shedding its riskier past for a more sustainable future. This transition hasn’t been without pain, but the fundamentals tell a different story. With a market cap of 132 billion krona, the company boasts a net profit of 1.244 billion on revenues of 2.214 billion. Its return on assets stands at an impressive 22.9%, and return on equity reaches 30.3%, signaling robust profitability even amidst the turbulence.
For income-focused investors, Evolution shines brighter still. The company offers a 5% dividend yield, outpacing the krona’s 3.2% inflation rate, providing a real return while you wait for growth. Analysts see some serious upside, with a consensus target price of 985 krona-a potential 51% gain from current levels. Such optimism is rooted in Evolution’s dominance in live casino gaming, a sector fueled by global demand for digital entertainment. As the company doubles down on regulated markets, it’s poised to reclaim its former highs, offering a rare blend of safety and potential.
Investing in Evolution isn’t a gamble- it’s calculated bet on a proven winner. With dividends to cushion the ride and a clear path to growth, this casino stock lets you play the house’s hand. For those seeking currency diversification and a foothold in a resilient industry, Evolution may well prove to be a winning ticket worth holding.
PolkaDot (DOT) Structure Analysis (1D)BITGET:DOTUSDT is showing signs of strength after a deviation below the long-standing $3.70–$4.10 demand zone.
Key Levels
• 🟢 Demand Zone: $3.70–$4.10, respected since October 2023
• 🟡 Broken downtrend resistance, retested as support
• ⚪ Current falling channel (compression) following range high retest
• 🟥 Sell Order Block: $5.10–$5.40
• 🟧 Range Resistance: $5.40
• 🎯 Target on breakout: ~$7.00, potential extension to ~$7.50
Thesis
• The recent breakdown was quickly reclaimed, hinting at a possible spring/fakeout. After retesting the range high, price is now compressing within a descending channel, building energy just above demand.
• A breakout from the channel followed by an S/R flip of the $4.40–$4.60 region could trigger a rally toward the upper range.
Watching for
• Channel breakout with volume
• Clean break above $5.40 to confirm range expansion
Invalidation
• Sustained break below the $3.70–$4.10 demand zone

SPX500 – Consolidation Between 5966–5990, Breakout to Set DirectSPX500 | Technical View
The price is currently consolidating between 5966 and 5990.
A 1H or 4H candle close below 5966 would confirm bearish momentum, with downside targets at 5938 and 5905.
However, as long as price trades above 5966, the outlook remains bullish, targeting 5990.
A 1H close above 5990 may extend the move toward 6010 and 6030.
Resistance: 5990, 6010, 6030
Support: 5938, 5905, 5858

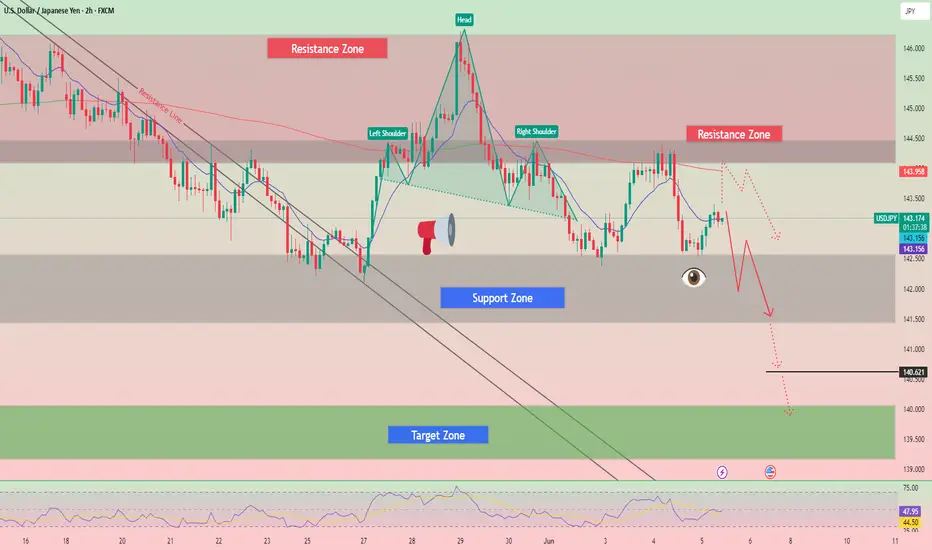
Trading Signals for USD/JPY sell below 146.41The price test at 144.06 coincided with the moment when the MACD indicator had just started moving downward from the zero line, confirming a correct entry point for selling the dollar. As result, the pair plunged toward the target level of 143.39.
Yesterday was marked by significant fluctuations in the currency market, triggered by the release of disappointing data from the United States. The ADP employment report showed a much smaller job increase than expected, and weak ISM services sector figures created a domino effect, leading to a rise in the Japanese yen and a corresponding decline in the US dollar. The market's reaction was swift. Concerned about slowing US economic growth, traders began shedding dollar assets and shifting into traditional "safe-haven" currencies like the yen. This process was further intensified by revised expectations regarding the Federal Reserve's future monetary policy.
Today's weak wage growth data had little impact on the currency market. It appears that market participants had already factored such results into their forecasts, expecting a correction after previously more optimistic reports. Overall, investors are currently focused on more significant indicators of economic health, such as inflation and GDP growth, rates.
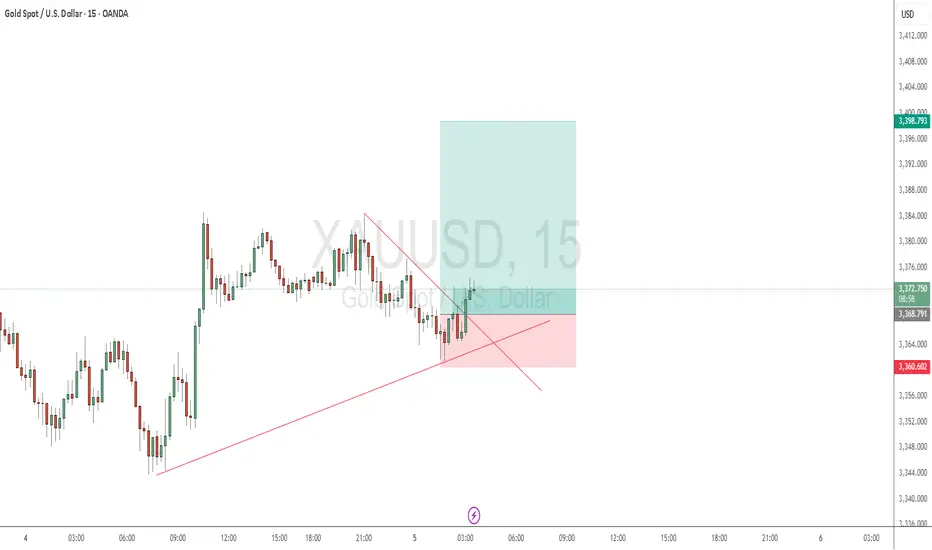
Gold Buy PotentialGold broke a trendline, and since it is an uptrend, I see potential to buy it.
You can wait for the pullback to 3367-3364 or go from here.
Good luck folks
SILVER Multi year Breakout in the works. SLV /SIAMEX:SLV – Silver Setting Up for a Multi-Year Breakout
Silver is quietly coiling under a major 10+ year breakout level, and AMEX:SLV is right in the center of it — with a powerful setup developing.
🔹 Long-Term Breakout Level: $31.75
AMEX:SLV is pressing up against $31.75, a key breakout spot that hasn't been breached in over a decade.
We're currently printing two inside days following a power candle — classic tension-building price action.
🔹 Sector Tailwinds
Gold ( AMEX:GLD ) is up over 1% today — if silver catches up, AMEX:SLV could explode.
A green day here could confirm the strength we need to trigger a move through that decade-level resistance.
🔹 My Trade Plan:
1️⃣ Initial Entry: Looking to go red-to-green on today’s candle.
2️⃣ Add on Confirmation: Double up on a clean breakout over $31.75.
3️⃣ Execution: Using a mix of AMEX:SLV calls and /SI silver futures contracts to capture the move.
4️⃣ Stop: Below inside day lows or Friday’s low depending on the entry timing.
Why I Like This Setup:
Massive long-term breakout on deck = explosive potential.
Inside days = tight risk, big reward.
Sector momentum is lining up with a clean, tradable chart pattern.

Litecoin - Expecting Bearish Continuation In The Short TermM15 - Clean bearish trend with the price creating series of lower highs, lower lows.
No opposite signs.
Expecting further continuation lower until the two Fibonacci resistance zones hold.
If you enjoy this idea, don’t forget to LIKE 👍, FOLLOW ✅, SHARE 🙌, and COMMENT ✍! Drop your thoughts and charts below to keep the discussion going. Your support helps keep this content free and reach more people! 🚀
--------------------------------------------------------------------------------------------------------------------
Disclosure: I am part of Trade Nation's Influencer program and receive a monthly fee for using their TradingView charts in my analysis.

Nifty levels - Jun 06, 2025Nifty support and resistance levels are valuable tools for making informed trading decisions, specifically when combined with the analysis of 5-minute timeframe candlesticks and VWAP. By closely monitoring these levels and observing the price movements within this timeframe, traders can enhance the accuracy of their entry and exit points. It is important to bear in mind that support and resistance levels are not fixed, and they can change over time as market conditions evolve.
The dashed lines on the chart indicate the reaction levels, serving as additional points of significance to consider. Furthermore, take note of the response at the levels of the High, Low, and Close values from the day prior.
We hope you find this information beneficial in your trading endeavors.
* If you found the idea appealing, kindly tap the Boost icon located below the chart. We encourage you to share your thoughts and comments regarding it.
Wishing you success in your trading activities!

DeGRAM | BTCUSD retesting the $105k📊 Technical Analysis
● Triple bounce at 104.8 k-105 k and the violet trend-line created fresh higher-lows while keeping price above the May demand block.
● A two-week falling trend-line has just been cleared and retested, unlocking the next pivot at 108 k; flag depth from 105 k projects to the 111.7 k supply/upper channel rail.
💡 Fundamental Analysis
● FXStreet highlights US job openings at a 3-yr low, pressuring yields, while CoinShares tracks another $450 m spot-ETF inflow and exchange balances at a 4-yr trough, signalling a tightening float.
✨ Summary
Buy 104.8-106 k; clearance of 107 k aims for 111 k, stretch 115 k. Long thesis void on a 2 h close < 103 k.
-------------------
Share your opinion in the comments and support the idea with a like. Thanks for your support!

BankNifty levels - Jun 06, 2025Utilizing the support and resistance levels of BankNifty, along with the 5-minute timeframe candlesticks and VWAP, can enhance the precision of trade entries and exits on or near these levels. It is crucial to recognize that these levels are not static, and they undergo alterations as market dynamics evolve.
The dashed lines on the chart indicate the reaction levels, serving as additional points of significance. Furthermore, take note of the response at the levels of the High, Low, and Close values from the day prior.
We trust that this information proves valuable to you.
* If you found the idea appealing, kindly tap the Boost icon located below the chart. We encourage you to share your thoughts and comments regarding it.
Wishing you successful trading endeavors!

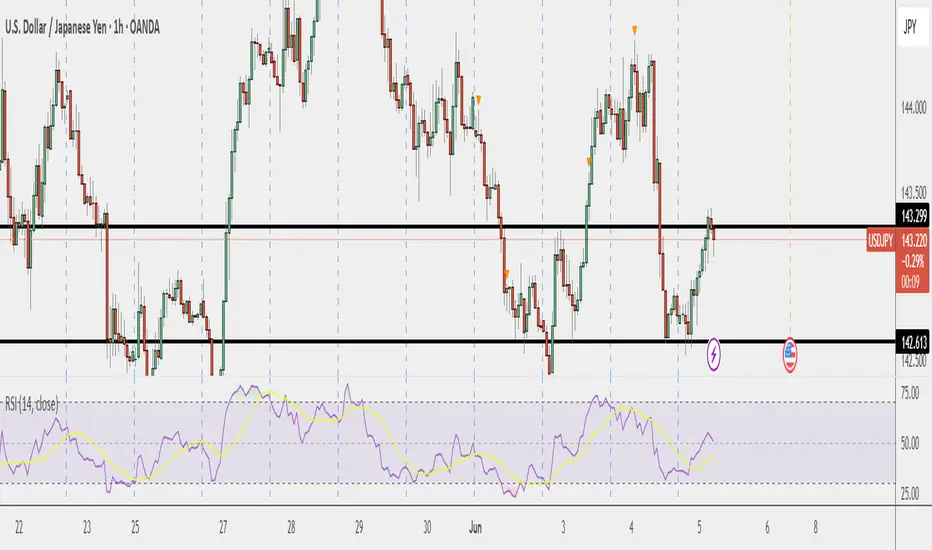
Thursday thoughts Not much to share here today more so waiting for the Non-Farm Payrolls report before any serious movements.
Targets:
Buy open and close above 143.481
Sell open and close below 142.559
I'll post a recap of the week June 6th and more information on Non-Farm Payrolls
I hope anybody who took my calls this week locked in profits. If you are viewing my ideas, please follow. Ideally building a community is my main concern all of our ideas are important and would like to help anywhere I can.
Trading Signals for EUR/USD sell below 1.1432 (21 SMA-6/8 MurrayEUR/USD is trading around 1.1410, below the Murray 6/8 level and within the uptrend channel formed on May 9.
The instrument has an area where buyers have found it easier to take profits around 1.1476. This level could be a barrier for the euro, and from there we could expect a technical correction.
If the bullish force prevails, the euro could reach the top of the uptrend channel around 1.1474 and even the psychological level of 1.1500.
Technically, we observe that the euro is overbought and there could be a technical correction in the coming days, as crucial data from the United States will be released later this week, which could generate strong volatility in the market.
The indicator is showing a negative signal, so if an additional upward movement occurs above the current price, we could consider selling as long as the instrument consolidates below 1.1500.

DeGRAM | GOLD bullish takeover📊 Technical Analysis
● Price reclaimed the grey 3 305-3 330 supply and is now basing on the purple trend-line, turning a former cap into demand and keeping the sequence of higher-lows inside the 2-month rising channel.
● An H16 bullish engulfing fixed above the old channel roof (≈3 342) and completes an ascending triangle whose 1.618 swing points to the 3 435 confluence zone; a break of that ceiling would expose the fib / outer rail cluster near 3 500.
💡 Fundamental Analysis
● World Gold Council reports May was the strongest month of net central-bank buying since January, offsetting ETF outflows, while weaker US ADP hiring trimmed yields and cooled the dollar, supporting bullion.
✨ Summary
Buy 3 305-3 330; triangle break >3 350 targets 3 435, stretch 3 500. Long view void on a 16 h close <3 245.
-------------------
Share your opinion in the comments and support the idea with a like. Thanks for your support!

GOLD → Retesting resistance may lead to a breakoutFX:XAUUSD is still bullish. The price is consolidating in the range of 3390-3345, with an intermediate bottom forming inside the channel, which overall indicates positive signs.
On Thursday, gold is consolidating ahead of $3390. Consolidation after growth, within a bullish trend, is a good sign. But, on the one hand, the price is supported by growing tensions between Russia and Ukraine. On the other hand, optimism about US trade negotiations with Canada, the EU, and China is strengthening the dollar and holding back demand for gold.
Additional pressure on the dollar is coming from weak US macro statistics, especially ADP data and the decline in the ISM Services PMI, which have reinforced expectations of Fed policy easing. Traders are waiting for further signals from the regulator.
Resistance levels: 3391.4, 3414, 3435
Support levels: 3365, 3345
Technically, gold is rising and forming a retest of consolidation resistance. If the 3391 level is broken, the price may head towards 3435. Before breaking through resistance, a correction or retest of 3365 may form. However, consolidation near 3391 and a gradual squeeze towards the level will increase the chances of a breakout and growth.
Best regards, R. Linda!

BTC Long: Entry in 104.7-105.1k on PDL Sweep & OB ActionHey everyone! 🚀
BTC is signaling bullish intent:
Clear order flow from the 78.6% Fib level.
HTF structure continues its uptrend 📈.
This points to a potential trend-following LONG opportunity.
🎯 Entry Zone to Watch: 104,783 – 105,127
Confirmation Checklist for Long Entry:
1️⃣ Mitigation of the 4H Order Block .
2️⃣ Liquidity sweep below PDL (Previous Day's Low) into the OB.
3️⃣ Confirmation on the lower timeframe
👀 I’m now waiting to see the price reaction to this Order Block if price reaches it. Stay tuned!
Trade safe and manage your risk!

Sandur Manganese: Ready for ₹700+?Market Cap: ₹7,794 Cr
Sector: Metals & Mining – Manganese & Iron Ore
Sandur Manganese & Iron Ores Ltd (SMIORE) is a vertically integrated mining company engaged in manganese and iron ore production. With operations rooted in Karnataka and a legacy since 1954, the company continues to benefit from commodity demand and disciplined capital management.
🔍 Fundamental Snapshot
In FY24, Sandur reported revenue of ₹1,252 Cr and net profit of ₹239 Cr, resulting in a solid net margin of 19.06%. EPS stands at ₹29.00, while return ratios remain healthy – ROE at 11.03% and ROCE at 14.97%.
The company maintains a conservative financial structure with a debt-to-equity ratio of 0.54 and a strong current ratio of 4.34. It also rewards shareholders with a dividend yield of 1.31%.
Though not a high-growth play, Sandur’s consistent cash flows, low debt, and operational leverage in a cyclical sector make it a solid bet for long-term value seekers.
📈 Technical Analysis – Early Reversal from 200 EMA
The stock recently reversed sharply from the 200 EMA and daily demand zone between ₹443.65 and ₹455, suggesting strong support and accumulation interest. The current close of ₹483.50 marks a reclaim of the key moving average and signals potential trend change.
🔧 Key Technical Levels:
Reversal Zone (Support): ₹443.65 – ₹455
Breakout Level: ₹514.15
Resistance 1 (R1): ₹628.25 – Weekly Supply Zone
Resistance 2 (R2): ₹742.35 – Long-term Target
Near-Term Structure: Price may retest ₹514 before trending upward in a higher-high, higher-low sequence.
A move above ₹514.15 will confirm a breakout and may trigger momentum towards the ₹628–₹742 zone.
✅ Summary
Sandur Manganese offers a compelling techno-fundamental setup:
Debt-light and cash-flow rich
Strong reversal from technical support
Breakout above ₹514 could open up ₹628 and ₹742 as next targets
Ideal zone to track for re-entry: ₹455–₹470 range
Traders and long-term investors can watch for momentum confirmation or dips toward support for strategic entry.
Disclaimer: lnkd.in
