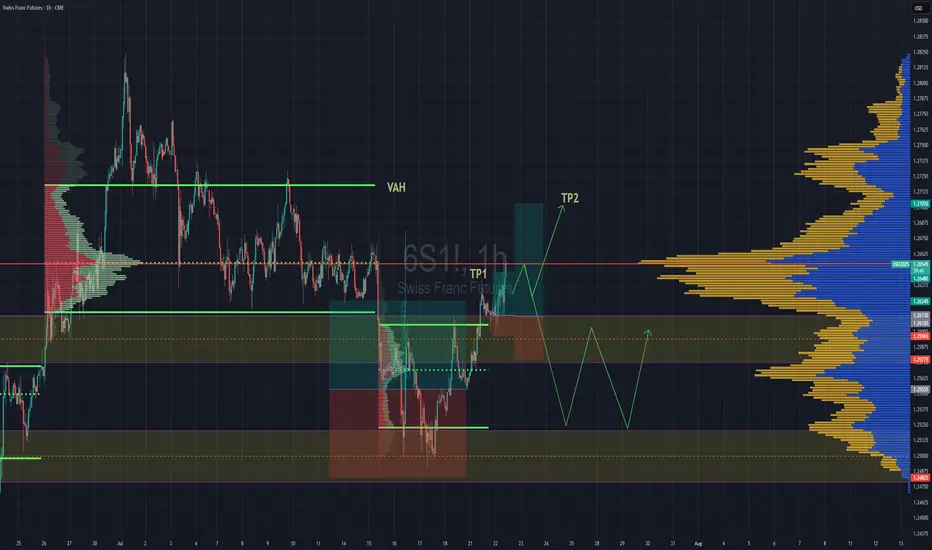
Swiss Gaining Momentum Against The DollarSwiss futures gaining strength against the dollar. We have broken back into previous rotation that was somewhat balanced, but still leaning towards a "b" style volume profile . If we are able to get above the POC, then we''ll go straight for TP2 close to Value are high.
If the POC is really strong and we reject hard from the POC then we might lose the value area and fall back down to previous value area to continue consolidation there until further notice.
Support and Resistance
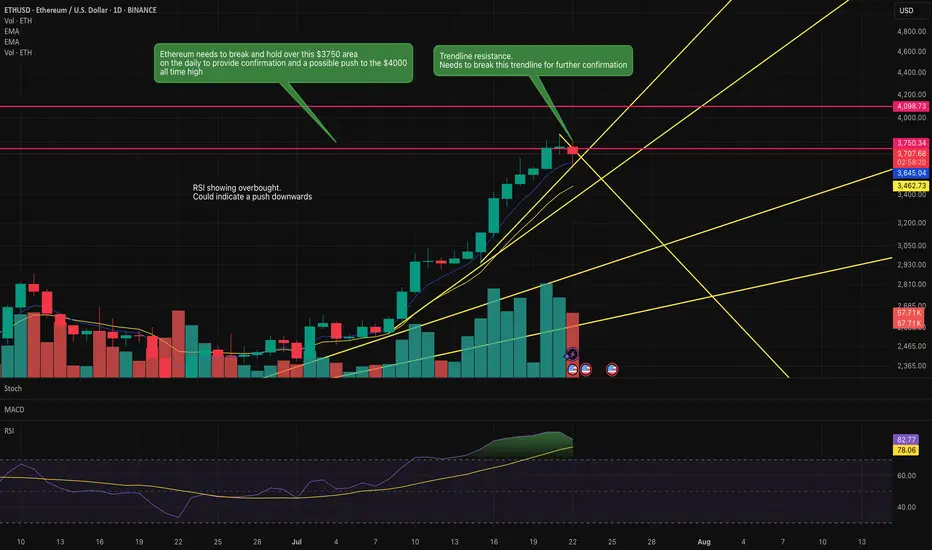
Is Ethereum going to push above this key resistance?Ethereum is knowcking against this key resistance area.
If it pushes above this $3750 area then it has a clear run to the previous all time highs of $4000.
RSI indicates overbought so it could indicate a reversal to the downside.
Key trendline is being honoured currently. However, a break of this trendline may indicate the move upwards to the previous all time high.
Watch this space over the next couple of days.
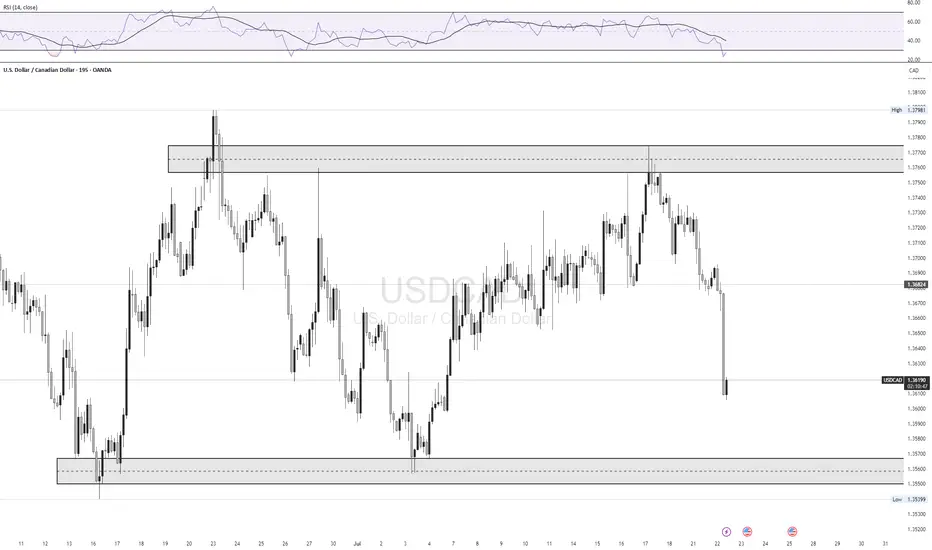
USD/CAD LongLooking for a retest of 1.35600 zone for a bounce back up to 1.37650 supply zone
FX:USDCAD
HolderStat┆ETHUSD approaching $4kOKX:ETHUSDT continues its move after breaking above $2,900. Next resistance sits around $3,500. Uptrend remains intact while above $2,875.

A significant drop in price about to occur in XAUUSD (Gold)!!!Price of gold is about to drop significantly as we just spotted a bearish engulfing candlestick pattern in the H4 timeframe around the $3400 level. Also we can spot a double top pattern in 45M timeframe. All of these signals shows a potential sell opportunity from the current market price.
This is likely to be the first significant sell correction after the bullish impulse the market has made since the major breakout occurred around the $2000 level. A sell opportunity is envisaged from the current market price.

GoHealth | GOCO | Long at $6.05GoHealth NASDAQ:GOCO is a health insurance marketplace and Medicare-focused digital health company that uses a technology platform with machine-learning algorithms to match consumers with Medicare plans (Advantage, Supplement, Part D) and individual health insurance. Understandably, a lot of investors aren't bullish on this stock given all of the healthcare provider and services headwinds. However, if the company can overcome some of their financial issues and bankruptcy risk (debt-to-equity: 1.6x; quick ration of 1.1x, Altman's Z score of .3x), it may dominate the health insurance marketplace (but do not hold my word to that...). This is a purely speculative play at this point - those who are risk averse should absolutely stay away.
What truly caught my eye with this stock is that it is consolidating nicely within my historical simple moving average area. Often, but not always, this leads to a future change in momentum and propels the stock higher. It doesn't signal a bottom and there may be more room for it to plummet, but it is a bullish (overall) sign that shares are likely being accumulated by investors. Given the need for health insurance, particularly Medicare as the US / baby boom population ages, this is a company that may prosper IF it can get its financials in order.
Thus, at $6.05, NASDAQ:GOCO is in a personal buy zone (but very risky). Further declines may be ahead before a stronger move up.
Targets into 2028:
$10.00 (+64.5%)
$12.00 (+97.4%)

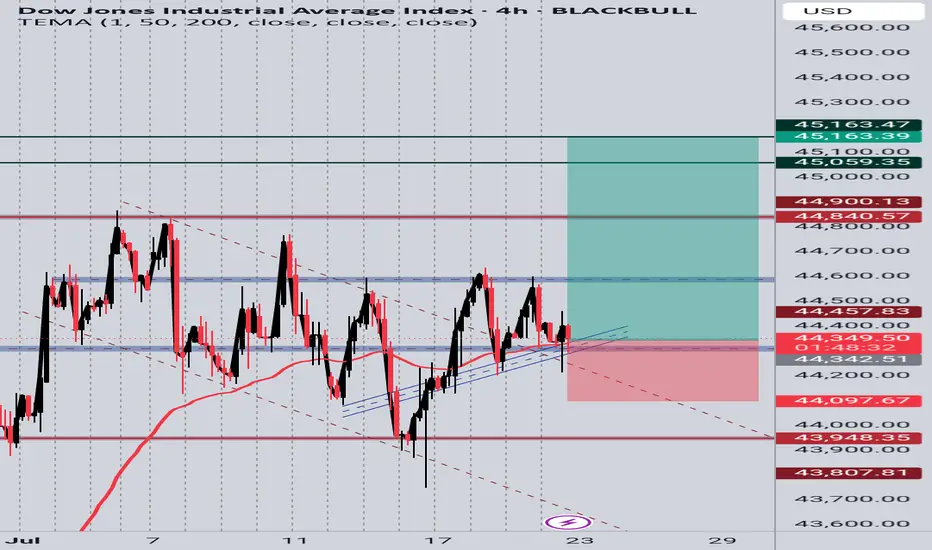
US30 4H Long SetupPrice is respecting a rising trendline and holding above a key support zone. After multiple rejections at the trendline and EMA bounce, current candle shows bullish intent. Targeting previous resistance zones around 45,059 and 45,163. SL placed below the trendline and recent structure low at 44,097. Setup based on structure support, EMA reaction, and potential bullish continuation.
DIA "Dow Jones Ind Ave. ETF"DIA 15-Minute Technical Outlook
The DIA chart reflects a short-term corrective structure within a broader bullish sequence. Recent price action has established new break-of-structure (BOS) highs, followed by a pullback toward a key internal liquidity zone. Your zones (supply and demand borders) are strategically placed and suggest an imminent inflection point.
🔍 Market Structure Overview:
A Bullish Break of Structure (BOS) occurred at 446.91, confirming bullish control in the short term.
Price has since retraced from this high, forming a local lower high near the 0.5 fib level of the last impulse, indicating a healthy pullback phase.
The recent Change of Character (ChoCH) at 442.12 aligns with a potential short-term retracement target and serves as a key validation level.
🟩 Demand Zone Analysis
Level: ~440.60–442.00
This green zone is supported by multiple confluences:
A prior liquidity sweep and bullish impulse, signaling strong buyer interest.
Proximity to the ChoCH, adding structural significance.
A demand imbalance that remains unmitigated, making it a likely reaction zone.
📌 Expectations: A retracement into this zone may provide a low-risk long opportunity targeting a retest of the 446.00–447.50 supply cluster.
🟥 Supply Zone Analysis
Level 1: ~446.00–446.91 (short-term supply near BOS)
Level 2: ~447.60–449.00 (higher-timeframe unmitigated supply)
These zones represent areas of historical selling pressure and potential liquidity traps where price may encounter resistance. The stacking of zones increases the potential for a reaction or short-term rejection.
📌 Expectations: Should price approach these levels post-demand bounce, tight management or scaling out is advised.
📈 Technical Confluence Points:
Fib Retracement (0.5): Price is hovering near the 0.5 level of the recent bullish leg (~444.05), acting as interim support.

The bull market of xauusd continues, buy and wait for the rise.As predicted in the band trading center in advance over the weekend. The daily level trend is still very stable, and the breakthrough trend has been perfectly carried out. The current quotation is 3388. It is only a matter of time before it rises wildly to the position of 3430. The short-term will definitely break through. The current bull market is clear and has huge potential. The limit of the triangle consolidation phase is about to be broken. Then the bulls will continue to rise. Therefore, buying is the key operation plan.
XAUUSD:Retracement is a buying opportunityAfter the Asian market hit the highest position of 3403, there was some decline. The current gold price is 3386. From the short-term trend of the hourly level. It is still fluctuating at a high level. Combined with the trend of the daily level, there are signs of retracement and counterattack. There is no news dominance. It is purely a technical repair after hitting the high. This retracement can pay attention to the support near 3382-3378. The London and New York markets are still based on buying and profit.

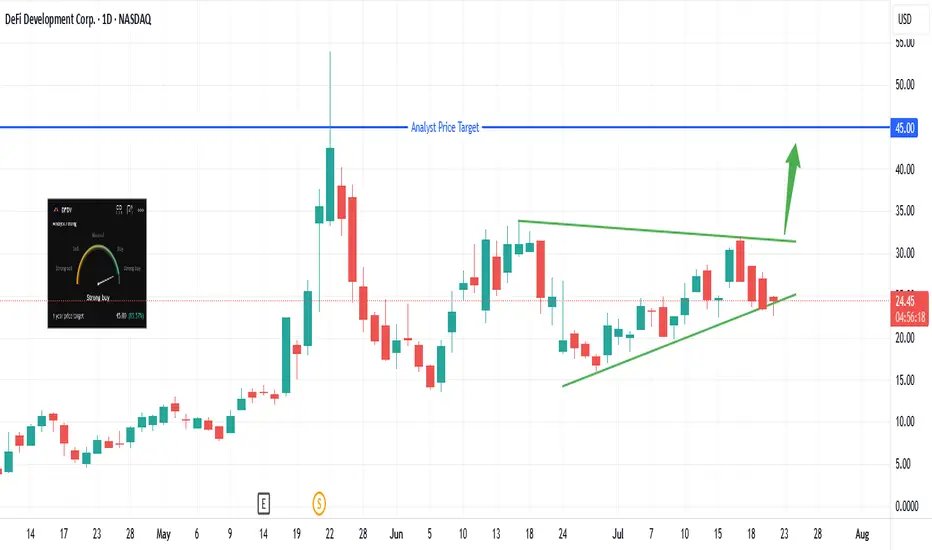
DFDV: Watch This Level for the Next Big Move!Trade Summary
Setup: Ascending triangle holding support; eyeing breakout above recent highs
Entry: Trigger on daily close above $25
Stop‑loss: Below $22.50 (today’s low)
Targets: $30–31 first; $45 (analyst price target) if momentum continues
Risk/Reward: ~2.0 to first target, >4.0 to analyst target
Technical Rationale
Strong horizontal support: $22–23 zone tested and held
Ascending triangle: Higher lows converging on flat resistance, classic bullish pattern
Daily timeframe: Clear structure, with volume picking up on green days
Catalysts & Context
Analyst target at $45, well above current price
Momentum meter: Strong buy reading showing on dashboard
Sector buzz: DeFi stocks showing relative strength; macro risk appetite returning
Trade Management Plan
Entry: On daily close above $25
Stop‑loss: Below $22.50; trail to breakeven if price hits $30
Scaling: Take partial profit at $31, leave runner for $45 if breakout accelerates
What’s your view? Are you watching DFDV? Comment below or vote:
🔼 Bullish
🔽 Bearish
🔄 Waiting for confirmation
*** Follow us now so to make sure you don't miss the next big setup ***
Disclaimer: Not financial advice. Trade at your own risk.
It’s the right time to go long on gold!Yesterday, gold maintained an overall volatile upward rhythm. Although we maintained a bullish mindset, there was no ideal low-long entry position overall. Currently, gold is above 3380 and below 3410, and the small range remains between 3380-3403. Focus on the top and bottom conversion support position of 3380-3370 during the day. As time goes by, the 4-hour middle track will probably form a resonant support with the Fibonacci 0.5 position, which is an ideal long entry point. Focus on the pressure near 3410-3420. If the upward attack fails to break through this range, you can short sell with a light position.
Gold operation suggestion: go long when it falls back to around 3383-3370, and target the 3400-3410 area.

More Pain for Gold? The Charts Say It’s PossibleSince the start of the London market, gold has almost maintained a narrow range of fluctuations in the 3390-3385 area. Compared with yesterday, the market is much weaker today, and gold has failed to stabilize at 3400 several times, indicating that the sentiment of cashing out near this area is also very high. From the current gold structure, gold is obviously biased towards a long structure. Since gold broke through 3400, 3375-3365 has become the key support area after the top and bottom conversion in the short term.
However, gold rose strongly yesterday but did not stabilize at 3400. The bullish sentiment may no longer be strong. Moreover, after the accelerated rise in gold, the sustainability was not strong, so gold still needs to retreat in the short term. This is why I insisted on shorting gold again near 3400 yesterday. Therefore, I think gold has not yet retreated to the right level. I will pay attention to the opportunity to go long on gold after it pulls back to the 3375-3365 area.
Gold fell after touching 3400 twice. Whether a short-term effective "M" double top structure has been formed, I think more signals are needed to verify. However, in the short term, it is still under pressure in the 3405-3410 range, so if there is no major positive news, I think gold may maintain a wide range of fluctuations in the 3410-3360 range. Therefore, if gold rises to the 3400-3410 range again, I will continue to try to short gold!
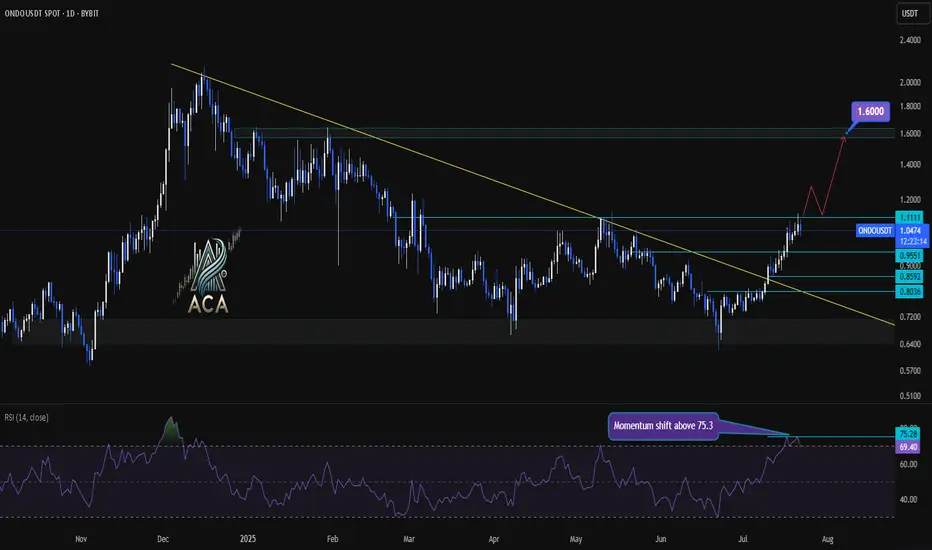
ONDOUSDT Daily Chart Analysis | Momentum Shift & Breakout LevelsONDOUSDT Daily Chart Analysis | Momentum Shift & Breakout Levels
🔍 Let’s dive into the ONDO/USDT daily chart and break down the latest momentum signals, key breakout areas, and targets for bulls.
⏳ Daily Chart Overview
The daily trend shows significant recovery after prolonged downward pressure, with price action now testing critical resistance levels. A key descending trend line has recently been challenged, highlighting a potential shift in market structure.
🔺 Bullish Setup
- Momentum Trigger: The RSI has closed above 75.3, signaling a strong momentum shift and upping the odds for continued upside.
- Breakout Confirmation: Watch for a daily candle close above the $1.1111 resistance level. This would confirm a bullish breakout and could serve as a solid trigger for further upside.
- Trend Line Dynamics: The price has decisively broken above the major descending trend line, which had capped rallies for months—removing a significant area of supply and emboldening bulls.
- Upside Target: Once confirmed, this setup opens the door for an advance towards the $1.60 area, where the next major resistance sits.
📊 Key Highlights
- Daily RSI closing above 75.3 reflects strong market momentum and buyer dominance.
- A daily candle close above $1.1111 can be used as a bullish trigger.
- The long-term descending trend line has been broken, indicating a major momentum shift.
- Immediate upside target stands at $1.60, representing a clear resistance level for profits or further evaluation.
🚨 Conclusion
Momentum is clearly shifting in favor of the bulls as technical barriers fall by the wayside. For traders looking to position long, confirmation above $1.1111 combined with the powerful RSI reading sets the stage for a move towards $1.60—keep these levels on your radar as the setup plays out!

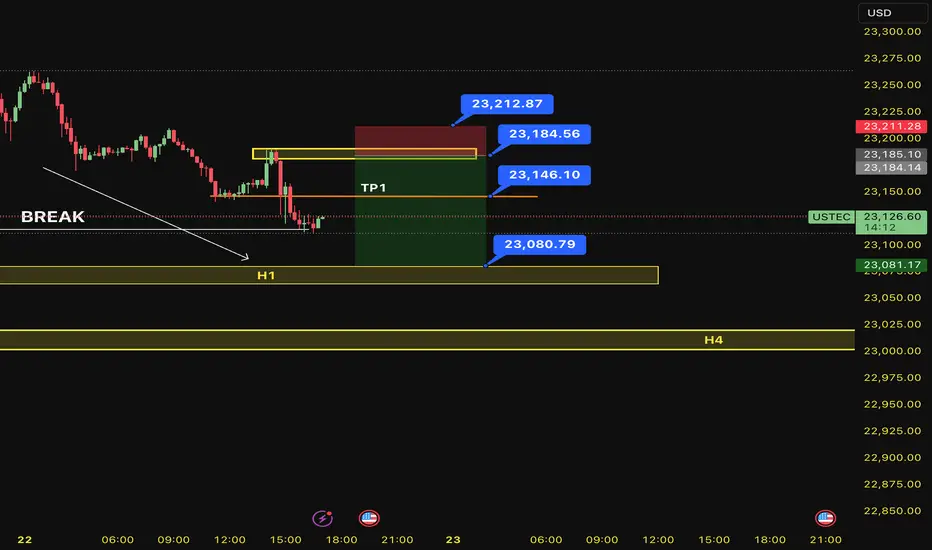
SELL USTEC 22.7.2025Confluence trade order: SELL at M15
Type of entry: Limit order
Condition:
- If the price break down THE LAST TOP confirming the down trend into H1.
Note:
- Management of money carefully at the price of bottom (23,146)
Set up entry:
- Entry sell at 23,184
- SL at 23,212
- TP1: 23,146
- TP2: 23,080
Trading Method: Price action (No indicator, only trend and candles)
Denta Water & Infra Solutions Ltd <>Returns Chart shared on July 16th has already yielded a 20%+ return. Analysis suggests the stock should consolidate at its current high level after the recent steep rise, followed by a potential breakout.

XAUUSD 30M – OB Sell Limit Setup for 3R Opportunity by PhoenixFXGold 30M Chart – Smart Money Sell Limit
We’re watching a clean Order Block (OB) on the 30-minute timeframe as price retraces into a key supply zone. This setup offers a high-probability reversal opportunity with a 3R risk-to-reward ratio. ✅
📍 ENTRY: 3413
🛑 SL: 3418 (above structure)
🎯 TP1: 3408 (1R)
🎯 TP2: 3403 (2R)
🎯 TP3: 3398 (3R)
The price action shows signs of exhaustion and premium pricing as it returns into a previous OB. We’re positioning with precision and tight risk.
📌 Strategy:
– 30M OB zone
– Clear BOS + retracement
– Set & forget execution
#XAUUSD #Gold #OrderBlock #SupplyZone #SmartMoney #PhoenixFX #RiskReward
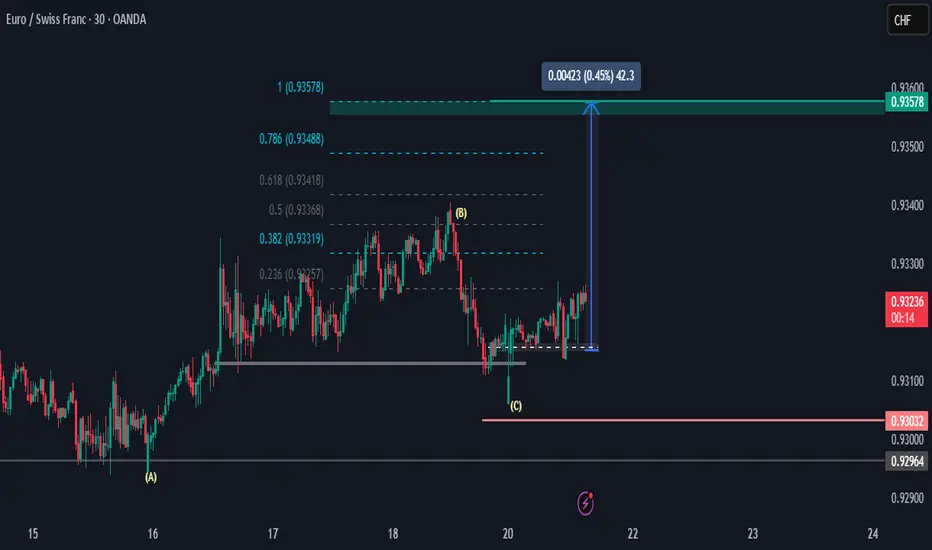
EURCHF Price Is looking UpHi there,
The EURCHF looks bearish at the M30, with the first resistance target potentially being 0.93319. I anticipate for the price to reach above area (B) into the 0.93419 price area for a potential push up to the 0.93488 area, and if momentum is strong in the higher time frames, then the bias is set for 0.93578.
Happy Trading,
K.
Not trading advice.
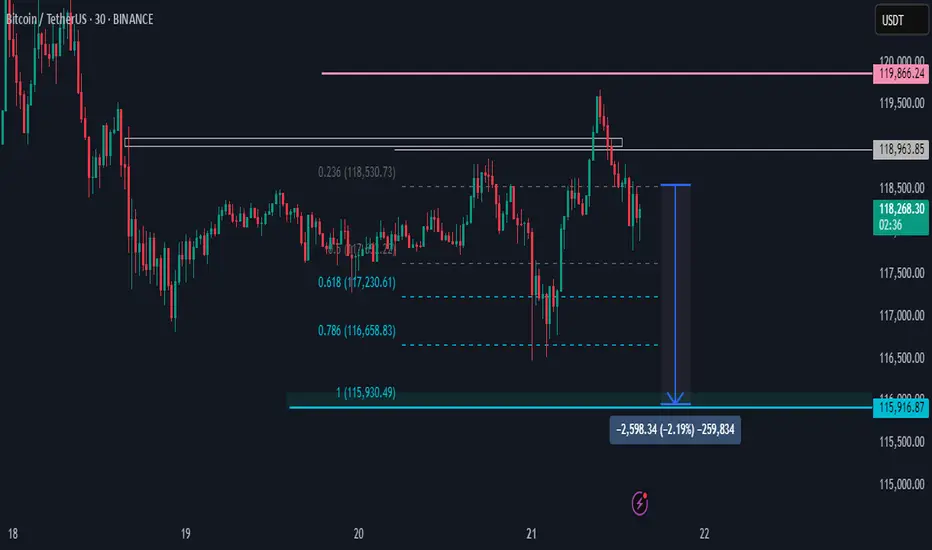
BTCUSDT Aiming LowsHi there,
BTCUSDT looks bearish at the M30 with one price target of 116 658.83 for a bias of 115 930.49.
The bearish price appears to be sustained by the H4 time frame.
Happy trading,
K.
Not trading advice
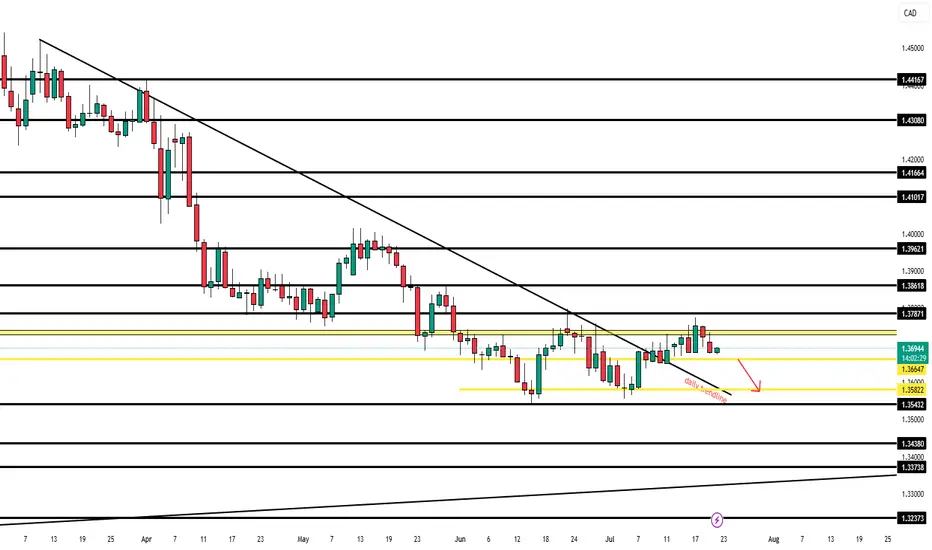
🇨🇦 USDCAD — July 22nd OutlookCurrent Price Behaviour:
USDCAD remains rangebound, sitting just above our key support level of 1.36647. The pair has failed to show any clean breakouts since Monday and remains stuck inside a tight intraday channel.
What We're Watching:
📍 Break of 1.36647 = trigger for continuation of bearish move
🎯 Target: 1.35822 (80 pip move)
⚠️ No active trade until this breaks — structure still unclear
HTF Bias: Bearish
Current Play: Stay out until 1.36647 breaks cleanly with strong momentum and volume. That level unlocks a smoother sell opportunity into our first target.
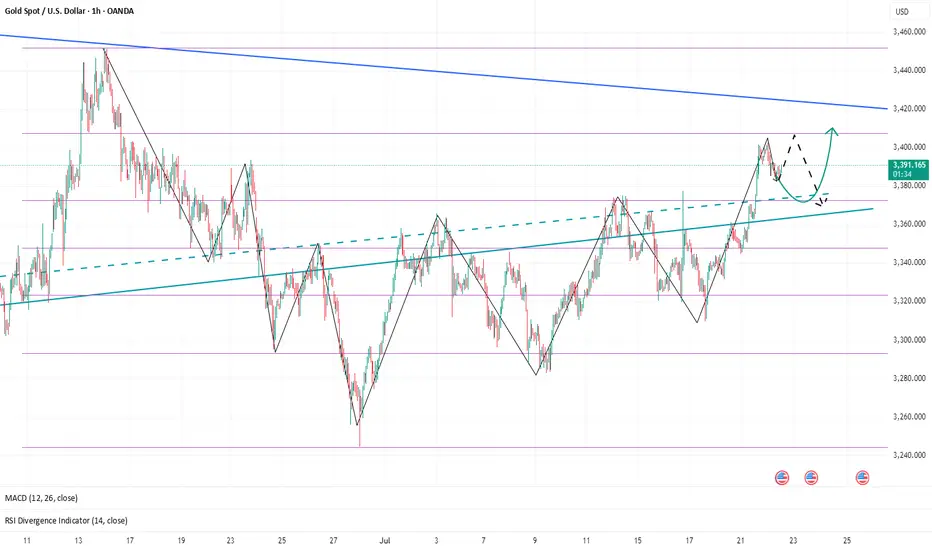
Gold Rejection & Retest Zones AnalysisGold has recently broken out of the 1H ascending trendline with a strong bullish push 🚀. After this breakout, we are now watching key supply and demand zones for the next move.
🔴 Bearish OB (3398-3404):
Price is currently hovering around the bearish order block, which could trigger some short-term rejection or pullback from this zone.
🟢 Bullish OB Zones (3350 & 3330):
If gold decides to correct lower, we have two important bullish OBs below, perfectly lining up with the previous trendline retest ✅. These zones can offer high-probability buy setups if price respects them.
🎯 Focus is on watching for possible rejections from the top OB, or waiting for a deeper retracement towards the bullish zones for buy confirmations
