Have you caught up with this golden opportunity?The 4-hour K-line pattern of gold shows that the upward trend remains intact, focusing on the strong support range of 3360-3365 (technical resonance with the 5-week moving average). Before the price effectively breaks below the support band, the bulls still have upward momentum, otherwise the trend may reverse. The 3365-3400 range is maintained for intraday fluctuations. The gold operation strategy recommends arranging long orders in the 3370-3375 area when the price falls back, and adding positions to long positions if the support of 3360-3365 is broken.
Operation strategy: Gold recommends going long near 3370-3375 now, and adding positions to long positions in the support area of 3360-3365 when the price breaks, with the target of 3380-3390.
If you still lack direction in gold trading, you might as well try to follow my pace. The strategy is open and transparent, and the execution logic is clear and definite, which may bring new breakthroughs to your trading. The real value does not rely on verbal promises, but is verified by the market and time.
Support and Resistance

USDCAD for short*The content on this analysis is subject to change at any time without notice, and is provided for the sole purpose of assisting traders to make independent investment decisions.

USD/CHF SHORT USD/CHF SHORT " break of a support area and retest it + 61.8% fib retracement + 50 ema dynamic resistance + down trendline "

Bearish till 1.35158.Price has created a bearish Type 1 dealing range on the 1 hour chart within a type 2 dealing range. This warrants bearish price action till 1.35158. My entry is at 1.35892 which lines up with both the equilibrium price level of the range as well as the consequent encroachment of the balanced price range. Furthermore, note the market maker sell model formation on the 1H chart. This poses a high probability sell set-up.

Short till 1.34557Price has entered the sellside curve of the market maker sell model. This has warranted bearish momentum down to 1.34557.

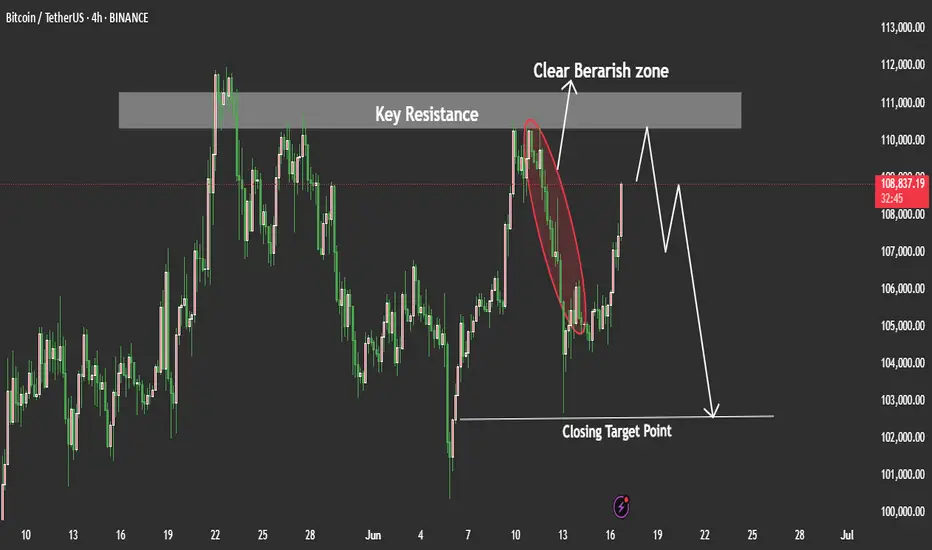
ZONE SNIPER SETUP (BEARISH)BTC/USD Supply Zone Reaction Expected...!
Current price action is retracing toward a well defined supply zone between 107,016 and 108,576, an area of previous institutional selling. The expectation is a potential rejection from this zone, leading to a continuation of the broader downtrend.
If price taps into this supply and fails to break above, short opportunities become favorable targeting:
Intermediate support at 104,000.
Final target at 101,565, aligning with prior liquidity sweep.
Invalidation occurs on a strong close above 108,576.
#BTC/USD, #FOREX, @VeloraFXReal

BTCUSDT Update — Big Macro Forces In Play!!Hey Traders!
If you’re finding value in this analysis, smash that 👍 and hit Follow for high-accuracy trade setups that actually deliver!
Bitcoin once again testing key support levels as global tensions continue to fuel uncertainty in the markets.
Chart Overview:
BTC broke down from short-term resistance and is now retesting the major support zone between $102K–$103K. The structure still remains within a broader consolidation range, but this support zone is absolutely critical for bulls to defend.
Immediate Resistance: $106K → $110K
Immediate Support: $102K → $100K
A breakdown below $100K could trigger deeper liquidations towards $95K–$98K, while a successful defense here could push BTC back toward previous highs.
Geopolitical Impact:
Global headlines are heavily influencing risk assets right now:
🇮🇱 Israel-Iran tensions are escalating.
🇺🇸 The US is signaling stronger involvement diplomatically, adding more fear to markets.
📉 Traditional markets have already started to show signs of caution.
Bitcoin, as a risk asset, remains vulnerable to these global macro shocks in the short term.
The Game Plan Right Now:
If we see sustained support at $102K–$103K, there’s still room for a relief bounce towards $106K–$110K in the near term.
However, if global tensions escalate further, expect increased volatility with downside liquidity grabs.
Stay cautious with tight risk management. Macro headlines are still driving sudden sentiment shifts.
📊 My Bias:
Watching for potential sweep of $102K with possible reversal structure forming. Any clear reclaim of $105K may signal a local bottom.
📝 Key Takeaway:
Global narratives are bigger than technicals right now. The next few days could dictate whether BTC holds or faces another sharp liquidation event.
Stay patient. Stay disciplined. And most importantly: manage your risk.
👉 Follow for more real-time updates as we track both price action and macro headlines impacting crypto.

BTCUSDT Price may Test as Short TermBTC/USDT Price Analysis (Interpretation):
BTC/USDT recently tapped into a well-defined rejection zone on the 4H and Daily timeframes. This zone has previously acted as strong resistance.
Given this, we could expect a potential move to the downside unless the price breaks above that rejection zone with strong momentum. However, before the downside move fully plays out, there is a chance the price may retest the 102,500 level again — possibly as a liquidity grab or a false breakout — before resuming a bearish push. My Goal is 102,500 lets we see how how the price will plays out.
if you like tis idea and if you find good thing in this analysis share in comments we need support from you Guys.
Gold Miners Break KEY multi-year resistanceIn the face of uncertainty, money flees to safe haven assets like Gold, Silver and the Dollar. When Gold moves up, gold miners do as well. As you can see from the weekly chart, the miners broke key resistance going all the way back to August 2020. These decade long highs at $46 were broken and there is a secondary trend line I have drawn that also intersects in the same area. The next probable move is for the miners to come down into the top of these trendlines and test the area as support before rocking to new all-time highs. Theres no guarantee that it will come down into this area, but if it does, you can bet your bottom dollar it'll be the buying opportunity of a lifetime.

Netsol - Inverse H&S into playNetsol is in its buyback phase which is about to be over in June.
Inverse H&S is in play where it hit its daily pivot level. If it now makes a higher high and higher low, 2nd shoulder will be confirmed. Alternatively, it may hit 123 (bottom of its first shoulder) before going upward. Upside short term target will be 183.

MLCF - Cooling down after a long rallyMaple Leaf is cooling down after a long rally and is preparing for touching its all time high.
It struck Fib 0.618 level and is now spending some time here as expected. It may retrace to its Fib 0.5 level (73 to 74) before again going up.
Once it crosses and gives monthly closing above 88, we can see it hitting 108 and then 133 in quick succession.

Fine SpikeToday's spike led us back into the trading range that had prevailed since September. It may be a sign of a bottom at the end of December.

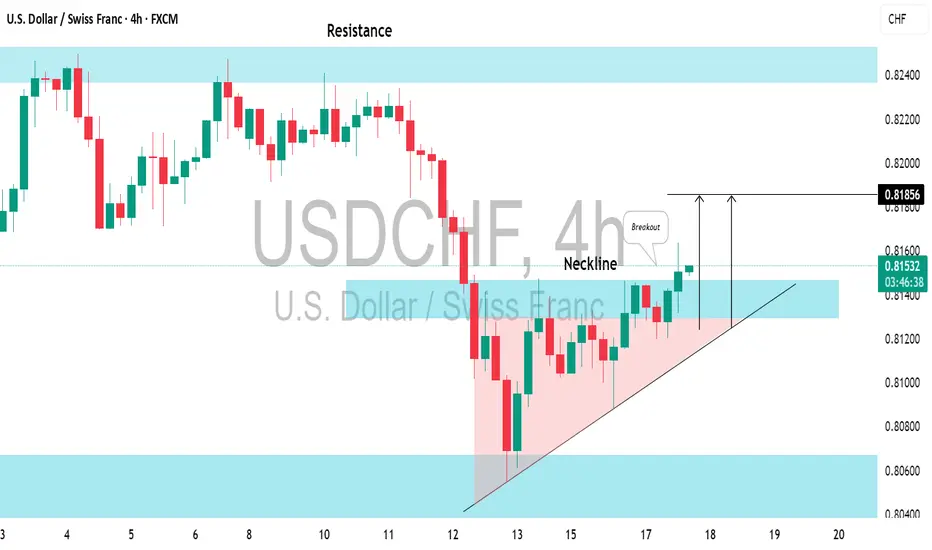
USDCHF: Bullish Move From Key LevelI see a solid bullish signal on 📈USDCHF following a test of significant support.
The price formed an ascending triangle pattern on the 4-hour chart and has broken above its neckline.
I anticipate that the price will soon reach the 0.8193 level.
DXY Long term targetI think the IV wave is finished. now in 1-2 year dxy next target will be around 120. probably in 1 year.

NZDUSD SHORTMarket structure bearish on HTFs DW
Entry at both Weekly and Daily AOi
Weekly Rejection At AOi
Daily Rejection at AOi
Previous Structure point Daily
Around Psychological Level 0.59500
H4 EMA retest
H4 Candlestick rejection
Rejection from Previous structure
Levels 4.48
Entry 100%
REMEMBER : Trading is a Game Of Probability
: Manage Your Risk
: Be Patient
: Every Moment Is Unique
: Rinse, Wash, Repeat!
: Christ is King.

BTCUSDT ShortSet-up: Fade breakouts inside 2‑day 1 % VWAP band
Entry: $107 k‑$107.5 k
Stop: 0.5% -> 108k
Target: Re‑enter VWAP mean $105.5 k
R:R: 3:1

$META - Consolidation Cluster Bullish Flagging Ahead of The FedPrice held above key levels after breakout and is now flagging near highs.
700+ zone holding as new support
Strong structure with rising 9EMA catch
Volume cooling, but MACD remains bullish
Eyeing potential expansion above $708–710 range
This setup favors continuation. Watching for a clean break and close above $708 to confirm next leg higher.

Gold maintains bullish trend
💡Message Strategy
Gold rebounded in shock before the US market, and the market rose. Previously, gold recorded the largest single-day drop in a month (1.4%) on Monday. After the sudden situation in the Middle East and US President Trump's warning to Tehran, the market's risk aversion demand heated up again, pushing gold prices to rebound in the Asian session.
The two-day interest rate meeting of the Federal Reserve has also become the top priority of the market. Tensions in the Middle East have heated up again. According to Reuters, Israel's air strikes on Iran's state-run TV station, Iran's threats to launch the most violent missile attack in history, and the fire of three oil tankers near the Strait of Hormuz have caused market concerns about the escalation of geopolitical conflicts. US President Trump left the G7 summit early and convened a national security meeting, which increased market risk aversion.
At the same time, ETF holdings have increased significantly. Data shows that ETFs increased their gold holdings by 136,000 ounces on the previous trading day, and the net purchase volume has reached 6 million ounces this year, reflecting that funds still have strong confidence in the future of gold. SPDR Gold ETF recorded a single-day net inflow of US$285 million last Friday, the largest scale in weeks.
In the US macroeconomics, the market generally expects the Federal Reserve to keep interest rates unchanged this week, but the focus is on Powell's speech and changes in the dot plot. As expectations of further interest rate cuts in 2025 heat up, the US dollar is still under pressure near a three-year low, and analysts believe that this will form structural support for gold in the medium term.
📊Technical aspects
The gold daily candlestick chart shows that the current trend is in a typical "rising wedge" pattern. Prices have been rising steadily along an upward trend line this year, while the upper side is suppressed by strong resistance in the 3420-3430 area. The current market is in a wait-and-see state.
The current gold market sentiment is in a "highly sensitive" stage. On the one hand, risk aversion once pushed gold to rebound rapidly, reflecting the market's extremely high pricing sensitivity to geopolitical risks; on the other hand, traders are still uncertain about the outlook for the Fed's policy, and the expectation that interest rates will remain unchanged has been fully priced in, but there are large differences in the future path of interest rate cuts.
If the results of the FOMC meeting are hawkish or Powell sends a signal that there will be no interest rate cut, and the market's risk aversion sentiment eases, gold may fall back to the key support area of 3350-3360 US dollars. Traders are closely watching the changes in the Federal Reserve's monetary policy and geopolitical situation, and at the same time be alert to the risks of "false breakthroughs" and sharp pullbacks.
💰 Strategy Package
Trend: Upward trend
Support: Around 3360.00
Resistance: Around 3420.50
Long Position:3365-75
Stop loss at 3350, take profit around 3400-3420, and trailing stop loss of 300 points.

Falling below 3380,testing 3365,the low position remains bullish📰 Impact of news:
1. Geopolitical tensions in the Middle East
2. Iran nuclear talks
3. Retail sales data
📈 Market analysis:
After rebounding to the 3400 line, gold encountered resistance and fell back to test the support level of 3380. Although it was very close to the point of 3405 we gave, I did not enter the trade because gold has been in the middle section in the short term and has not rebounded to the ideal point.
There are too many long orders at high levels in gold. The international situation is so tense that gold is still slowly declining, but the geopolitical situation is still continuing. In addition, the retail sales data is bullish. Then, as the trading strategy given at noon, it is expected to test the short-term support of 3365-3355 below. I will consider going long in this range
🏅 Trading strategies:
BUY 3365-3355
TP 3380-3390-3400
If you agree with this view, or have a better idea, please leave a message in the comment area. I look forward to hearing different voices.
TVC:GOLD FXOPEN:XAUUSD FOREXCOM:XAUUSD FX:XAUUSD OANDA:XAUUSD

Tron (TRX) Price Prediction: Nasdaq Deal Fuels Bullish ForecastThe $210 Million Nasdaq Rumor: Deconstructing the Hype for a Realistic Tron (TRX) Price Prediction
In the volatile theater of cryptocurrency, headlines can ignite market-moving frenzies, and few have been as potent as the recent whirlwind of news surrounding Tron (TRX). The prospect of a planned Nasdaq listing via a $210 million reverse merger, intertwined with the enigmatic presence of the Trump family, sent shockwaves through the community, promising a new era of mainstream legitimacy and sparking wildly bullish price predictions. However, as the dust settles, a clearer, more nuanced picture emerges—one that separates explosive rumors from the fundamental drivers that will truly dictate the future of Tron's price.
The core of the excitement stemmed from a strategic deal involving SRM Entertainment, a Nasdaq-listed company specializing in theme park merchandise. In a stunning pivot, SRM announced it would rebrand as Tron Inc., initiate a substantial TRX treasury funded by a $100 million private equity investment, and appoint Tron's founder, Justin Sun, as an adviser. This "reverse merger" was widely interpreted as a backdoor for the Tron blockchain to gain a coveted spot on a major U.S. stock exchange, a move that would grant it unprecedented access to traditional capital and validation. Adding a layer of political intrigue, the deal was facilitated by an investment bank where Eric Trump and Donald Trump Jr. serve on the advisory board.
This confluence of high finance, crypto ambition, and political association created a perfect storm for speculation. The stock price of SRM Entertainment skyrocketed over 500%, and the price of TRX saw a notable jump. However, the narrative quickly became more complex. Eric Trump clarified his position, denying any direct "public involvement" in the new company, despite expressing his admiration for Justin Sun and their established business connections.
While the deal with SRM Entertainment is very real, its direct implications for the TRX token are more complex than a simple "Nasdaq listing." The transaction is for the corporate entity, which will hold TRX in its treasury, not for the decentralized TRX asset itself to be traded on Nasdaq like a stock. This distinction is critical. The move provides Tron with a publicly-traded vehicle and significant capital, but the ultimate value of TRX still hinges on the utility and adoption of the Tron network itself. Therefore, a realistic price prediction must look beyond the initial hype and analyze the bedrock of Tron's fundamentals.
Deconstructing the Hype: The Nasdaq Deal and Trump Connection
The plan for SRM Entertainment, a Florida-based supplier of toys and souvenirs, to morph into Tron Inc. is a masterclass in financial engineering. Through a reverse merger, a private company (in spirit, Tron) can go public by merging with an existing publicly-traded company (SRM), bypassing the rigorous and lengthy process of a traditional Initial Public Offering (IPO).
The deal, valued at up to $210 million upon full exercise of warrants, involves SRM receiving a $100 million equity investment from a private investor to initiate a "TRX Treasury Strategy." This strategy mirrors the approach of companies like MicroStrategy with Bitcoin, where the public company's assets are heavily invested in a specific cryptocurrency, making its stock a proxy for that asset. With Justin Sun serving as an adviser, the new Tron Inc. plans to implement a TRX staking program and even a dividend policy for its shareholders, further intertwining its fate with the Tron ecosystem.
The involvement of the investment bank brokering the deal brought the Trump name into the headlines. Eric Trump and Donald Trump Jr.'s roles on the bank's advisory board led to speculation about their involvement in the new Tron Inc. However, Eric Trump later clarified his position, separating his personal and business relationships from a formal executive role in the public venture, though the connection undeniably added to the initial media frenzy.
Beyond the Rumors: Tron's True Fundamental Strengths
With the Nasdaq hype contextualized, the real question for investors is: what is the intrinsic value of the Tron network? The answer lies in its undeniable dominance in one of the most crucial sectors of the digital economy: stablecoins.
The Undisputed King of USDT
The Tron network has become the world's primary settlement layer for Tether (USDT), the largest stablecoin by market capitalization. The network hosts over $78 billion in USDT, a figure that has surpassed the amount on its main rival, Ethereum. This dominance is not accidental. Tron's architecture, which allows for high throughput and extremely low transaction fees, makes it the preferred network for USDT transfers, especially for retail users and in emerging markets.
During a single month in mid-2025, the Tron network processed over $694 billion in USDT transfers through nearly 90 million contract interactions. The vast majority of USDT holders on Tron are retail users with balances under $1,000, highlighting the network's deep penetration into everyday peer-to-peer and remittance use cases. This immense and consistent utility generates real, sustained demand for the network, forming the most solid pillar of its valuation.
A Growing DeFi and dApp Ecosystem
While stablecoins are its main draw, Tron's Decentralized Finance (DeFi) ecosystem is also substantial. The network holds a Total Value Locked (TVL) of over $8 billion, placing it among the top layer-1 blockchains. Platforms like the lending protocol JustLend and the decentralized exchange SunSwap are key contributors to this activity.
The network has processed over 10.5 billion transactions from more than 313 million user accounts, demonstrating a vibrant and active user base. Although a recent decline in TVL from its peak and slowing DEX volume has been observed, the sheer number of daily active users and transactions suggests a pivot towards non-DeFi dApps and peer-to-peer transfers, reinforcing its utility beyond pure financial speculation.
Tron (TRX) Price Prediction: Technical Analysis and Future Outlook
Given the strong fundamentals, particularly its role as the leading stablecoin platform, what can be expected from the TRX price?
Technical Indicators
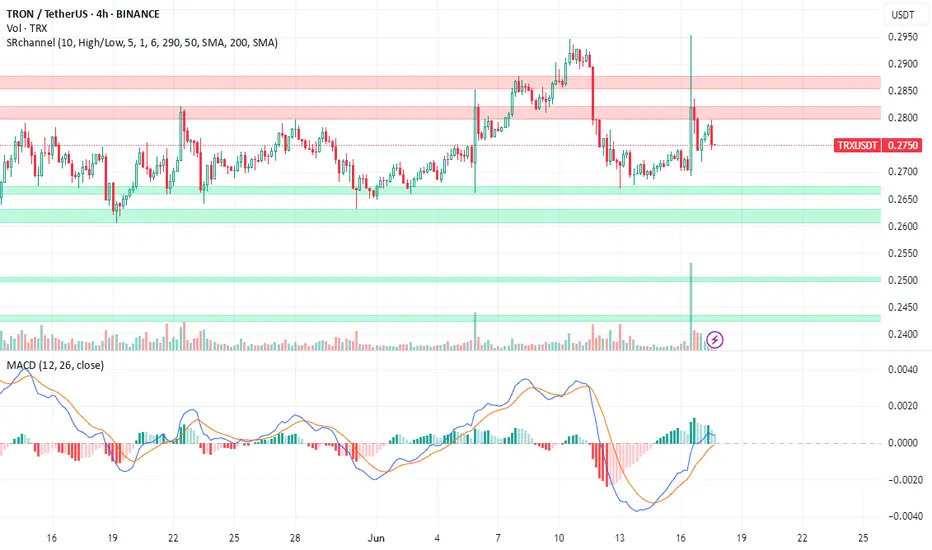
As of mid-2025, TRX has shown resilience. Technical analysis reveals a generally neutral to bullish sentiment. The price has been consolidating in a horizontal channel, with key resistance and support levels being closely watched. Bullish signals, such as a "golden cross" and a bullish MACD crossover, suggest potential for upward momentum. A key indicator of its potential is its market-cap-to-TVL ratio, which, at 0.26, suggests the coin may be significantly undervalued compared to the value of the assets secured on its network.
Price Forecasts for 2025 and Beyond
Price forecasts for the end of 2025 vary but are generally optimistic, contingent on broader market conditions.
• Conservative Outlook: A conservative forecast places the potential price of TRX in a range between $0.18 and $0.35 for 2025. A move toward the upper end of this range would depend on a sustained crypto bull market and continued growth in Tron's user base.
• Bullish Scenario: An optimistic forecast suggests that if a full-blown "altseason" takes hold, TRX could surpass its previous highs and target levels between $0.45 and $0.70. Some long-term models even project a path toward $1.00 or higher by 2030, assuming Tron maintains its competitive edge and expands its use cases.
• Bearish Scenario: Risks remain. A regulatory crackdown on stablecoins, particularly Tether, could disproportionately impact Tron. Furthermore, a recent $2 billion drop in its DeFi TVL, despite user growth, suggests a potential weakness in its financial ecosystem that warrants monitoring. In a bearish turn, TRX could fall back to support levels around $0.21 or lower.
The "100x Gem" Fallacy
The headlines promoting Tron's Nasdaq deal were often accompanied by mentions of speculative new tokens like "BTC Bull Token," promising astronomical 100x returns. It is crucial for investors to recognize this as a common marketing tactic that leeches onto legitimate news to promote highly speculative and often worthless assets. The future success of Tron will not be found in chasing such gambles, but in the sustained growth of its core network. The real "alpha" is in understanding the fundamental utility that drives billions of dollars in transactions daily, not in lottery-ticket tokens.
Conclusion: A Bullish Continuation Built on Reality, Not Rumor
The story of Tron's Nasdaq listing is a potent reminder of the crypto market's susceptibility to hype. While the reverse merger with SRM Entertainment is a significant strategic maneuver that provides Justin Sun's ecosystem with a public-facing entity and a war chest, it is not the magic bullet that guarantees a higher TRX price.
The true bullish case for Tron is more mundane but far more powerful. It is the network's unparalleled dominance as the world's preferred highway for stablecoin transactions. This utility provides a constant, powerful demand for the network's resources. As long as Tron remains the fastest, cheapest, and most accessible platform for billions of dollars in daily USDT transfers, its intrinsic value will continue to grow.
The Nasdaq deal is a catalyst, but the engine is the ecosystem. Investors looking for a bullish continuation should focus on the steady hum of that engine—the growth in active wallets, transaction counts, and stablecoin volume—rather than the fleeting roar of market rumors. Based on these fundamentals, a steady, upward trajectory for TRX seems not only possible but probable, with the potential to retest and surpass previous highs as the digital asset market matures.
Why I Think GBPUSD Will Sell...Technical AnalysisHey Rich Friends,
I hope you're well today. I wanted to share why I think GBPUSD will sell today and maybe more this week. This is only my technical analysis so make sure you check the news and cross reference the indicators you have on your chart. This is what I am looking at:
- The market hit a swing high on 4H and has been creating lower highs.
- The momentum is picking up for the sellers based on candle bodies.
- The stochastic is facing down, the slow line (orange) is on top of the fast line (blue) and both lines have crossed below 50. These are bearish confirmations for me.
Additional information:
- Wait for the stochastic to cross below 20.
- Wait for a break of structure below 1.35320.
- I will be setting sell stops so that my trades trigger on the way down. I will set previous highs as my SL and previous lows as my TPs.
Good luck if you decide to take this trade!
Peace and Profits,
Cha

#GBPJPY: 600+ Pips Swing Move, JPY To Drop! GBPJPY has successfully rejected the area previously identified in our analysis of GJ. We had anticipated a price rejection and reversal with a strong bullish impulse, which has materialised. Following the positive candle close on Friday, we anticipate a continuation of the bullish trend and potential reaching of the 200 mark.
When trading, it is crucial to prioritise risk management. Conduct your own analysis and utilise this information solely for educational purposes.
Three potential targets have been identified: 198, 200, and 202. A stop loss can be positioned below our buying zone, as indicated by the black-marked zone.
Your support, expressed through likes, comments, and shares, is greatly appreciated and encourages us to continue providing valuable content.
❤️🚀
Team Setupsfx_

SILVER (XAGUSD): One More Buying Opportunity📈SILVER is currently experiencing a strong bullish trend on the daily chart.
Since the end of last week, it has been consolidating within a horizontal range on a 4-hour time frame.
Today's bullish movement has successfully broken above the resistance of this range, confirming buyer strength and suggesting a likely continuation of the upward trend.
The next target is 38.00.
