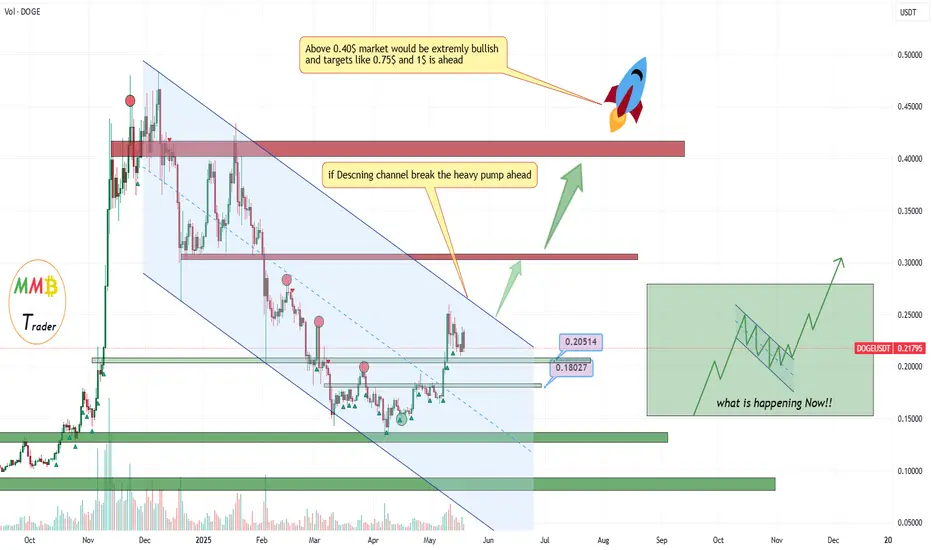
DOGEUSDT in Descending channel soon breakout and Pump As we know the descending channel in bull market appear and let the price rest for a while but this one dump the price as we can see and soon it will break to the upside and then more gain and even new high here is expected because market gain the power needed in this channel.
DISCLAIMER: ((trade based on your own decision))
<<press like👍 if you enjoy💚
Support and Resistance
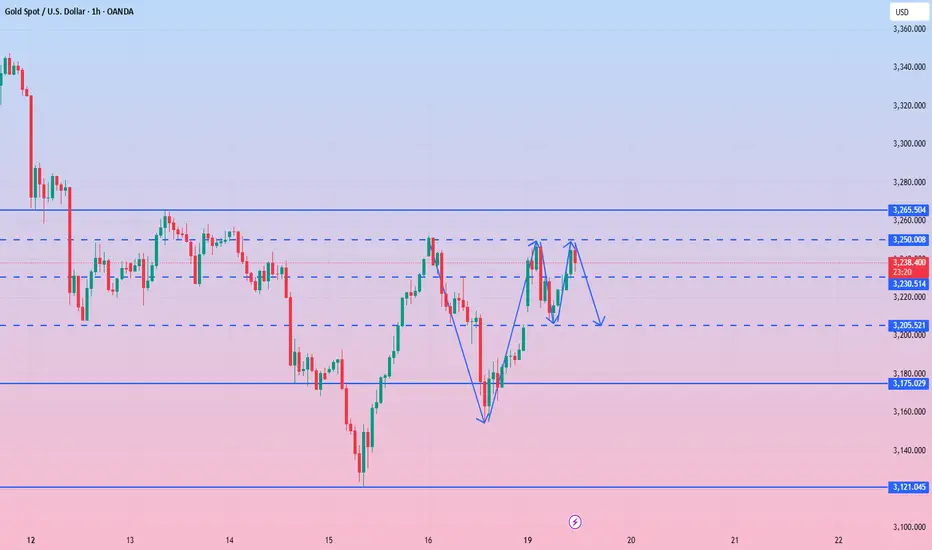
How to layout in the battle between long and short positionsGold surged directly at the opening, which is in line with our analysis expectations. We gave a short position near 3240-45. As expected, gold fell to the 3230 line for profit. There is great pressure from above and limited space above. Up to now, it has been fluctuating near 3220. For gold, we are now focusing on the short-term support of 3200-06. If it breaks through this position, it is very likely to go to the 3175-90 line.
From the current trend analysis, today's support continues to focus on 3170-80, strong support 3150, and upper pressure 3253-60. Relying on this range as a whole, the main tone of high-altitude low-multiple cycle participation remains unchanged. In the middle position, you must watch more and move less, be cautious in chasing orders, and wait patiently for key points to enter the market. I will notify you of the specific operation strategy in time and pay attention to it in time.
Gold operation strategy: short gold rebound near 3240-50, target 3230-3220. Pay attention to the support of 3202 and 3175 below, and go long according to the strength of the decline!

NATGAS - NEW BREAKDOWN !Hello Traders !
The Naturalgas price failed to create a new higher high!
The higher low is broken (change of character).
So, I expect a bearish move📉
_____________
TARGET: 3.0950🎯

BITCOIN (BTCUSD): Will We Test ATH Soon?After a strong bullish rally, ⚠️Bitcoin has paused its upward movement and started to consolidate.
Currently, I observe a typical bullish accumulation pattern - a horizontal trading range on the 4-hour chart.
At this moment, it is testing its resistance. I firmly believe that a bullish breakout, indicated by a 4-hour candle closing above 106,000, will lead to further upward momentum.
This could propel the price to 108,000, and potentially even challenge the all-time high.

Weekly FOREX Forecast: USD, EUR, GBP, AUD, NZD, CAD, CHF, JPYThis is the FOREX Currency futures outlook for the week of May 18 - 24th.
In this video, we will analyze the following FX Majors markets:
USD Index
EUR
GBP
AUD
NZD
CAD
CHF
JPY
USD Index has been bullish for 4 weeks. Will it continue? Expect a pullback before bullish continuation.
Selling the commodity currencies (AUD, CAD, NZD) may be the best course of action this week. Buying the EUR, GBP and CHF may also be worthwhile.
Enjoy!
May profits be upon you.
Leave any questions or comments in the comment section.
I appreciate any feedback from my viewers!
Like and/or subscribe if you want more accurate analysis.
Thank you so much!
Disclaimer:
I do not provide personal investment advice and I am not a qualified licensed investment advisor.
All information found here, including any ideas, opinions, views, predictions, forecasts, commentaries, suggestions, expressed or implied herein, are for informational, entertainment or educational purposes only and should not be construed as personal investment advice. While the information provided is believed to be accurate, it may include errors or inaccuracies.
I will not and cannot be held liable for any actions you take as a result of anything you read here.
Conduct your own due diligence, or consult a licensed financial advisor or broker before making any and all investment decisions. Any investments, trades, speculations, or decisions made on the basis of any information found on this channel, expressed or implied herein, are committed at your own risk, financial or otherwise.


SHIBUSDT after more range here heavy pump is aheadWe may have more range here below the red trendline resistance zone and this range is best time for buy in my opinion soon the red trendline resistance will break and above there market would be extremely bullish and heavy pump is expected like green arrows on chart.
DISCLAIMER: ((trade based on your own decision))
<<press like👍 if you enjoy💚

It’s the right time to shortUS President Trump recently criticized Fed Chairman Powell again, calling him "slow to act" and emphasizing that the Fed should cut interest rates as soon as possible to support the economy. Trump believes that delaying interest rate cuts may lead to the risk of recession in the US economy, but the Fed still takes inflation and employment data as the core of decision-making, and the two sides have obvious differences in policy positions.
At present, the Fed's interest rate cut expectations have been postponed and the magnitude has been reduced. Coupled with the expectation of rising US bond yields, the gold market sentiment has weakened. The world's largest gold ETF recently reduced its holdings by 8.98 tons to 918.73 tons, reflecting the cooling of institutions' short-term bullish enthusiasm for gold. Technically, gold prices continued to weaken after breaking through key support last week, and the weekly closing was negative, suggesting that shorts were dominant; the daily level was constrained by the 20-day moving average, and the volatile downward trend may continue in the short term. Focus on the 3250-3265 line resistance during the day. If it cannot break through, the $3,200 mark below may face a test.
Gold recommendation: short sell when it rebounds to 3245-3252 range. Target 3230-3220.
$BTC up to $107-108k?While I do think CRYPTOCAP:BTC will ultimately still see a larger correction, I can't deny that the chart looks bullish here.
I think we're likely to see a final move over the next week or two up to $107k-108k to retest the prior highs. I think the middle resistance at $108,183 is the most likely target for the move.
After we hit that, that's where I'll start to position short on BTC.
Let's see how it plays out over the next week or two.

GOLD consolidated below a key level on FridayGold is in a downtrend forming a counter-trend correction. Friday's trading session closes below the key level of 3203-3205. Buyers are weaker than sellers.
But, before the continuation of the fall MM is quite likely to test the resistance to provoke ordinary buyers before the fall
Scenario: the growth attempt may turn out to be false. A retest of 3203 resistance, a false breakout and price consolidation below 3203 is a sell signal.
Additional scenario: MM trap to provoke buyers to buy. A retest of the far resistance 3230, a false breakout and a price fixing below 3223 could start a decline

I am not gonna long XRPXRP is in the Distribution phase, I will not take any long position here.
I would rather wait until it reaches the trendline.

DeGRAM | GOLD triangle volume reduction📊 Technical Analysis
● A lower-high formed at $3 280 re-entered the red supply and slid back beneath the blue trend-line, converting last week’s “break-out” into a bull-trap.
● Price is compressing in a bear-flag whose base rests on $3 200; a 1 h close below it exposes the descending-channel floor/ horizontal support at $3 100.
💡 Fundamental Analysis
● FOMC minutes stressed rates may stay “restrictive for some time”, lifting 2-yr yields to 4.9 % and firming the USD, while the World Gold Council logged a 6-tonne ETF outflow on 17 May, signalling weaker investment demand.
✨ Summary
Sell rallies into 3 230-3 250; flag break targets 3 200 ➜ 3 100, risk capped above 3 280.
-------------------
Share your opinion in the comments and support the idea with a like. Thanks for your support!

Nifty Analysis EOD – May 19, 2025 – Monday🟢 Nifty Analysis EOD – May 19, 2025 – Monday 🔴
Silence Before the Storm? A “Double Distribution” Kind of Day
📈 Nifty Summary
Another quiet yet deceptive start to the week as Nifty opened flat-to-negative (-14 points) but quickly formed a 92-point wide 5-minute candle at the open. That set the tone for the entire day—a tight, trapped market trading within this early range until post-2 PM.
Things got interesting later, as Nifty breached its IB Low, Previous Day Low (PDL), and closed decisively below key support zones, finally taking support near 24,920 (day’s low: 24,916.65).
The structure fits the classic textbook term—a “Double Distribution Day”, where the index transitions into a new value area in the second half. Option writers erased premiums on both sides, frustrating breakout traders and intraday scalpers alike.
25Min Time Frame Chart:
Daily Time Frame Chart:
🕯 Daily Candle Breakdown
Candle Type: Bearish with late-session breakdown
Day Type: 📘 Double Distribution Day
Key Breakdown Levels: IB Low, CDL, PDL
Support Held: 24,920 zone
🕵️♂️ Observation of the Day
Is this just a pause… or the calm before a storm?
Though there's no strong reversal signal yet, subtle clues emerge:
🔎 On the 25-minute chart, the 13:25 candle was the first to close below the 24,980–25,000 support zone.
📉 Post-PDL breakdown, the retracement attempt was shallow, and price remained under S1 and PDL levels, which hints at weak buying interest.
📊 Bias Going Forward
No reversal yet. Trend watchers should stay patient.
But given price action and weak retracements, the bias tilts toward a deeper retracement, possibly toward the 24,800 zone in the next session. Until strong bullish follow-through is seen, expect continued corrective movement.
5 Min Time Frame Chart:
🛡 Gladiator Strategy Update
Strategy Parameters
ATR: 330.48
IB Range: 92.9 → 🟠 Small IB
Market Structure: ⚖️ Balanced
Trade Highlights
⏰ 1st Short Trigger: 14:00
❌ Trade Timed Out → Loss Booked
📊 Total Trades: 1
📍 Support & Resistance Levels
🟩 Resistance Zones:
24,980 ~ 25,000
25,062 ~ 25,070
25,116 ~ 25,128
25,180 ~ 25,212
25,285
25,399
25,485 ~ 25,511
🟥 Support Zones:
24,920
24,882
24,800 ~ 24,768
24,660
24,590
24,530 ~ 24,480
🔮 What’s Next?
No storm yet, but the structure is weakening quietly. Until the bulls reclaim 25,000 decisively, the short-term path of least resistance appears lower.
A move below 24,882 could accelerate downside momentum. All eyes on 24,800 next.
🧠 Final Thoughts
Markets aren’t always noisy when they turn. Watch the subtle signs. For now, retracement bias stays—but don’t front-run reversals.
“Strong trends may pause quietly. It’s the silence that often precedes the sharpest moves.”
✏️ Disclaimer
This is just my personal viewpoint. Always consult your financial advisor before taking any action.

Looking at a handle here :-)We’re looking at the cup’s handle here. My guess is that we’re going a bit more down from this status in the upcoming 24h and then go up again. If it does not go further down the 160 then we will probably break through the 180 resistance and hit 200. Let me know your thoughts about it! :-)

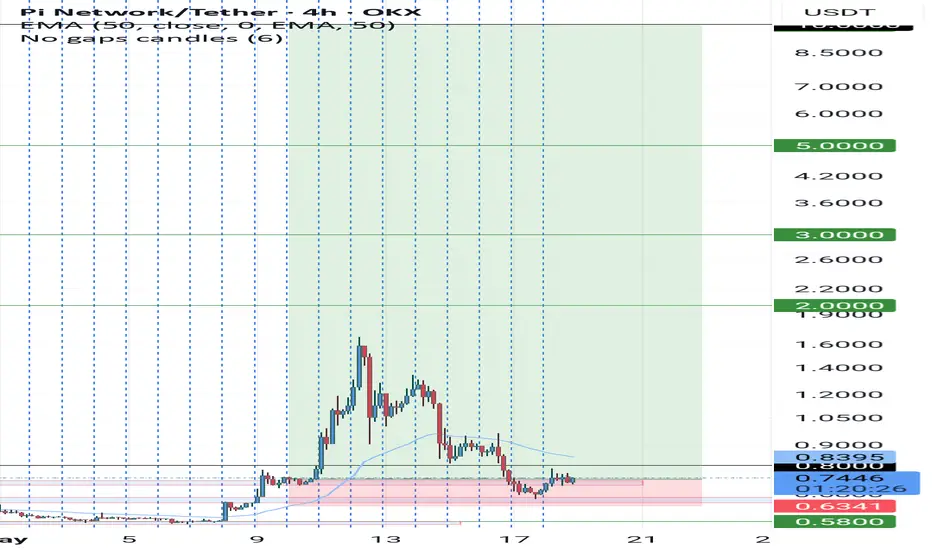
Pi usdtAm expecting pi as so far respected the move I was expecting so am expecting a puch to 10$ as we can see the 1w 1d 4h is on a uptrend so we expect mo bullish movement from tomorrow or de about
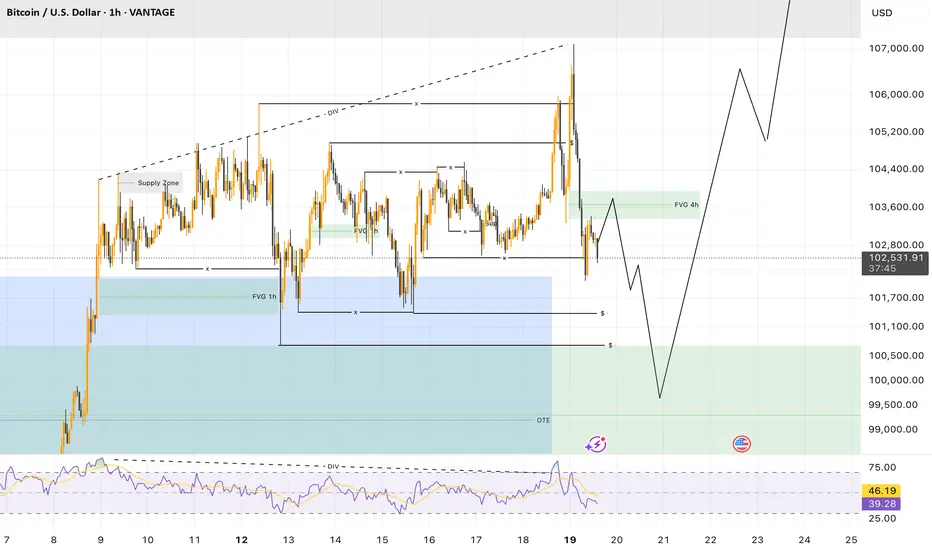
Bitcoin (BTC/USD) – 1H Analysis🧱 1. Market Structure : Accumulation Pattern Still in Play
Bitcoin is still evolving within a clean accumulation structure at the highs. Despite a seemingly flat consolidation, recent price behavior clearly signals manipulation, typical of a reaccumulation phase.
➡️ On Sunday, the market triggered a bullish fakeout : price briefly swept the range highs before getting immediately rejected, a clear sign of liquidity grab followed by institutional repositioning.
🎭 2. Manipulation & Hidden Intent
This type of reaction (instant north sweep + rejection) suggests that the market :
Is not yet ready to break out for good,
Prefers to trap breakout traders,
And aims to remain in a smart compression phase.
Moreover, the accumulation continues above the Bear OTE zone, indicating ongoing buyer pressure, though still discreet.
📉 3. Retracement Hypothesis: Return to 100K $?
A likely scenario includes :
A retrace to the 50% mark of the Bear OTE (around $96,300–$100,000), which also holds a weekly FVG,
A quick liquidity sweep to the downside,
Followed by a final north-side swing that could unlock a new ATH.
This would form a classic structure :
Accumulation → Manipulation → Explosive Expansion
✅ Conclusion
📌 The current range remains constructive, even if lengthy.
BTC continues to build within a high-stakes setup. The market shows clear signs of prepping for a major breakout, but may still :
Trap the impatient (bullish fakeout),
Flush out southern stops (deep retest toward 100K),
Then unleash a powerful breakout to the upside.
🔥 As long as $100,000 holds, the setup remains strongly bullish mid-term.
🎯 Target: Reclaim the ATH, then extend towards $115K–$120K.
ETHEREUM New Update (1D)Ethereum has reclaimed the flip zone, but it hasn't tested this area or made a proper pullback yet.
It's expected that this zone will be tested before the price moves toward higher targets.
If we see a strong reaction around the green zone, we can look for potential buy/long positions.
A daily candle closing below the invalidation level would invalidate this analysis.
For risk management, please don't forget stop loss and capital management
When we reach the first target, save some profit and then change the stop to entry
Comment if you have any questions
Thank You

BTC Dominance – Critical Breakdown ConfirmedBitcoin Dominance has officially broken below the long-standing rising wedge structure, signaling a significant shift in market momentum. This pattern, which had held strong since December 2024, has now failed — and that’s a big deal.
After the breakdown, BTC.D temporarily bounced but was rejected on the retest of the wedge’s lower boundary, confirming the breakdown as valid. This retest-then-drop scenario is a textbook bearish continuation signal.
Not only did BTC.D lose the rising trendline, but it also failed to hold the horizontal support zone near 63%–62%, which acted as a key floor for months. Now, with price heading lower, Bitcoin's dominance is clearly weakening, and that’s bullish for altcoins.
What this means:
Bitcoin is losing control of market share.
Altcoins may start gaining serious traction, especially mid and low caps.
If BTC.D drops below 60%, we could see an acceleration of capital rotation into altcoins — a classic start to an altseason.

Bitcoin Hourly Analysis (2H)Given Bitcoin's rapid movement near previous highs, along with quick pump-and-dump action and liquidity grabs, it's expected that the liquidity pool below the price will be swept, collecting orders from the green zone, and then price may reverse back to the upside.
A 4-Hour candle closing below the invalidation level will invalidate this analysis.
For risk management, please don't forget stop loss and capital management
Comment if you have any questions
Thank You

THOUGHTS ON EUR/USDEUR/USD 4H - As you can see price has broken structure to the upside, giving us the confluence to suggest enough Demand has been introduced to see price now trade us higher longer term.
The reason this here is a valid break in structure is because the high that set the lowest low within this correction has now been broken, suggesting that we are no longer following the laws of bearishness but now following the laws of bullishness.
In order for us to be able to get involved in this market now with the longer term bias to take it long, we want to see price pullback initially to set a higher low, once price does that, that is when we can look to take part in the market.
I have gone ahead and marked out an area of interest I feel price will fall back down and into before trading us higher, we want to see price trade down and into this, then break structure fractally before taking us higher in the market.

SHORT ON EUR/USDEUR/USD is in a overall uptrend.
I'm just looking to catch the pullback as we continue to make downtrend market structure on the pullback itself.
Looking to catch 200-400 pips to the downside.

What is Opening Range Breakout (ORB)Hello mates today i want to share an Educational post about Opening range breakout a very common and old strategy used by many traders and it's still pretty effective. I hope you will read the complete post and like my publication too friends.
So let's understand about Opening Range Breakout below-::
⚡Introduction to Opening Range Breakout-::
In the world of trading timing can be everything. One of the strategies that traders use to capitalize on market movements at the start of the trading day is the Opening Range Breakout (ORB). This technique is particularly popular among day traders because it leverages the market's early volatility to make quick profits. In this article we'll dive deep into what ORB is, how it works, and how traders can effectively use it.
⚡What is the Opening Range-::
The "opening range" refers to the price range established during the first few minutes of a trading session. This range is defined by the high and low prices observed within this period. Depending on the trader's preference and the asset being traded, this range can be set over different time intervals, commonly 5, 15, or 30 minutes.
⚡Understanding the Breakout-::
A breakout occurs when the price moves outside the opening range, either above the high or below the low. This movement indicates a potential direction for the day's trend. The idea behind the ORB strategy is that the price, once it breaks out of this range, is likely to continue moving in that direction, giving traders a chance to enter a position early in the day and ride the trend.
⚡Why Use ORB-::
1.Early Market Volatility-: The market often shows significant volatility at the opening bell, driven by overnight news, earnings reports, and economic data. This creates opportunities for sharp price movements.
2.Defined Risk and Reward-: Since the opening range is defined, traders can set clear entry, stop-loss, and take-profit levels, making risk management straightforward.
3.Capturing Early Trends-: ORB allows traders to capture trends early, often before the broader market catches on. This can lead to significant profits in a short period.
⚡How to Implement the ORB Strategy-::
1-Identify the Opening Range-: At the start of the trading session, observe the price action and note the high and low points within your chosen time frame (e.g., the first 15 minutes).
2-Set Breakout Levels-: Once the opening range is established, these levels (the high and low) become your breakout levels.
3-Place Orders-::
Long Position-: If the price breaks above the high of the opening range, enter a long position (buy).
Short Position-: If the price breaks below the low of the opening range, enter a short position (sell).
4-Set Stop-Loss-: A common approach is to place a stop-loss just inside the opening range. For example, if you enter a long position, your stop-loss might be slightly below the high of the range.
5-Set Profit Targets-: Profit targets can be set based on a fixed ratio (e.g., 2:1 risk/reward ratio), or by trailing the stop-loss as the price moves in your favor.
⚡Factors to Consider for ORB Success-::
1-Market Conditions-: ORB tends to work best in markets with high liquidity and volatility. Stocks with news catalysts, or major indices, are often good candidates.
2-Time Frame Selection-: The choice of the opening range time frame is critical. Shorter time frames (e.g., 5 minutes) might offer more frequent signals, but they can also lead to more false breakouts. Longer time frames (e.g., 30 minutes) may provide more reliable signals but fewer opportunities.
3-Volume Confirmation-: It's often wise to confirm breakouts with an increase in volume, which can indicate the strength of the move.
4-Avoiding False Breakouts-: Not every breakout leads to a sustained move. To avoid false breakouts, some traders wait for a retest of the breakout level or use additional technical indicators, such as moving averages or momentum oscillators, to confirm the trend.
⚡Example of ORB in Action-::
Let’s consider a stock that has an opening range of 100 to 105 in the first 15 minutes of trading. Here’s how a trader might approach this:
Breakout Above 105-: The trader places a buy order at 105.10 (a little above the breakout level) and sets a stop-loss at 104.50 (just below the high of the opening range). The profit target might be set at 107.20, assuming a 2:1 reward-to-risk ratio.
Breakout Below 100-: Alternatively, if the stock breaks below 100, the trader could short the stock at 99.90 with a stop-loss at 100.50 and a profit target at 97.80.
⚡Advantages of ORB-::
Clarity-: The strategy provides clear entry and exit points, reducing guesswork.
Structure-: It imposes discipline by setting predefined rules for trading.
Simplicity-: ORB is relatively simple to understand and execute, making it accessible to traders of all experience levels.
⚡Challenges and Limitations-::
False Breakouts-: These can lead to losses if not managed carefully.
Whipsaws-: In highly volatile markets, prices might break the range multiple times, leading to potential whipsaws.
Over-Reliance on Opening Range-: Solely relying on the opening range might ignore broader market context or trends from previous days.
⚡Conclusion-::
The Opening Range Breakout strategy is a powerful tool in a trader's arsenal, particularly for those who thrive on early market action. While it offers a structured approach to capturing trends, success with ORB requires discipline, proper risk management, and an understanding of market conditions. By combining ORB with other strategies or indicators, traders can increase their chances of capturing profitable moves while minimizing risks.
Whether you’re a seasoned trader or just starting, mastering the ORB strategy can provide you with the edge needed to navigate the fast-paced world of day trading.
Thanks for reading the post, I hope you will like the information shared above and like my idea too.
Best Regards- Amit

Buy gold, it is expected to hit 3280-3290Fundamentals:
1. Focus on the speeches of Fed officials;
2. Pay attention to Trump's calls with Putin, Zelensky and others;
Technical aspects:
Gold continued its rebound momentum today, but failed to break through the short-term resistance area of 3250-3260 many times. However, after multiple tests, it will become easier to break through this area.
According to the current structure, gold rebounded from around 3120, and then built a secondary low point structure around 3154. Today, during the Asian session, it built a structural retracement area around 3206 again. As the low point is continuously raised, an obvious bullish structure is formed in the short term. For short-term trading, we can start to try to go long on gold based on the structural form; if gold successfully breaks through the 3250-3260 area, gold will continue to the 3280-3290 area, or even the area around 3320.
Trading strategy:
Consider going long on gold after gold retreats to the 3225-3215 area, TP: 3250-3260

USD/CHF continue with the UptrendOn USD/CHF , it's nice to see a strong buying reaction at the price of 0.83160.
There's a significant accumulation of contracts in this area, indicating strong buyer interest. I believe that buyers who entered at this level will defend their long positions. If the price returns to this area, strong buyers will likely push the market up again.
(FVG) - Fair Value GAP and high volume cluster are the main reasons for my decision to go long on this trade.
Happy trading
Dale
