OKLO eyes on $72.37: Golden Genesis fib that should give a DIP OKLO going nuclear into a Golden Genesis fib at $72.37
Looking for a Dip-to-Fib or a Break-n-Retest new longs.
Most likely a few orbits around this ultra-high gravity fib.
.
Last Plot caught break and sister Genesis Fib
.
Older Plot caught the perfect Dip-to-Fib buys:
.
Hit the BOOST and FOLLOW to catch more such EXACT trades.
=======================================================
Support and Resistance

Solid V Shaped recovery within the Parallel channel for NiftyNifty recovered sharply within the parallel channel. The reasons that can be attributed are inherent strength in the Indian market and swift recovery in IT, Infra, Metal, commodities, Realty, Mid and Small cap browsers. The closing of Nifty was at 24946 which is just above the mother line which is at 24908. The same mother line provided the support to Nifty in the last few hours of trade when there was some intraday profit booking pressure.
Nifty Supports remain at: 24908 (Mother line Support), 24836, 24690 (Father Line Support), 24555 (Channel Bottom Support) and 24480 recent low. Below 24880 Nifty will be very weak and Bears in that scenario can drag Nifty further down to 24195 or 23957. These are the levels as of now. If we go below these levels in unlikely circumstances we will update the levels once we get there.
Nifty Resistances remain at: 24973, 25106 (Mid Channel Resistance) and 25231.Once we close above 25231 we will update further levels.
Disclaimer: The above information is provided for educational purpose, analysis and paper trading only. Please don't treat this as a buy or sell recommendation for the stock or index. The Techno-Funda analysis is based on data that is more than 3 months old. Supports and Resistances are determined by historic past peaks and Valley in the chart. Many other indicators and patterns like EMA, RSI, MACD, Volumes, Fibonacci, parallel channel etc. use historic data which is 3 months or older cyclical points. There is no guarantee they will work in future as markets are highly volatile and swings in prices are also due to macro and micro factors based on actions taken by the company as well as region and global events. Equity investment is subject to risks. I or my clients or family members might have positions in the stocks that we mention in our educational posts. We will not be responsible for any Profit or loss that may occur due to any financial decision taken based on any data provided in this message. Do consult your investment advisor before taking any financial decisions. Stop losses should be an important part of any investment in equity.

At some point,......this thing has to go down, and technically, it still looks like this could be it. It's the monthly, so it could still go sideways for a while, but it looks like a completed channel before the breakdown.

NZDUSD - BULLISH MOVE !Hello Traders !
On Monday 9 June, The NZDUSD broke the resistance level (0.60380 - 0.60072).
This key level becomes new support !
So, I expect a bullish move🚀
_________________
TARGET: 0.61050🎯

Nifty Analysis EOD – June 16, 2025 – Monday🟢 Nifty Analysis EOD – June 16, 2025 – Monday 🔴
📈 Expected Follow-Through Plays Out – Bulls Eye 25K Hurdle Next
Nifty opened flat-to-positive at 24,737, briefly dipped to the day’s low of 24,703.60, and then reversed smartly to touch an intraday high of 24,967.10 by 13:40. After that, the index spent the rest of the day consolidating in a narrow 40-point band and closed at 24,940.95 intraday (adjusted close: 24,946.50), delivering a solid +227.90 point gain.
As anticipated, the 24,768–24,800 support zone provided the launchpad for further upside, confirming the bullish follow-up from Friday's recovery. The rally tested 24,967, just shy of the crucial resistance at 24,972, which remains a key watch for the next session.
🔍 However, going forward, the bulls face major challenges around 25,000–25,080. This zone has acted as a hurdle in the past and could either stall the rally or serve as a breakout trigger. Watch price behavior carefully around these levels to assess conviction.
🛡 5 Min Chart with Levels
🕯 Daily Time Frame Chart
🕯 Daily Candle Breakdown
Open: 24,732.35
High: 24,967.10
Low: 24,703.60
Close: 24,946.50
Change: +227.90 (+0.92%)
📊 Candle Structure Breakdown
Real Body: 214.15 pts → 🟢 Strong Green Candle
Upper Wick: 20.60 pts
Lower Wick: 28.75 pts
🔍 Interpretation
Opened near day’s low, closed near day’s high — classic bullish sentiment.
Small wicks show controlled buying with minimal resistance and shakeouts.
Reinforces the bulls’ momentum after Friday’s OL recovery candle.
🔦 Candle Type
💚 Bullish Marubozu–type / Bullish Continuation Candle– Often found during the middle leg of a bullish swing, signaling strong trend momentum.
📌 Key Insight
Today's price action confirmed continuation of the recovery.
Close above 24,950–25,000 in the next session could ignite fresh upside.
Rejection around 25,060–25,080 would indicate caution — stay nimble.
🛡 5 Min Intraday Chart
⚔️ Gladiator Strategy Update
ATR: 268.49
IB Range: 114.05 → Medium IB
Market Structure: ⚖️ Unbalanced
Trades:
✅ 10:20 AM – Long Triggered → Target Achieved, Trailing SL Hit (RR: 1:3.28)
📌 Support & Resistance Zones
Resistance Levels
24,972 ~ 25,000
25,060 ~ 25,080
25,102 ~ 25,125
Support Levels
24,894 ~ 24,882
24,825 ~ 24,847
24,725 ~ 24,735
24,660
💭 Final Thoughts
The market played exactly as mapped — now it’s about decision time near 25K. Will the bulls charge ahead or pause? Either way, the structure favors short-term bullishness — but profit booking pressure near resistance must be expected.
🧠 “Momentum is a gift – but without volume and conviction, it fades at resistance.”
✏️ Disclaimer
This is just my personal viewpoint. Always consult your financial advisor before taking any action.

Buy on dips and seize rising opportunities📰 Impact of news:
1. Geopolitical risks
2. Expected Fed policy
📈 Market analysis:
The market opened higher in the morning and then continued to fall. From a medium-term perspective, the market is still in a medium-term bullish position. The price will only be under further pressure if it breaks below the weekly support. Observing from the daily level, the price broke through the daily resistance again last Wednesday and continued to soar after the breakthrough. The current price is testing the monthly high, and the subsequent gains and losses of the previous high are the key. Judging from the 1H chart, the short-term death cross continues to fall. At the same time, according to the 4H level, as time goes by, we need to pay attention to the support of 3413-3403. This support is the key watershed of the short-term trend. As long as it does not fall below this support, the bulls still have a chance.
🏅 Trading strategies:
BUY 3413-3403
TP 3430-3440
If you agree with this view, or have a better idea, please leave a message in the comment area. I look forward to hearing different voices.
OANDA:XAUUSD FX:XAUUSD FOREXCOM:XAUUSD FXOPEN:XAUUSD TVC:GOLD

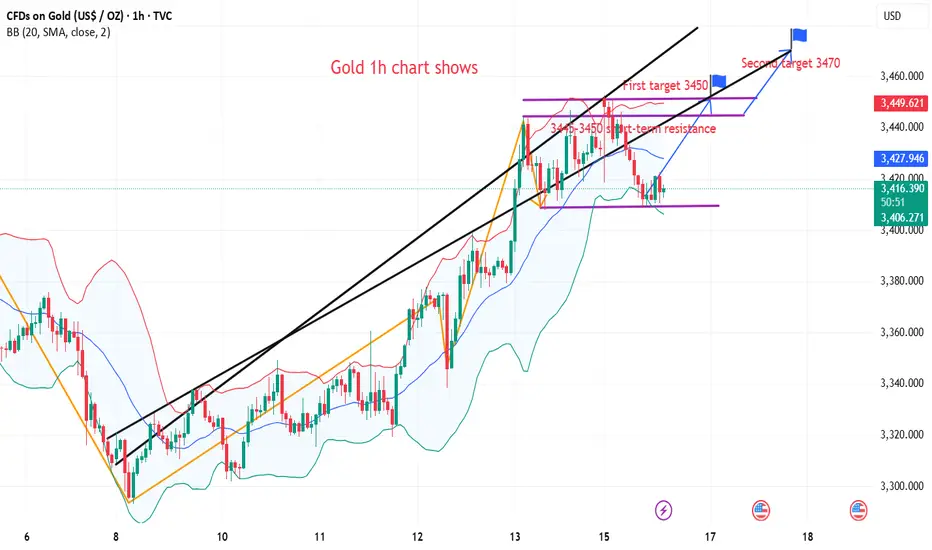
Gold short-term strategy
📊Technical aspects
Gold technicals continued the bullish unilateral oscillation upward rhythm. The daily level closed with a strong positive for three consecutive trading days. The overall price continued the bullish unilateral oscillation upward rhythm.
Today, the market opened high at 3448, and the highest reached 3452 and then fell back. So far, the lowest fell back to 3409 and rebounded.
The current market trend is to go long on the retracement. The trend remains unchanged. Don’t be misled by the retracement adjustment.
From the 1-hour market analysis, the support below is around 3408-10, and the short-term bullish strong dividing line moves up to the 3388-93 level.
The daily level stabilizes above this position and continues to maintain the same low-long rhythm. Short positions against the trend need to be cautious. There is a high probability that the short-term will continue to rush up and test the previous high.
I will remind you of the specific operation strategy in the channel, please pay attention.
💰 Strategy Package
Long Position:3410-3420
NAS100 Potential ReversalHi there,
The NAS100 is slightly bullish and fairly stagnant. It is consolidating between two key levels (orange lines). A break below the price might fall into deeper demand zones.
Short Notes
- **Elliott Wave**: 5-wave structure appears complete at resistance (22,137.8), signalling a possible reversal.
- **Liquidity Zones**: Price is at/near a major liquidity zone, increasing reversal risk.
- **Break High**: There's a potential for a false breakout above wave 5 before dropping.
- **Support Levels**: The 21,800.6 (previous day high) and 21,146.2 (previous day low) for first support.
- **Demand Zones**: Strong demand below 21,146.2, with deeper support near 20,000 and 18,800.
- **Overview: A possible bearish move ahead from current highs, targeting lower demand zones.
Happy Trading,
K.
Not trading advice

gold for long 30m*The content on this analysis is subject to change at any time without notice, and is provided for the sole purpose of assisting traders to make independent investment decisions.

btc for long 30m*The content on this analysis is subject to change at any time without notice, and is provided for the sole purpose of assisting traders to make independent investment decisions.

dxy for short 30m*The content on this analysis is subject to change at any time without notice, and is provided for the sole purpose of assisting traders to make independent investment decisions.

Short positions fall as expected, long opportunities reappearToday, gold maintained high and fluctuated repeatedly after opening, but the upper side has not been effectively broken through. After repeated pressure, the resistance signal was confirmed. We arranged short orders near 3445. The market fell back as expected and accurately hit the target position. The trend was highly consistent with the prediction, which once again confirmed the trading concept of "planning before the market, execution before emotion".
From the current trend structure, gold is still in a bullish trend as a whole, and short-term adjustments are normal. The support below focuses on the 3420-3415 area, which is the first defense position for short-term retracement; and the more critical bullish defense line is still at the 3405-3400 line. If this area stabilizes, it is still our core layout area for low-multiples with the trend.
The daily structure is still intact, and the long arrangement of the moving average system has not been destroyed. Short-term fluctuations do not affect the overall bullish logic. Therefore, the operation is still based on retracement and main longs, and following the trend is the kingly way. Short orders can only be participated in the short term, and stop when you reach the point, and do not hold against the trend. I will remind you of the specific operation strategy at the bottom, and pay attention to it in time. The key next is to pay attention to the stabilization signals below and wait for the market to provide new opportunities for momentum release.
If you still lack direction in gold trading, you might as well try to follow my pace. The strategy is open and transparent, and the execution logic is clear and definite, which may bring new breakthroughs to your trading. The real value does not rely on verbal promises, but is verified by the market and time. 🌐

DeGRAM | BTCUSD formed the rising bottom📊 Technical Analysis
● BTC rebounded exactly at the purple long-term trend-line and green 102.5-104 k demand, reclaiming the 105-106 k support band; the old wedge cap is now acting as a floor.
● Price is coiling in a 16-h bull flag beneath 108 k; its 1.618 projection intersects the channel roof/ red supply at 111.6-115 k, while rising lows keep momentum pointed up.
💡 Fundamental Analysis
● U.S. spot-BTC ETFs attracted about $240 m of net subscriptions on 14 Jun, ending the outflow streak and signalling renewed institutional demand as exchange reserves slide to multi-year lows.
● Benchmark 10-yr Treasury yields are back under 4.45 %, easing dollar pressure and helping risk assets rebuild after the FOMC spike.
✨ Summary
Buy 105-106 k; flag breakout above 108 k targets 111.6 k → 115 k. Invalidate on a close below 101.8 k.
-------------------
Share your opinion in the comments and support the idea with a like. Thanks for your support!

GOLD Eyes New Highs Amid Geopolitical Risk and Bullish StructureGOLD – Safe-Haven Demand Lifts Gold, Eyes on New Highs if Tensions Escalate
Gold futures pared some gains after approaching fresh record highs earlier in the session. The metal rallied strongly on Friday as escalating Middle East tensions — particularly between Israel and Iran — drove investors toward safe-haven assets.
Analysts note that if the conflict intensifies further in the coming days, new highs could be within reach for gold.
Technical Outlook:
A short-term correction toward 3404 or 3390 is likely. However, as long as the price holds above this support zone, the bullish trend is expected to continue toward 3448, with potential to reach 3486.
For a bearish shift, the price must break below the 3391–3381 area with at least a confirmed 1H close, which would open the path toward 3347.
Key Levels:
• Resistance: 3431, 3449, 3486
• Support: 3404, 3391, 3381

AUDCHF: Pullback From Resistance 🇦🇺🇨🇭
There is a high chance that AUDCHF will retrace from a key daily resistance.
As a confirmation, I see a strong rejection on an hourly time frame.
Goal - 0.5267
❤️Please, support my work with like, thank you!❤️
I am part of Trade Nation's Influencer program and receive a monthly fee for using their TradingView charts in my analysis.

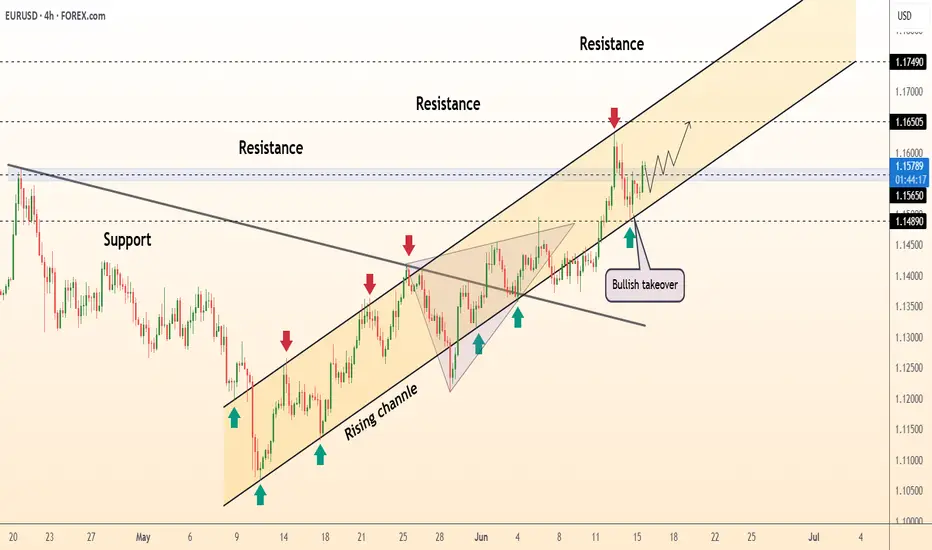
DeGRAM | EURUSD fixed above the lower boundary of the channel📊 Technical Analysis
● Euro keeps stair-stepping along the inner trend-line of the 2-month rising channel; each dip to the line (green arrows) is met with higher lows, confirming firm demand around 1.1485-1.1500.
● Friday’s break back above the former wedge cap turned 1.1550 into support; clearing the last swing high at 1.1605 would expose the channel median / fib cluster at 1.1650, with the upper rail near 1.1745 as an extension.
💡 Fundamental Analysis
● Softer US retail-sales and a slump in NY Fed manufacturing pulled Treasury 2-yr yields under 4.70 %, while ECB speakers warned that further cuts “are not a given,” narrowing the rate gap and reviving euro bids.
✨ Summary
Long 1.1520-1.1560; hold above 1.1550 targets 1.1650 ➜ 1.1745. Bias void on an H4 close below 1.1480.
-------------------
Share your opinion in the comments and support the idea with like. Thanks for your support!
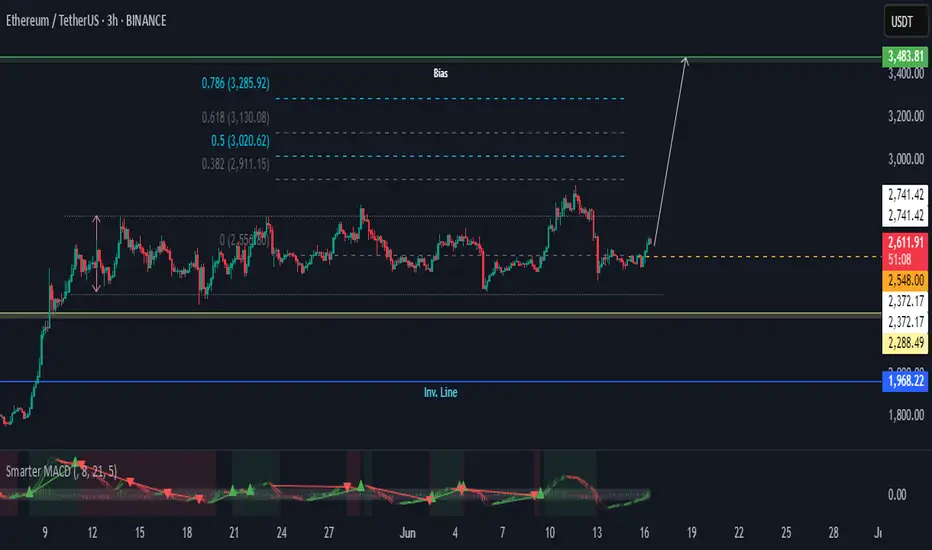
Ethereum TA: Bullish Momentum Signals Potential RallyHi there,
Ethereum shows bullish momentum with a positive MACD crossover while consolidating above key support levels, suggesting potential upward movement.
Ethereum’s price structure is strengthening, and if it clears the 2741.42 resistance, it could trigger a rally toward 3020.62–3285.92.
Happy trading
K.
Not trading advice.
Positive market: OIL rises sharply - Important area to watch forThe recent escalation of tensions in the Middle East has had a strong ripple effect across all commodities market. Just as we observed with Gold, it’s no surprise we’ve seen oil prices climb as well, given this uncertainty.
If you’ve seen my latest Gold analysis, you’ll understand how market sentiment has turned uneasy, and in times like these are what people trust when everything else feels risky. And naturally, with everything going on, Gold is seeing stronger demand again, and I expect the price to steadily climb and reach new highs because the momentum is unmistakable.
On Friday the 13th, oil prices spiked abruptly before pulling back slightly, showing just how sensitive the market is to potential supply disruptions. What’s fueling this rally is obvious, and it’s the fear around supply from such an important oil-producing area. This creates a great opportunity to take a position.
As you can see in my analysis, the price has recently broken above a key resistance zone and may come back for a retest. If this level holds as support, it would really confirm the bullish bias and make the move towards my anticipated target of 77,50 high probability, towards the next resistance zone level at 77,50 and 79,50.
If the price remains over this support zone, my bullish outlook stays the same. But, if it doesn’t hold above this level we could see a slight pullback before another definitve move up.
In such times, it’s important to watch price action closely especially near key technical levels, and let the market show your next move.

RECORD long!The fundamentals are attractive, and price is testing key monthly horizontal support. Seems like a good opportunity.
LSE:REC

EURUSD: Bullish Move After BreakoutThe price action on EURUSD shows that it broke through a horizontal resistance level on the 4-hour chart.
Following the breakout, a local correction occurred, forming a bullish flag pattern.
As the NY session opened, the market rose and surpassed its resistance line, indicating a strong likelihood of continued upward movement.
The target is set at 1.1616.

SHOT ON EUR/USDEUR/USD Has given us a nice double top at a major resistance level.
Since then it has broken the neckline of that double bottom, creating a new low, engineering liquidity, sweeping it and now getting ready to tap into supply before it should fall.
The Dxy is also getting ready to rise from a demand level so this should also aid in pushing EU down.
Looking to catch over 200 pips.

BTC Weekly ChartJust consolidating around ATHs at this point.
Its bound to see a huge move either way eventually.

Analysis and Forecast for EUE/USDToday, the EUR/USD pair is under pressure, having failed to consolidate above the 1.1447 level and showing intraday declines toward the psychological level of 1.1415 and below, amid U.S. dollar strength.
The main drive of the dollar's rise was Friday's strong U.S. Non-Farm Payrolls (NFP) report, which reduced expectations for an imminent rate cut by the Federal Reserve this year. In addition, optimism surrounding the potential resumption of U.S. -China trade talks is dampening bearish sentiment toward the dollar, thereby adding further pressure on EU/USD.
Nevertheless. ongoing negotiation in London and the upcoming key U.S. inflation data later this week are prompting traders to remain cautious and refrain from opening aggressive positions. The market still considers a September Fed rate cut likely, and concerns about the U.S. government's fiscal position are limiting the dollar's upside potential, which in turn lends some support to the euro.
On the other hand, the European Central Bank signaled at its latest meeting that the current rate-cutting cycle may be nearing an end. This also supports the euro and helps limit EUR/USD losses. In the absence of significant economic releases from the eurozone or the U.S. today, the pair's movement is mainly driven by dollar dynamics.
Technically, in order to resume upward movement, EUR/USD needs to break through resistance in the 1.1450-1.1460 level, which could open the path toward the psychological level of 1.1500. A break above that could lead to a retest of late-April highs. Otherwise, the risk of further decline toward the 1.1370 support level remains. However, oscillators on the daily chart are still in positive territory, indicating a generally constructive outlook for the pair.
In the short term, caution advised, with focus on signals from the trade negotiations and upcoming economic data.
