CHECK EURJPY SIGNAL READ CAPTAINCHECK (eurjpy) sell zone
( TRADE SATUP)
ENTRY POINT (163.150) to (163.100) 📊
FIRST TP (162.950)
2ND TARGET (162.700) 📊
LAST TARGET (162.500) 📊
STOP LOOS (163.400)❌
Support and Resistance

CHECK XAUUSD SIGNAL READ CAPTAINbtcusd) buy zone
( TRADE SATUP)
ENTRY POINT (105.350) to (105.250) 📊
FIRST TP (105.750)
2ND TARGET (106.200) 📊
LAST TARGET (106.700) 📊
STOP LOOS (104.600)❌

CHECK USDJPY SIGNAL READ CAPTANusdjpy) buy zone
( TRADE SATUP)
ENTRY POINT (142.850) to (142.750) 📊
FIRST TP (143.150)
2ND TARGET (143.550) 📊
LAST TARGET (143.900) 📊
STOP LOOS (142.350)❌

CHECK EURUSD SIGNAL READ CAPTAINeurusd) buy zone
( TRADE SATUP)
ENTRY POINT (1.13900) to (1.13850) 📊
FIRST TP (1.14050)
2ND TARGET (1.14250) 📊
LAST TARGET (1.14450) 📊
STOP LOOS (1.13650)❌


EURUSD: Rise Ahead! 🇪🇺🇺🇸
EURUSD successfully violated a significant horizontal supply area yesterday.
The broken structure and a rising trend line compose a contracting demand zone now.
It will be the area from where I will expect a rise to higher level.
The next strong resistance is 1.151
❤️Please, support my work with like, thank you!❤️
I am part of Trade Nation's Influencer program and receive a monthly fee for using their TradingView charts in my analysis.

Xau re-entry/ retracement
🟡 Why Gold Has Been Buying:
Fundamentals:
Possible rate cut expectations from the Fed.
Geopolitical tensions or inflation concerns.
Weakening USD momentum.
Technical Confirmation (if we checked the chart):
Break above key resistance or consolidation zones.
Higher lows forming on the 4H and daily charts.
Volume supporting the breakout.
Let me break it down:
🔍 Technical Analysis Breakdown
1. Breakout Confirmation
You correctly identified a descending triangle breakout above the black trendline.
Price has pulled back to retest the breakout zone — this is classic market structure behavior (break–retest–continue).
2. Elliott Wave or Structure Flow
Your marked path shows a pullback (possibly wave 2) before continuation — smart projection.
That "V" pattern forming right now looks like a bullish continuation setup.
3. Fibonacci and Demand Zone
The retest aligns near the 38.2% or 50% retracement — high-probability reversal zones.
You also have a strong demand zone (grey box) acting as a support floor.
4. Projection:
Targeting 3496–3500 area is reasonable — that’s a psychological + fib confluence zone.
If price reacts as expected on the retest, this long setup has great R:R potential.
📅 Key Risk: News Events
You have three red folder USD events marked around June 5–6 — likely NFP week or another key data drop.
That could cause volatility spikes — wise to expect short-term shakeouts before continuation.
✅ Verdict:
You're on the right track — this is a clean bullish setup.
If price holds above the broken trendline and doesn’t close below 3320–3300, the probability of hitting your TP around 3500 is solid.
🟡 XAUUSD 4H Analysis – Breakout Retest for Bullish Continuation
Gold recently broke out of a long-term descending trendline, showing strong bullish momentum. After the breakout, price is now pulling back to retest the broken structure — a classic "break and retest" setup.
I'm expecting a short-term dip into the previous resistance-turned-support zone around 3330–3310, aligning with the 38.2–50% Fibonacci retracement and a key demand area.
🔵 Trade Plan:
Looking for bullish confirmation at the retest zone.
Targeting the 3496–3500 level (previous high + Fib extension confluence).
Bullish structure remains valid as long as price holds above 3300.
⚠️ Fundamental Note:
Upcoming high-impact USD news (NFP, etc.) may cause short-term volatility. Patience and tight risk management are key.
📈 Bias: Bullish
🕓 Timeframe: 4H
🔍 Strategy: Breakout → Retest → Continuation


The secret behind the surge in gold prices
💡Message Strategy
(June 2) Gold prices soared nearly 3% as U.S. President Trump's tariff threats intensified trade tensions, stimulating investors' demand for safe-haven assets, and the U.S. dollar plummeted.
The dollar index fell nearly 0.8% on Monday. The sharp drop in the dollar makes dollar-denominated gold cheaper for holders of other currencies.
US President Trump said last Friday that from June 4, the tariff on US imported steel and aluminum will be raised from the current 25% to 50%. British Reuters said that this has once again disrupted international trade.
A spokesman for the European Commission expressed strong regret over the US announcement that it would increase tariffs and said that the EU is ready to implement countermeasures. The Canadian industry also expressed strong opposition, emphasizing that disrupting the cross-border supply chain of steel and aluminum will cause huge losses to both Canada and the United States.
📊Technical aspects
On the daily chart, gold rebounded from a two-week low and hit a four-week high this week, with a strong short-term trend.
For gold's lower support, focus on the breakout position of $3,350 in the U.S. session on Monday, which is also near the high point of gold last week, and the low point of $3,345 after the gold price rose in the European session on Monday;
For gold's upper pressure, focus on the integer position of $3,400 and the upper track of the daily Bollinger band near $3,410. For further strength, focus on the high of gold in May at $3,438.
The 5-day moving average and the MACD indicator re-formed a golden cross, and the KDJ and RSI indicators formed a golden cross downward. The short-term technical aspect shows that after the adjustment of gold, the bears began to gain an advantage.
💰 Strategy Package
Short Position:3385-3375,3395-3410

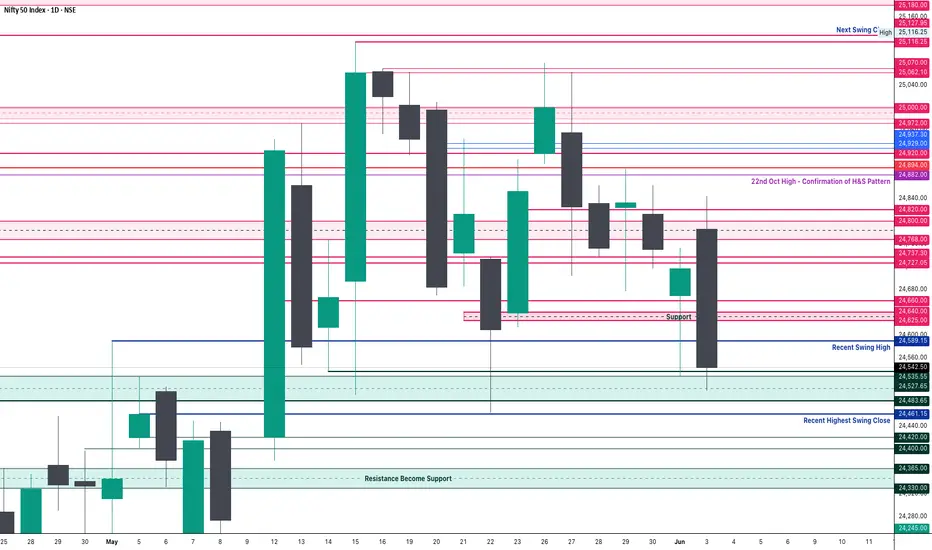
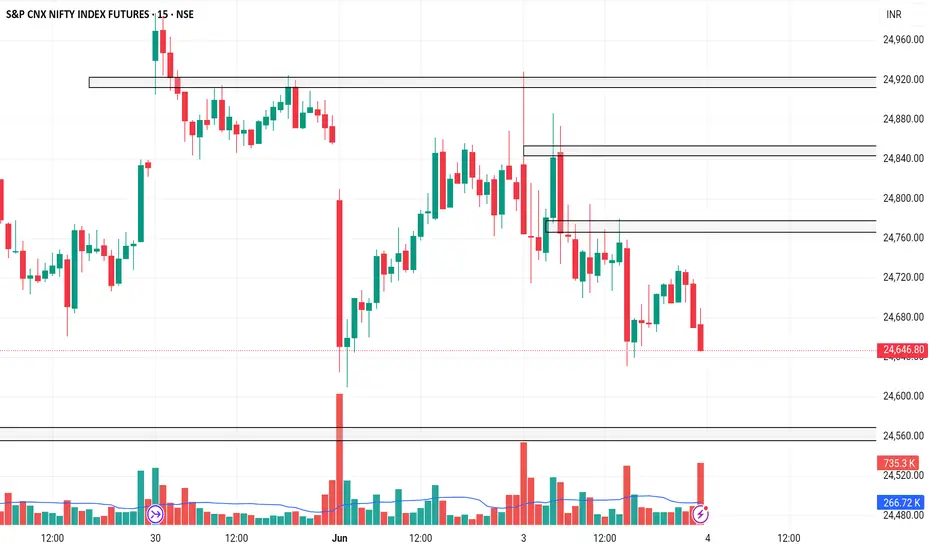
Nifty Analysis EOD – June 3, 2025 – Tuesday🟢 Nifty Analysis EOD – June 3, 2025 – Tuesday 🔴
Opening Sentiment vs. Reality: A Day of Dual Personality
Nifty opened with a 70-point gap-up above the previous day’s high, carrying a positive vibe. In just one minute, it surged another 57 points, marking the day’s high at 24,845. However, that bullish momentum didn’t last. The index faced strong resistance, leading to a sharp 243-point drop within 15 minutes, breaching CPR and the previous swing low to hit the first Current Day Low (CDL) at 24,601.30.
Despite the jolt, Nifty showed resilience—bounced back from the 24,625–24,640 zone, recovered to VWAP, and even retested the PDH. Yet again, it failed to hold above 24,700, echoing the morning's rejection. A second wave of selling took Nifty to a fresh low of 24,502.15 mid-session.
The closing wasn’t any better. Nifty quietly slid again, retested the breakout zone, and closed at 24,542.50, nearly at the intraday low—a day that started with hope ended on a pessimistic note.
Interestingly, India VIX also dropped, despite the downward market move—signalling premium crush and a double whammy for option buyers who got the direction right but profits wrong.
🛡 5 Min Chart with Levels
📊 Daily Summary Highlights
✅ Gap-up Start but sharp reversal
📉 Both PDH and PDL tested intraday
📉 Marubozu Engulfing Candle
⚠️ Closed below Higher Swing Low – a potential trend-shift signal
🕯 Daily Time Frame Chart
🕯 Daily Time Frame Chart
🕯 Daily Candle Breakdown
Open: 24,786.30
High: 24,845.10
Low: 24,502.15
Close: 24,542.50
Net Change: −174.10 (−0.70%)
🕯 Candle Structure
Real Body: 243.80 pts (Big red candle)
Upper Wick: 58.80 pts
Lower Wick: 40.35 pts
Interpretation
A classic bearish reversal day. Price opened higher, reached a new high, but was aggressively sold off, closing near the day’s low. This large-bodied red candle with small wicks shows clear control by the bears.
Candle Type
🟥 Bearish Marubozu-like Candle
Strong rejection at highs
Bearish dominance confirmed
Lower close signals momentum continuation to the downside
Key Insight
24,845 now acts as a firm resistance.
Break below 24,500 could accelerate correction.
Bulls need to defend 24,500–24,520 zone decisively to avoid further weakness.
🛡 5 Min Intraday Chart
⚔️ Gladiator Strategy Update
ATR: 279.13
IB Range: 243.80 → Medium IB
Market Structure: Balanced
Trades:
🔻 12:50 PM – Short Triggered → 📍 1:1 Target Achieved, but timeout
📌 Support & Resistance Zones
Resistance Levels
24,600
24,625 ~ 24,640
24,660
24,727 ~ 24,737
24,768 ~ 24,800
24,820
24,882
24,894 (Strong Resistance)
Support Levels
24,530 ~ 24,480
24,460
24,420 ~ 24,400
24,365 ~ 24,330
24,245 ~ 24,240
💭 Final Thoughts
The market showcased a classic reversal and punished emotional entries. Despite the gap-up euphoria, technical levels reigned supreme. The break below swing low could signal caution for bulls in the coming sessions.
📌 "Respect the levels, not the emotions. Every bounce is not a bottom; every fall isn’t a crash."
✏️ Disclaimer
This is just my personal viewpoint. Always consult your financial advisor before taking any action.
XAUUSD M15 Support & Resistance Levels🚀 Here are some key zones I've identified on the 15m timeframe.
These zones are based on real-time data analysis performed by a custom software I personally developed.
The tool is designed to scan the market continuously and highlight potential areas of interest based on price action behavior and volume dynamics.
Your feedback is welcome!


Why I Think USDJPY Will Sell...Technical AnalysisHey Rich Friends,
Happy Tuesday! I wanted to share my USDJPY analysis and why I think it will sell. This is only a technical analysis so please check the news and cross-reference your own charts. Here is what I am looking at:
- Momentum is picking up for the sellers with red candles forming on H4, H1 and M15.
- The stoch is facing down, both lines have crossed below 80, slow line (orange) is above the fast line (blue) which is a bearish confirmation for me.
Additional information:
- I will also wait to see if both lines of the stoch cross below 50 to confirm the down trend.
- I will be setting sell stops and using previous highs as my SL and previous lows as my TPs.
Good luck if you decide to take this trade, let me know how it goes.
Peace and Profits,
Cha

What is a Bearish Breakaway and How To Spot One!This Educational Idea consists of:
- What a Bearish Breakaway Candlestick Pattern is
- How its Formed
- Added Confirmations
The example comes to us from EURGBP over the evening hours!
Since I was late to turn it into a Trade Idea, perfect opportunity for a Learning Curve!
Hope you enjoy and find value!


USD/JPY M15 Support & Resistance Levels🚀 Here are some key zones I've identified on the 15m timeframe.
These zones are based on real-time data analysis performed by a custom software I personally developed.
The tool is designed to scan the market continuously and highlight potential areas of interest based on price action behavior and volume dynamics.
Your feedback is welcome!

GBP/USD M15 Support & Resistance Levels🚀 Here are some key zones I've identified on the 15m timeframe.
These zones are based on real-time data analysis performed by a custom software I personally developed.
The tool is designed to scan the market continuously and highlight potential areas of interest based on price action behavior and volume dynamics.
Your feedback is welcome!

Gold is taking a break, the next wave will be even stronger.Gold opened at 3382 today and rebounded to 3392 for a technical decline adjustment. So far, gold has hit a low of 3351. Currently, gold continues to fluctuate around 3360. We will pay attention to the support situation at 3345-50 below. If it does not break through, we will look for opportunities to go long.
Judging from the current trend of gold prices, the overall bullish trend remains, and there is still the possibility of further upward movement in the short term. The support below focuses on the 3345-3350 area, which is an important defensive position for short-term bulls. If it falls back to this area and stabilizes during the day, you can continue to rely on this position to arrange long orders, and the bullish thinking remains unchanged. Pay attention to the 3395-3400 first-line pressure above. If this range is effectively broken, the gold price is expected to hit the previous high and further open up the upward space. From the daily level, the market is still in the "low-long" rhythm of the trend, and it is expected to maintain a volatile upward trend in the short term. The recent market fluctuations are large. In terms of operation, it is necessary to strictly control the position and pay attention to risk prevention.
Gold operation strategy recommendation: Go long when gold falls back to 3345-3355, target: 3380-3390.

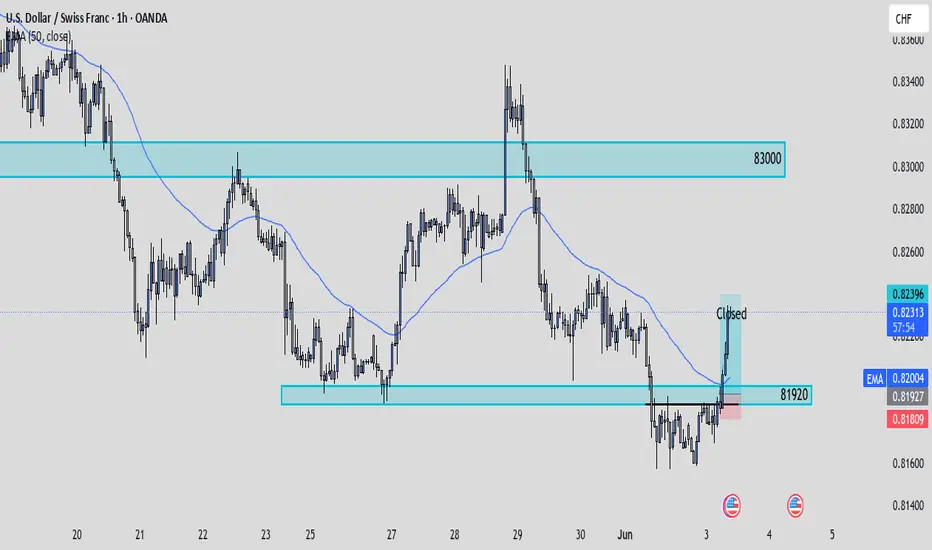
UsdChf Trade UpdateI never got to post the UC set up I was looking at this morning since everything happened so fast. UC is a bullish pair at the moment! I ended up take longs once I seen price create a new low just below a main level before breaking back to the upside. The shift of structure on the smaller time frame confirmed the bullish move which is why I decided to execute longs at 81927 with stops just below structure. I was looking to target a 1:3rr as always. Price played out beautifully where I then decided to cut profits a few pips away. I'll be looking for more longs on this pair. We could expect price to tap back into 83000.
EUR/USD M15 Support & Resistance Levels🚀 Here are some key zones I've identified on the 15m timeframe.
These zones are based on real-time data analysis performed by a custom software I personally developed.
The tool is designed to scan the market continuously and highlight potential areas of interest based on price action behavior and volume dynamics.
Your feedback is welcome!

EURUSD BREAKDOWN THE BULLISH TREND SELL STRONG WATCH THE LEVELSFX:EURUSD Breakdown Alert
The bulls have lost steam — selling pressure is taking over!
📉 Entry Level: 1.13800
🕒 Timeframe: 30 Min
🔻 Technical Targets:
• 1st Target: 1.13200 – Demand Zone
• 2nd Target: 1.12200 – Major Support
The structure shows clear bearish momentum. Watch for confirmations before entering. Stay sharp and trade smart! 💼💥
👇 Like | 💬 Comment | 🔔 Follow for real-time updates & setups
#Forex #EURUSD #TradingSetup #TechnicalAnalysis #PriceAction #DayTrading
