USNAS100- Geopolitical Pressure Builds,NAS at Key Decision PointUSNAS100 – Technical Overview
🔻 Bearish Outlook:
The price is currently testing 21780. A 4H candle close below this level would confirm downside continuation toward 21635.
A break below 21635 would further strengthen the bearish trend, targeting 21470 and 21375.
🔺 Bullish Scenario:
Bullish momentum may return if the price breaks and holds above 21780 on the 4H timeframe, with upside targets at 21930, and potentially 22090.
• Support: 21635/ 21475 / 21375
• Resistance: 21780 / 21930 / 22090
Support and Resistance

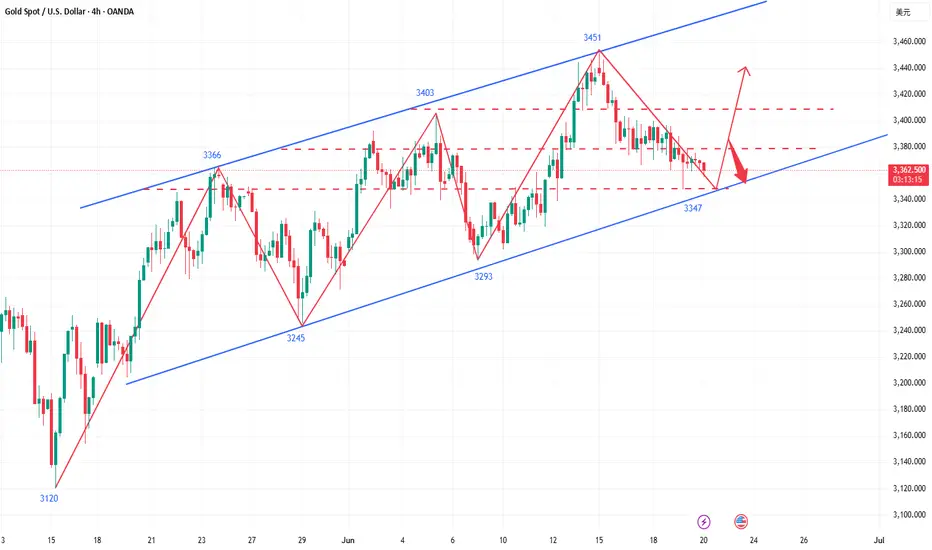
The bulls are not dead yet, it’s time to ambush at low levels!Gold only opened higher and rose on Monday this week, and then reached the highest level of 3452, and then started the road of shock and retracement this week. As of today, Friday, gold is still oscillating and adjusting in the lower range, but from the 4-hour market trend, the trend of gold is still dominated by bulls. In the short term, gold is oscillating and adjusting at a low level. Today, Friday, we will first focus on the support level of 3347-3353 below, which is also the starting point of the rebound yesterday. If this position is not broken today, Friday, we will mainly rebound and close.
From the 4-hour analysis, the support below focuses on 3347-3353, and the short-term resistance above focuses on the 3378-3385 level, with a focus on the 3408-3415 level. Continue to rely on this range to maintain the main tone of high-altitude low-multiple cycle participation unchanged, and the middle position is always more watchful and less active, cautiously chase orders, and patiently wait for key points to enter the market.
Gold operation strategy: Go long when gold falls back to 3347-3355, with a target of 3370-3380.
If you still lack direction in gold trading, you might as well try to follow my pace. The strategy is open and transparent, and the execution logic is clear and definite, which may bring new breakthroughs to your trading. The real value does not rely on verbal promises, but is verified by the market and time.
US30 Under Pressure as Geopolitical Risks Drive VolatilityUS30 – Technical Overview
Dow Jones (US30) futures are trading lower amid escalating tensions in the Middle East, with markets closely monitoring any potential U.S. response that could significantly sway sentiment.
⚠️ Volatility remains elevated, and traders should remain cautious ahead of potential geopolitical developments.
US30 continues to trade below the key level at 42160, maintaining a bearish bias.
As long as the price stays below this level, further downside remains likely.
However, the market is also testing the pivot zone, and a confirmed break above 42160 could trigger a bullish move toward 42410.
Key Levels:
• Pivot: 42160
• Support: 41900 / 41780 / 41310
• Resistance: 42310 / 42410 / 42580

SHORT ON EUR/GPBWe have a rising channel (bearish reversal chart pattern) at a major level of resistance (confluence)
Price has given us a breakout of the channel to the downside and is currently respecting resistance.
I will be selling EUR/GBP to the next support level looking to catch over 120 pips.

Gold Formation as Growing trendXAUUSD (Gold) Price Analysis
Gold is currently testing trend support, undergoing a deep correction amid a complex fundamental backdrop. Several key factors are influencing market sentiment:
Geopolitical tensions in the Middle East Comments from the Federal Reserve Former President Trump's expressed desire for lower interest rates These developments are contributing to market uncertainty, which typically supports gold as a safe haven.
🔍 Technical Outlook
Support Zone: 3350
Resistance Levels: 3400 and 3420
Before further upside, a retest of the 3350 support zone is possible. You can see more details in the Chart Ps Support with like and comments for more analysis.

Nifty levels - Jun 23, 2025Nifty support and resistance levels are valuable tools for making informed trading decisions, specifically when combined with the analysis of 5-minute timeframe candlesticks and VWAP. By closely monitoring these levels and observing the price movements within this timeframe, traders can enhance the accuracy of their entry and exit points. It is important to bear in mind that support and resistance levels are not fixed, and they can change over time as market conditions evolve.
The dashed lines on the chart indicate the reaction levels, serving as additional points of significance to consider. Furthermore, take note of the response at the levels of the High, Low, and Close values from the day prior.
We hope you find this information beneficial in your trading endeavors.
* If you found the idea appealing, kindly tap the Boost icon located below the chart. We encourage you to share your thoughts and comments regarding it.
Wishing you success in your trading activities!
XAUUSD Broken from ascending channel with big bearish candle📉 XAUUSD (Gold) Technical Breakdown – 1H Time Frame
Gold has broken down from the hourly bullish channel and is showing strong selling pressure.
💥 Sell Entry: 3365
🎯 Targets:
1️⃣ 3345
2️⃣ 3323
3️⃣ 3295
Bearish momentum is building—watch these levels closely for potential moves.
📊 Like, Follow, and Comment 💬
🚀 Join us for more live trade ideas and updates!
By Livia 😜

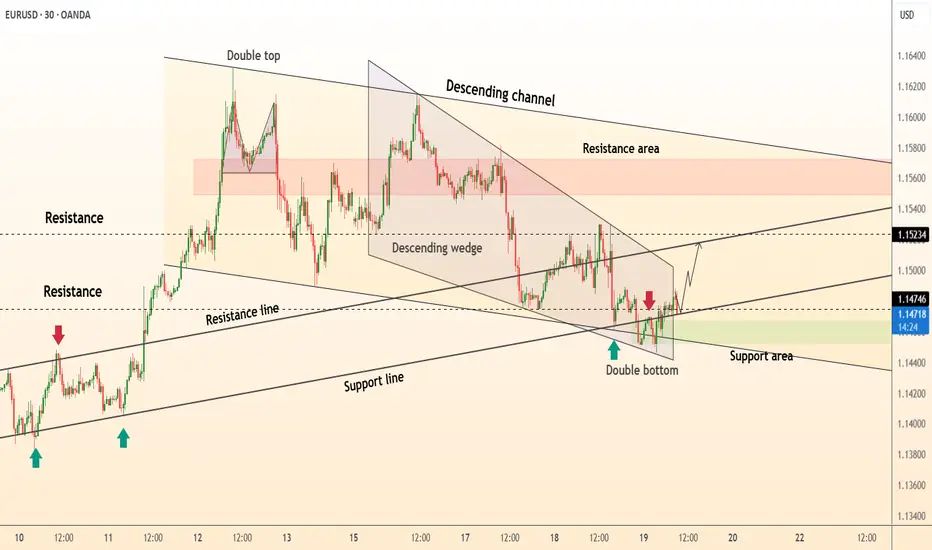
DeGRAM | EURUSD double bottom📊 Technical Analysis
● The price is currently testing the upper resistance of a descending wedge pattern after forming a clear double bottom formation. This double bottom occurred precisely at a confluence of support, where the long-term ascending support line intersects with the lower boundary of the wedge, indicating a strong potential for a bullish reversal from the 1.1450-1.1470 area.
● This recent bullish price action follows a prior "double top" pattern that initiated the corrective move downwards into the current wedge. A decisive breakout and hold above the wedge's resistance would invalidate the recent bearish pressure and confirm that buyers are taking control, with the first significant target being the horizontal resistance line near 1.1523.
💡 Fundamental Analysis
● Market attention is centered on the upcoming U.S. Federal Reserve policy meeting. While no rate change is expected, forward guidance is key. Current market sentiment, as noted by analysts at RoboForex and FreshForex, is pricing in the possibility of a Fed rate cut later this year, which could place downward pressure on the US Dollar.
● Conversely, the Euro is finding support from a comparatively hawkish European Central Bank (ECB). Recent reports indicate that the probability of an ECB rate cut has diminished, suggesting a policy divergence that favors EUR strength against the USD, underpinning the technical case for a move higher.
✨ Summary
Long entry on a confirmed 30-minute candle close above the descending wedge resistance (~1.1485); initial target 1.1523 → 1.1560. The bullish outlook is invalidated on a close below the double bottom support at 1.1450.
-------------------
Share your opinion in the comments and support the idea with a like. Thanks for your support
BTC/USDT Technical Analysis, 2025-06-20 19:45 UTCBTC/USDT Technical Analysis, 2025-06-20 19:45 UTC
💡 Trade Setup Summary
Pattern Detected: Bullish Hammer at local bottom
Confirmed by bullish candle close above pattern high
Volume Confirmation:
Volume Flow Analysis → Increasing OBV
Current Volume = 5.17, which although lower than the short-term mean, is paired with a positive trend
Order Book & Whale Confirmation:
Whale Bids > 2 BTC detected: 1 order, 3.54 BTC
Order Book Imbalance: 36.84% favoring buyers
Technical Indicators :
✅ Oversold region confirmed (likely RSI < 30, inferred by engine)
✅ Bullish pattern with volume trend confirmation
✅ Order book imbalance > 2%
✅ Whale bid presence
✅ Market pressure shows buyer dominance
✅ OBV increasing
Entry Price: 103146.58
Target (TP): 105646.58
Stop Loss (SL): 102146.58
Risk:Reward Ratio: ~2.5:1

Bullish Tone, and made a trade based on Pivots amd FVG in comboTrade Analysis
(1) Trade Plan:
The idea was that the short term trend looked bullish, hence I marked up the key levels and checks to see if the price was at any of the pivot levels. Based on the idea when price crosses the Centre Top Pivot and is above a support . Further more it already visited a recent Bullish.. Hence the price may continue towards R1 above.
-
(2) Indicators (4 of 5):
- Only Pivot and Support lines and FVG
(3) Confirmations (3 of 3):
- 30 min candle closing well above the TOP Centre Pivot line.
(4) Risk Management Plan:
- This was little high as it was set to below the end of the Bullish FVG at the bottom. On hindsight i should have waited on my entry for a revisit. However sometimes i don't wait as it does not revisit.
(5) Profit Target:
- R1
(6) Stop Loss:
- Bottom Of FVG
(7) Entry:
- First Candle after 30 min candle closed above TCP
(8) Profit Taking Plan:
-
(9) Analyzation:
-
(10) Psychology of the Trade:
-
(11) Overall Rating:
(12) What was Good:
-
(13) What was Bad:
-
(14) Improvement Areas:
-
(15) Rule Broken & Key Takeaways:

EURAUD → Breakout and consolidation above key supportOANDA:EURAUD is trying to consolidate above the key support zone of 1.76 - 1.77. Within the uptrend, bulls have a fairly good chance.
The market continues to break of structure, confirming the bullish sentiment on the chart. A correction is forming from 1.7882. Before rising, the price may test support. The currency pair is supported by its own bullish trend and the falling dollar (especially against the backdrop of economic problems with the USD (DXY)).
Technically, the currency pair looks quite positive. After the formation of another ‘bos’, we are seeing a correction to the Fibonacci zone of 0.7 and support at 1.7696. If, during the retest, the bulls manage to hold their ground above the key support level, growth may continue in the medium term.
Support levels: 1.7696, 1.7629, 1.7463
Resistance levels: 1.7882, 1.7988
Locally, a reversal pattern is forming relative to the specified zone (as part of a correction). We need to wait for confirmation (price consolidation above the level). The potential within the bullish trend is quite large, and in the medium and long term, the price may test 1.85.
Best regards, R. Linda!

AMAZON TROUBLENASDAQ:AMZN Is currently trading Just 11% below its all time high and currently Facing exhaustion.
Amazon is currently trading 217$ range which was previous support now turned resistance (Daily Timeframe) , making a double top pattern and a negative divergence on the RSI.
The best Trades are the ones with multiple confirmations
- Trading at a resistance (1D chart)✅
- Negative Price Action at the resistance (Double Top Pattern)✅
- RSI negative divergence✅
- Market Structure ✅
Entry Criteria
- A Red candle at the entry Line Marked
- Stoploss Above the Entry Candle
Target 1- 211$
Target 2- 208$
Keep Your Risk Reward Intact! Not An investment Advice

GOLD → Continuation of the global trend... To 3350?FX:XAUUSD is testing trend support within a correction. Against a complex fundamental backdrop (the Middle East, Fed comments, Trump's desire to lower rates), the price may continue to rise.
The price of gold rose from a weekly low of $3,363 on Thursday thanks to increased demand for safe-haven assets following reports of possible US strikes on Iran. Markets are ignoring the Fed's hawkish decision to maintain its tight policy and rate forecasts. Traders are waiting for new signals from the Middle East, given the risk of increased volatility due to low liquidity in connection with the US holiday.
Technically, a bullish wedge pattern is forming as part of the correction. The breakdown of the pattern's support did not lead to a decline, but a return of prices and a breakout of resistance could trigger growth after liquidity returns.
Resistance levels: 3373, 3403, 3420
Support levels: 3349, 3320
Before growth, a retest of the trend support or the 3350 zone is possible. However, if the price goes above 3375 and the bulls hold their ground above this level, then we can expect growth to continue within the trend.
Best regards, R. Linda!

ADAUSDT → Bear market. Support breakdownBINANCE:ADAUSDT.P is in the distribution phase after exiting consolidation. The coin continues to update local lows within a downtrend.
Technically, the cryptocurrency market is in stagnation/correction, as there is no bullish driver yet. Bitcoin is currently consolidating but continues to shoot local downward impulses, which generally has a negative impact on coins.
ADA is entering a distribution phase of accumulation formed in the range of 0.62 - 0.71. If the bears keep the price below 0.62-0.6, ADA may well test the intermediate bottom of 0.5364-0.51
Resistance levels: 0.61, 0.62
Support levels: 0.5993, 0.5364
Focus on 0.61 and the local level of 0.5993. Price consolidation below this zone could confirm the bearish nature of the market, which could lead to another decline.
Best regards, R. Linda!

Pullback in GE AerospaceGE Aerospace has been rallying, and now it’s pulled back.
The first pattern on today’s chart is the steady advance in April and May that established GE at its highest levels since 2001. Is an accumulation phase underway?
Second is the May 23 close of $232.79. The industrial stock tested and held it yesterday after lingering above it all last week. That could mean new support is in place.
The pullback also represented approximately a 50 percent retracement of the move following the breakout.
Next, stochastics are turning up from an oversold condition.
Finally, the 8-day exponential moving average (EMA) has stayed above the 21-day EMA. That may reflect a bullish trend.
Check out TradingView's The Leap competition sponsored by TradeStation.
TradeStation has, for decades, advanced the trading industry, providing access to stocks, options and futures. If you're born to trade, we could be for you. See our Overview for more.
Past performance, whether actual or indicated by historical tests of strategies, is no guarantee of future performance or success. There is a possibility that you may sustain a loss equal to or greater than your entire investment regardless of which asset class you trade (equities, options or futures); therefore, you should not invest or risk money that you cannot afford to lose. Online trading is not suitable for all investors. View the document titled Characteristics and Risks of Standardized Options at www.TradeStation.com . Before trading any asset class, customers must read the relevant risk disclosure statements on www.TradeStation.com . System access and trade placement and execution may be delayed or fail due to market volatility and volume, quote delays, system and software errors, Internet traffic, outages and other factors.
Securities and futures trading is offered to self-directed customers by TradeStation Securities, Inc., a broker-dealer registered with the Securities and Exchange Commission and a futures commission merchant licensed with the Commodity Futures Trading Commission). TradeStation Securities is a member of the Financial Industry Regulatory Authority, the National Futures Association, and a number of exchanges.
TradeStation Securities, Inc. and TradeStation Technologies, Inc. are each wholly owned subsidiaries of TradeStation Group, Inc., both operating, and providing products and services, under the TradeStation brand and trademark. When applying for, or purchasing, accounts, subscriptions, products and services, it is important that you know which company you will be dealing with. Visit www.TradeStation.com for further important information explaining what this means.

Divergence FormingThe descending channel pattern is always my favorite. Mixed with RSI, channels aligning with gaps and volatility being at $20, its a good chemical mix.
AMEX:SOXS to $10 can happen quickly but I think the move will be sharp and quick. Long term bearish signals forming to.
Lets see where it goes!

NIFTYNifty levels are based on imbalances
1. gapup 25150 long
2. 25150-24950 trade breakout
3. gapdown 24950 short
The rebound is weak, is it expected to continue to decline? 📰 Impact of news:
1. Geopolitical situation
2. Pay attention to the impact of short-term trends of the US dollar and silver on gold
📈 Market analysis:
The weekly level large range sweep is still going on, with a focus on the space defense dividing line area of the 10-day moving average and the 3315-3310 area. After falling back to the lifeline in four hours, it continued to bend downward under pressure. During the sweeping decline, the suppression became more obvious. Whether there will be a wave of large-volume market, the pattern is expected to further open and guide the direction. In this process, note that the lifeline 3375 is also the resistance point determined by the last rebound last night. Use this as suppression to sweep the range below. On the whole, for the future gold, if it can maintain the rhythm of defending highs and breaking lows, and successfully closes at a low level today, then next week it is expected to further switch downwards to sweep space. Therefore, we will continue to focus on two support areas, one is 3345-3335, and the other is 3315-3310 after breaking
🏅 Trading strategies:
BUY 3345-3335
TP 3355-3365
SELL 3365-3375
TP 3345-3335-3315
If you agree with this view, or have a better idea, please leave a message in the comment area. I look forward to hearing different voices.
TVC:GOLD FXOPEN:XAUUSD FOREXCOM:XAUUSD FX:XAUUSD OANDA:XAUUSD

EUR/USD at resistanceAs you can see this trend line on the weekly goes back quite a ways, it was supported by and now has become resistance. Unless it closes above on the weekly timeframe, this area is a good short zone

DeGRAM | GOLD descending wedge📊 Technical Analysis
● Price is compressing in a descending wedge at the channel floor (3 343-3 350). Repeated long-tailed rejections hint at seller exhaustion while RSI makes higher lows, flagging hidden strength.
● A 30 min close above the wedge roof (≈ 3 357) should trigger a measured move to the intra-channel resistance band at 3 371, then the prior pivot at 3 383.
💡 Fundamental Analysis
● Thursday’s softer US Philly Fed index and a slip in 2-yr real yields cooled the dollar, reviving bullion bids; meanwhile Chinese customs data show May gold imports up 18 % m/m, underscoring physical demand.
✨ Summary
Buy 3 345-3 355; wedge breakout >3 357 targets 3 371 ➜ 3 383. Long view void on a 30 min close below 3 335.
-------------------
Share your opinion in the comments and support the idea with a like. Thanks for your support!

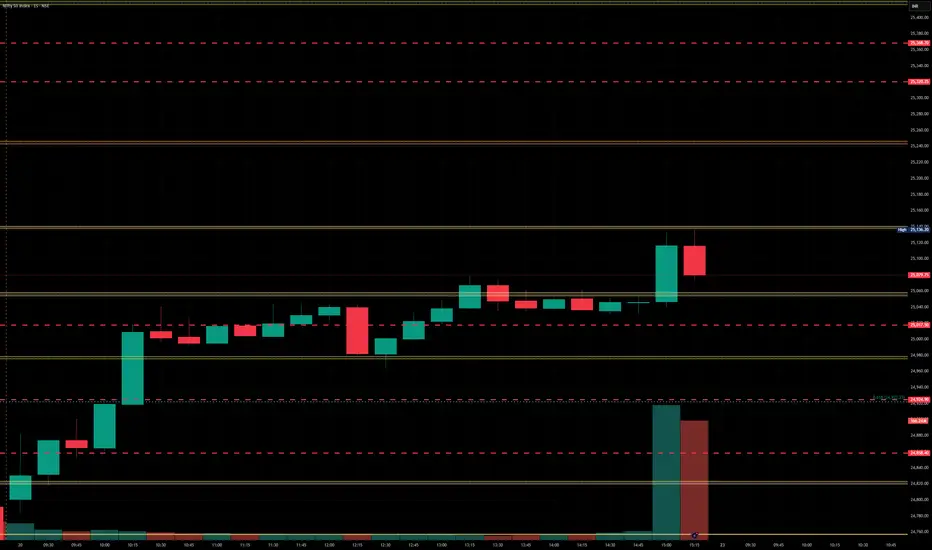
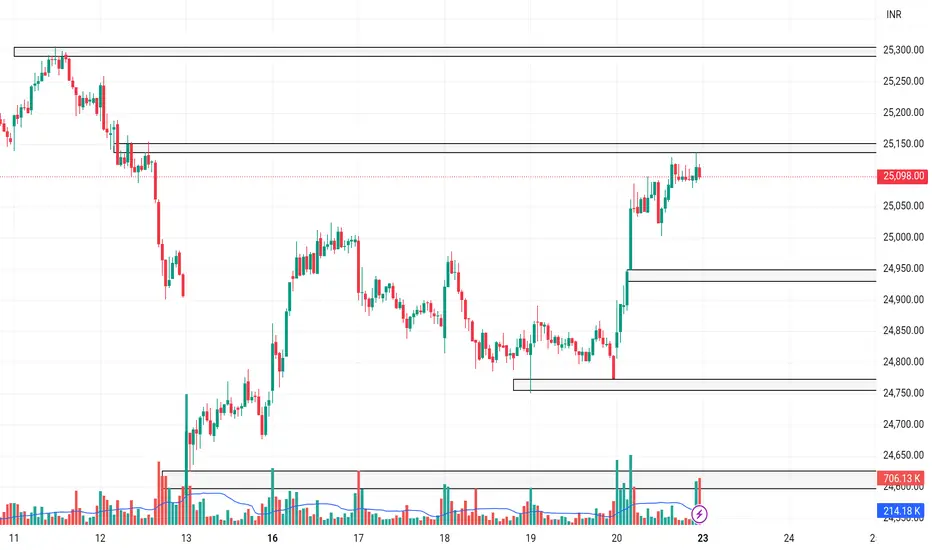
Nifty Analysis EOD – June 20, 2025 – Friday🟢 Nifty Analysis EOD – June 20, 2025 – Friday 🔴
🚀 Bull Run Out of the Blue 🚀 – A Masterclass in Price Action
Nifty kicked off the session with a +56-point gap-up — surprising many, especially since Gift Nifty hinted flat to negative and yesterday’s close was weak. The real jolt came when, in the very first minute, price broke above the Previous Day High (PDH) and opened directly above the CPR zone — a rare occurrence when geopolitical tensions are peaking.
As I often say:
📌 “Market rarely follows the obvious. It thrives in the unexpected.”
Today was a textbook example of that.
Luckily, we were prepped. In yesterday’s note, I mentioned the bullish trigger above 24,862 — and right from the open, Nifty respected every level, offering "hope-on" and "hope-off" trades. What seemed like a 25K test turned into a blast to 25,136, with 100 points added in the last 30 minutes, leaving even seasoned traders awestruck.
The intraday close at 25,079.75 and the adjusted close at 25,112.40 — both above the 15th May closing levels — give a bullish vibe heading into the weekend. 🤞
💬 Personal Note:
Today was special — I sat with my elder daughter, helping her understand real-time market behavior. And what a day it was! From trend reversals, cup & handle, head & shoulders, wedges, shallow pullbacks, to aggressive one-way rallies — everything aligned perfectly to make this a live-action lesson in intraday trading.
🕯 5 Min Time Frame Chart with Levels
🕯 Daily Time Frame Chart
🕯 Daily Candle Breakdown
Open: 24,787.65
High: 25,136.20
Low: 24,783.65
Close: 25,112.40
Change: +319.15 (+1.29%)
📊 Candle Structure Breakdown
Real Body: 324.75 pts → ✅ Strong Green Candle
Upper Wick: 23.80 pts
Lower Wick: 4.00 pts
🔍 Interpretation
Opened flat and never looked back.
Minimal wicks = clear directional strength.
Buyers in full control from open to close.
🕯 Candle Type
📈 Bullish Marubozu-like — One of the strongest bullish signals. A powerful sign of trend continuation or breakout momentum.
📌 Key Insight
Today’s candle reinforces bullish strength.
Holding above 25,100 is key going forward.
A move above 25,136 could invite fresh upside targets — possibly 25,180+ and beyond.
🛡 5 Min Intraday Chart
⚔️ Gladiator Strategy Update
ATR: 251.32
IB Range: 116.6 → Medium IB
Market Structure: 📈 ImBalanced
Trades Triggered:
🔹 9:41 AM – Long Trade → Target Achieved (Trailing Exit, R:R 1:4.79)
🔹 12:18 PM – Short Contra Trade → Target Achieved (R:R 1:2)
🔹 1:07 PM – Long Trade → Target Achieved (Trailing Exit, R:R 1:2.62)
📌 Support & Resistance Zones
Resistance Levels
25,125 ~ 25,150
25,180 ~ 25,212
25,285
Support Levels
25,080 ~ 25,060
25,000 ~ 24,980
24,965
24,894 ~ 24,882
💭 Final Thoughts
The market surprised today — not just in movement but in clarity.The clean break, follow-through strength, and intraday structure hint at momentum continuation — but weekends can bring surprise news.
📌 Watch 25,100 as line in the sand on Monday.
🧠 “Markets are teachers. Today’s lesson? Expect the unexpected, but prepare like it’s already here.”
✏️ Disclaimer
This is just my personal viewpoint. Always consult your financial advisor before taking any action.

DeGRAM | ADAUSD above the demand zone📊 Technical Analysis
● ADA is testing the confluence of the long-term support line and the 0.54-0.63 demand zone; every prior touch of this area sparked a 20-30 % rebound.
● A falling wedge within the broader descending channel is close to completion; a 16 h close above the wedge roof (~0.66) activates a measured move to the first horizontal resistance at 0.73 and the channel cap near 0.86.
💡 Fundamental Analysis
● The upcoming Chang hard-fork, which introduces on-chain governance and boosts staking utility, is scheduled for main-net in Q3 2025, lifting on-chain activity and TVL.
✨ Summary
Long 0.58-0.63; wedge breakout >0.66 targets 0.73 ➜ 0.86. Bull bias void on a 16 h close below 0.54.
-------------------
Share your opinion in the comments and support the idea with a like. Thanks for your support

RangesReturning to range low form here is normal price action. Breakout to one side, breakout to the other, before the real breakout happens — most likely in the direction of the bigger trend, which is up.
