SHORT ON AUD/JPYAUD/JPY has made a pullback to a major supply area while also mitigating a FVG (fair value gap) in the same zone.
Jpyx index has major potential to rise. I expect AJ to fall and from this zone.
Looking to make 200-300 pips throughout the week.
Support and Resistance

S&P 500 (ES1!): Bullish! Wait For Valid Buy Setups!Welcome back to the Weekly Forex Forecast for the week of Oct. 27 - 31st.
In this video, we will analyze the following FX market: S&P 500 (ES1!)
The S&P500 closed last week at ATHs. I expect more of the same next week.
Look for valid dip buying opportunities, my friends.
If the market disrespects the +OB, then buys become invalidated.
Enjoy!
May profits be upon you.
Leave any questions or comments in the comment section.
I appreciate any feedback from my viewers!
Like and/or subscribe if you want more accurate analysis.
Thank you so much!
Disclaimer:
I do not provide personal investment advice and I am not a qualified licensed investment advisor.
All information found here, including any ideas, opinions, views, predictions, forecasts, commentaries, suggestions, expressed or implied herein, are for informational, entertainment or educational purposes only and should not be construed as personal investment advice. While the information provided is believed to be accurate, it may include errors or inaccuracies.
I will not and cannot be held liable for any actions you take as a result of anything you read here.
Conduct your own due diligence, or consult a licensed financial advisor or broker before making any and all investment decisions. Any investments, trades, speculations, or decisions made on the basis of any information found on this channel, expressed or implied herein, are committed at your own risk, financial or otherwise.

SILVER LIKELY TO GO HIGHER|LONG|
✅SILVER is currently trading within a bullish dealing range between the demand and supply areas. After engineering liquidity beneath internal equal lows, strong displacement confirms bullish order flow. Expect continuation toward external liquidity above 50.50$. Time Frame 4H.
LONG🚀
✅Like and subscribe to never miss a new idea!✅

NASDAQ 100 (NQ1!): Bullish! Buy The Dips!Welcome back to the Weekly Forex Forecast for the week of Oct. 27 - 31st.
In this video, we will analyze the following FX market: NASDAQ (NQ1!) NAS100
The NASDAQ closed last week at ATHs. I expect more of the same next week.
Look for valid dip buying opportunities, my friends.
If the market disrespects the +OB, then buys become invalidated.
Enjoy!
May profits be upon you.
Leave any questions or comments in the comment section.
I appreciate any feedback from my viewers!
Like and/or subscribe if you want more accurate analysis.
Thank you so much!
Disclaimer:
I do not provide personal investment advice and I am not a qualified licensed investment advisor.
All information found here, including any ideas, opinions, views, predictions, forecasts, commentaries, suggestions, expressed or implied herein, are for informational, entertainment or educational purposes only and should not be construed as personal investment advice. While the information provided is believed to be accurate, it may include errors or inaccuracies.
I will not and cannot be held liable for any actions you take as a result of anything you read here.
Conduct your own due diligence, or consult a licensed financial advisor or broker before making any and all investment decisions. Any investments, trades, speculations, or decisions made on the basis of any information found on this channel, expressed or implied herein, are committed at your own risk, financial or otherwise.

MRVL: watching for bottom formation in coming monthsPrice continues to act in line with the trend structure outlined in the October update, starting a pullback after reaching the mid-term resistance zone and now reacting from the first level of support.
While a final push lower toward the 50-day MA remains possible in the near term, I’ll be watching for bottoming signs and the formation of a new base over the coming weeks and months.
Chart:
Previously:
• On downside potential (Aug 11):
Chart:
www.tradingview.com
• On support (Aug 25):
Chart:
www.tradingview.com
• On resistance zone (Oct 2):
Chart:
www.tradingview.com
• On pullback potential (Oct 10):
Chart:
See weekly review:

GOLD Strong Bullish Bias! Buy!
Hello,Traders!
GOLD has made a strong correction last week but found a liquidity pool at the lower levels, and we are seeing a local accumulation phase. Then a bullish breakout is likely with the price moving towards the higher liquidity levels again following a strong uptrend!
Buy!
Comment and subscribe to help us grow!
Check out other forecasts below too!
Disclosure: I am part of Trade Nation's Influencer program and receive a monthly fee for using their TradingView charts in my analysis.

GBP/USD Analysis (4H Chart)Last week’s bearish signal played out perfectly, and price continues to respect our structure. We’ve entered additional sell positions on the second entry as momentum builds to the downside.
📉 Bias: Bearish
🔹 Price respecting trendline and supply zone
🔹 Lower highs forming, confirming continuation
🎯 Targets: 1.3248 → 1.3190 → 1.3100
Patience is key — waiting for the market to reach our zones and confirm the setup pays off.

AUDCHF CLOSING THE GAP|SHORT|
✅AUDCHF After engineering liquidity below the previous low, price is now retracing into the imbalance created during the impulsive move up. The market is likely to close the fair value gap and resume bearish order flow. Time Frame 4H.
SHORT🔥
✅Like and subscribe to never miss a new idea!✅

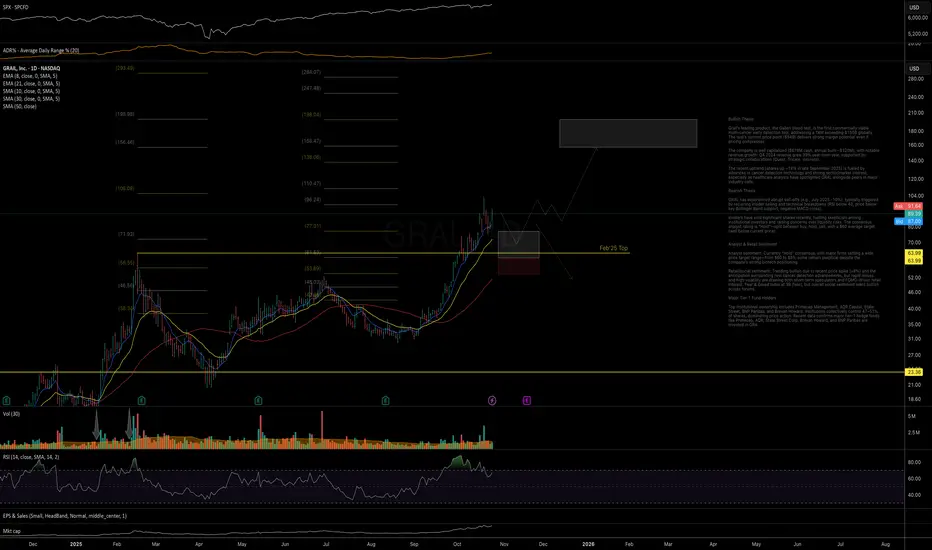
GRAL: strong linearity and decent upside potential strong linear trend structure with price reaching key mid-term resistance, where a new base formation or extended consolidation may be expected.
If the current pullback remains contained within the 77–60 support zone (after one potential leg down), it could complete the corrective phase and set the stage for a higher low formation, opening room for the next upleg toward 155–200 mid-term resistance.
Alternatively, a breakdown below 60 would raise the odds for a transition into a diagonal structure, implying a deeper and longer pullback into the 55–45 area before any new attempt to resume the uptrend.
Chart:
Bitcoin broke the falling trendline and now Pump ahead As observed on the chart, the price is currently testing a major daily support zone. Furthermore, the area below $108K is considered one of the most favorable accumulation zones for institutional investors ("whales"). Concurrently, as evident on lower timeframes, the price has executed a decisive breakout above the prevailing falling trendline. This technical development suggests the asset is primed for a potential upward move, initially targeting the $120K resistance zone, with a confirmed base forming between the $109K-$110K support region.
DISCLAIMER: ((trade based on your own decision))
<<press like👍 if you enjoy💚

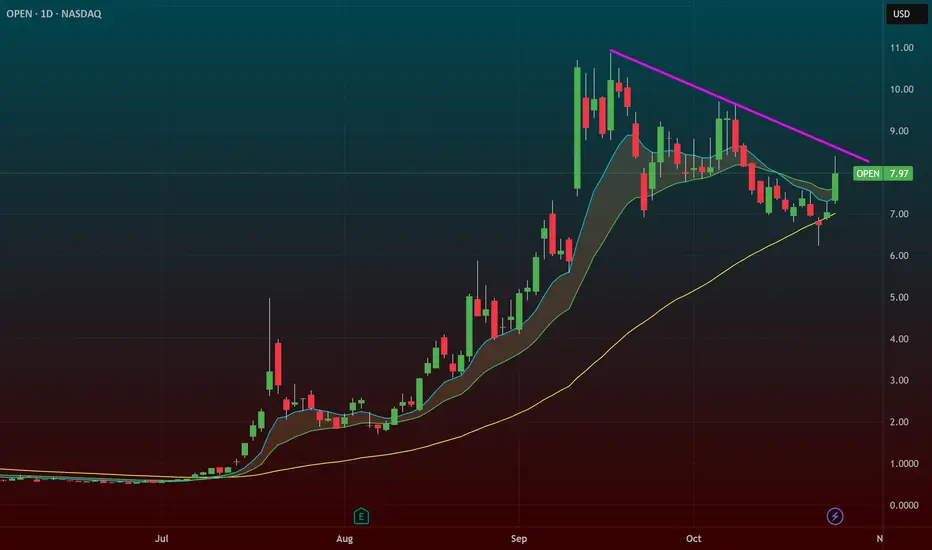
$OPEN – 50 SMA Retest with Trendline Breakout TriggerOpendoor Technologies ( NASDAQ:OPEN ) is setting up for a trendline breakout right as it tests the 50 SMA — a perfect technical spot for dip buyers to step in after a massive run.
🔹 The Setup:
After a strong multi-month rally, NASDAQ:OPEN finally pulled back into the 50 SMA, the first real test of trend support in this cycle.
Price is coiling just under a descending trendline, with an $8.50 trigger marking the breakout zone.
The consolidation is clean, volume is light, and momentum could reload quickly if the market stays hot.
🔹 Market Context:
The broader market is at all-time highs, and NASDAQ:OPEN has been one of the biggest winners in that run.
This pullback looks natural and healthy, not distributional.
Often, the first touch of the 50 SMA after a big run is where institutional buyers step back in.
🔹 My Trade Plan:
1️⃣ Entry: Watching for a breakout through $8.50 with volume confirmation.
2️⃣ Add: On strength above that level or retest of the breakout zone.
3️⃣ Stop: Below the 50 SMA — tight, well-defined risk.
Why I Like This Setup:
Trendline break + 50 SMA retest = classic continuation setup.
Big winner resting while the market is strong = ideal timing for a reload.
Risk is clean, structure is tight, and breakout potential is strong.
ETH soon will get the ticket of moonThe market structure for Ethereum has turned decidedly bullish following its decisive breakout above the key $4,400 level, which coincided with a major descending trendline resistance. A confirmed and sustained move above this level typically validates the strength of the breakout. This technical development suggests a high probability of a significant upward impulse, with initial projected targets residing in the $5,000 to $7,000 range.
DISCLAIMER: ((trade based on your own decision))
<<press like👍 if you enjoy💚

AUDCAD SELL OR BUY SIGNAL???The technical picture for AUDCAD is clear. The price is currently being rejected from the upper boundary of its consolidation range, with the key resistance level at 0.9144. Our trading thesis is as follows:
Bearish Scenario: A confirmed breakdown and close below the 0.9144 support-turned-resistance level would validate the ongoing selling pressure. This would be our signal to initiate a short position, anticipating a move down towards the lower end of the range.
Bullish Scenario: Conversely, a decisive breakout and sustained move above the 0.9177 resistance level would indicate a breach of the consolidation structure. This would invalidate the bearish outlook and serve as our signal to enter a long position, targeting the next significant resistance level above the range.
DISCLAIMER: ((trade based on your own decision))
<<press like👍 if you enjoy💚

EUR-GBP Risky Long! Buy!
Hello,Traders!
EURGBP tapped into a demand level after clearing sell-side liquidity. The market structure shows a clean displacement to the upside, signaling bullish order flow as price seeks to rebalance inefficiency above. Time Frame 3H.
Buy!
Comment and subscribe to help us grow!
Check out other forecasts below too!
Disclosure: I am part of Trade Nation's Influencer program and receive a monthly fee for using their TradingView charts in my analysis.

ZECUSDT may dump and test 200$ before hitting 400$As the chart illustrates, the asset has experienced a significant bullish impulse over recent trading sessions, advancing strongly into a technically overbought territory near a perceived market top. While this suggests a potential exhaustion point, the underlying bullish momentum remains a dominant factor that cannot be disregarded. The possibility of a final parabolic move or a continuation pattern forming should be integrated into any comprehensive analysis.
In the immediate term, a technical pullback toward the key support zone at $200 appears to be a probable scenario. This would represent a healthy correction within a broader uptrend, allowing the market to consolidate its recent gains.
The market's subsequent trajectory will be critically determined by the price action at this $200 level:
Scenario 1 (Bullish Continuation) : A successful defense of the $200 support, followed by a strong bullish reversal candle, would reaffirm underlying demand. This would establish a new higher low and could project a further advance toward the next significant resistance target in the $400 range.
Scenario 2 (Trend Reversal) : Conversely, a decisive breakdown and sustained close below the $200 support level would constitute a significant bearish signal. Such a move would likely invalidate the near-term bullish structure, suggesting a potential completion of the bull run and exposing the asset to a more profound corrective decline.
DISCLAIMER: ((trade based on your own decision))
<<press like👍 if you enjoy💚

$IREN – First 20 SMA Retest + Flag Breakout SetupIris Energy ( NASDAQ:IREN ) is setting up a powerful flag breakout after its first real pullback of this entire move — and it’s happening right as crypto momentum heats up again.
🔹 The Setup:
After a strong rally from $50 → $75, NASDAQ:IREN pulled back in a controlled, low-volume correction.
Price undercut the 20 SMA, quickly reclaimed it, and now sits back above the 9 EMA — a perfect base reset.
Tight flag pattern forming, primed for expansion once momentum kicks in.
🔹 Crypto Sector Strength:
CRYPTOCAP:BTC and CRYPTOCAP:ETH both popped this weekend — that’s classic risk-on behavior.
The entire crypto stock basket is running hot, with leaders like NASDAQ:CIFR and NASDAQ:IREN showing clean technical setups.
This is the first 20 SMA test of the move — historically the most powerful retest in trending names, as late buyers finally get their chance to enter.
🔹 My Trade Plan:
1️⃣ Entry Zone: Watching dips Monday or Tuesday to build a position near the 9 EMA / 20 SMA zone.
2️⃣ If It Gaps Up: I’ll skip swing entries and just day trade the strength — no chasing.
3️⃣ Stop: Below the 20 SMA — tight, logical risk level.
Why I Like This Setup:
First 20 SMA test after a big run = high probability continuation.
Crypto momentum is back — strong sector correlation.
Technical structure is perfect: shallow pullback, rising EMAs, and a clear trigger.

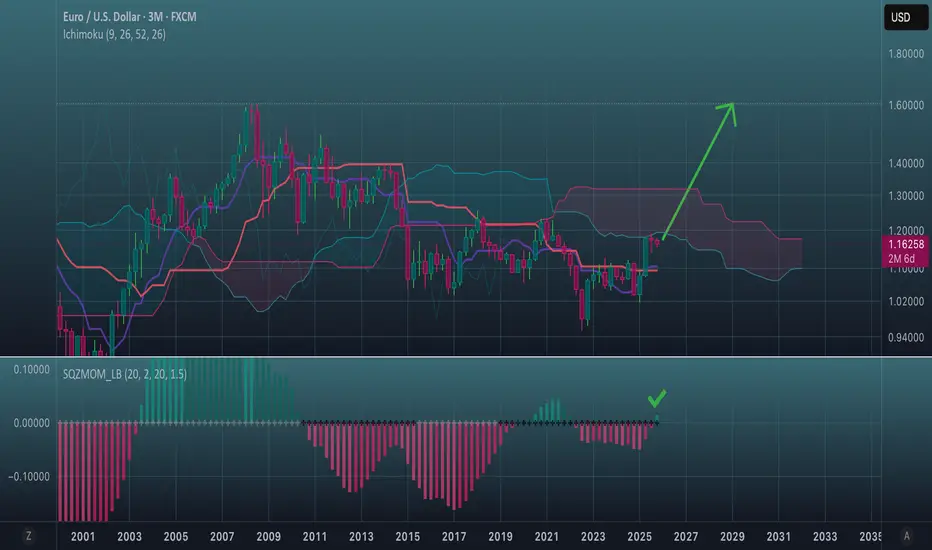
It's a pretty recognizable structure. The assault on the historic peak of $1.60 begins.
Given the monetary situation in the US, this seems logical.
The candles will enter the red cloud and begin to break through this resistance.
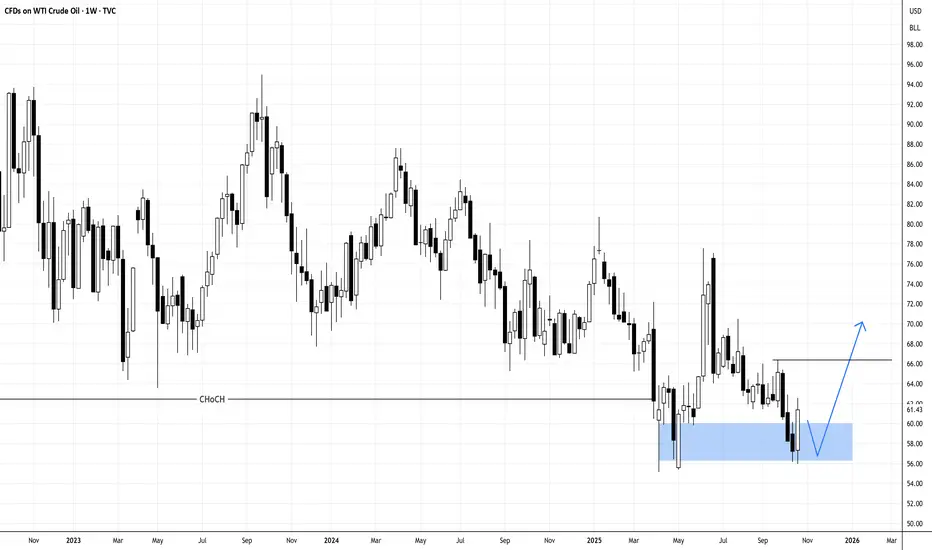
USOIL IN DOUBLE BOTTOM, MAYBE TARGETING ABOVE 66Oil may have found temporary bottom with the weekly double bottom.
N.B!
- USOIL price might not follow the drawn lines . Actual price movements may likely differ from the forecast.
- Let emotions and sentiments work for you
- ALWAYS Use Proper Risk Management In Your Trades
#usoil
#ukoil
US 30 UpdateNext move on the way, focus on proper risk management & stay discipline. Wishing you successful trades..!
Key Reason:
1. Market structure was bullish.
2. H1 support area fresh and unmitigated.
3. Hidden OB formation.
4. Wait for retracement and confirmation.
This is not a financial advise take it with your own risk. Let's see how it will work.

BTCUSDT TradeI when trading in IG:BITCOIN try come to breakeven in big candle for again entry buy or sell.
But you need fix target or trailing stop on new swing in profit.
Please have risk management.

BTC WEEKLY OUTLOOK 4HR SETUP 📍 BTC Weekly Outlook | Bill Williams x ICT x Fractals
This week, I’m maintaining a bullish bias on BTC as price action continues to respect key SMC and Bill Williams confluences.
✅ Why I’m Leaning Long
🔹 Fractal Shift + Market Structure Break
We had a bullish fractal confirmation aligning with a BOS on the 4H — signaling a directional shift to the upside.
🔹 ICT Fair Value Gaps (FVG) + Order Blocks
Price recently tapped into the 4H Bullish Order Block and rebalanced through the FVG. As long as we hold above this zone, I expect continuation.
🔹 Bill Williams Alligator Alignment
The Alligator EMAs have opened to the upside — showing trend awakening after accumulation. Green above Red & Blue supports bullish momentum.
🧠 Key Levels to Watch
📍 Immediate Support (Re-test Zone):
• ~111,100 – 111,700 → 4H OB + FVG alignment
This is my ideal retracement zone for continuation longs.
📍 Deeper Discount (High-Probability Entry):
• ~108,150 → 4H OB
If the market gives a deeper pullback, this level is where I expect strong demand.
🎯 Weekly Outlook Expectation
My expectation for the week:
• Possible short-term retracement into discount → accumulation → expansion to the upside
• Premium levels above current price remain unmitigated and attractive for liquidity draw.
📊 Bullish Roadmap
Pullback into the 4H OB / FVG
Confirm fractal + BOS on lower timeframes
Ride expansion towards weekly liquidity targets

Kaynes Technologies IndiaTrend Line:
The price has respected a long-term ascending trendline, confirming a strong bullish momentum over previous months.
The recent correction is approaching this trendline again — a typical area for potential bounce/reversal.
Break of Structure (BOS):
A BOS was noted after price created a new higher high, confirming continuation of the bullish structure.
Now, price is retracing to mitigate previous imbalances (FVG) — a healthy sign in an uptrend.
Fair Value Gap (FVG) in Discount Zone:
The FVG zone (around ₹6,400–₹6,600) aligns with the discount zone (below 50% of the previous impulse leg), making it an ideal buy zone for swing traders.
Expect liquidity grab or consolidation around this area before next leg up.
Resistance & Target Levels:
Immediate Resistance: ₹6,834.50 (needs breakout confirmation).
Next Major Resistance / Target: ₹7,832.75 (previous swing high).
Beyond that, price could aim for new all-time highs if momentum continues.
Possible Scenarios:
Bullish Case:
Price retests FVG and bullish trendline → forms reversal candle → breaks above ₹6,834 → potential rally towards ₹7,800+.
Bearish Case:
If price breaks and closes below ₹6,400 (trendline + FVG invalidation) → deeper retracement toward ₹6,000–₹5,800 zone.
⚙️ Trading Plan (for analysis purpose only)
Direction Entry Zone Stop-Loss Target 1 Target 2 Bias
Long ₹6,450–₹6,650 ₹6,300 ₹7,000 ₹7,800 Bullish

SENSEX IntraSwing Levels for 27th Oct 2025🚀 "WEEKLY Levels" mentioned in BOX format.
🌡️Plot Levels Using 3 Min, 5 Min Time frame in your Chart for Better Analysis
L#1: If the candle crossed & stays above the “Buy Gen”, it is treated / considered as Bullish bias.
L#2: Possibility / Probability of REVERSAL near RLB#1 & UBTgt
L#3: If the candle stays above “Sell Gen” but below “Buy Gen”, it is treated / considered as Sidewise. Aggressive Traders can take Long position near “Sell Gen” either retesting or crossed from Below & vice-versa i.e. can take Short position near “Buy Gen” either retesting or crossed downward from Above.
L#4: If the candle crossed & stays below the “Sell Gen”, it is treated / considered a Bearish bias.
L#5: Possibility / Probability of REVERSAL near RLS#1 & USTgt
HZB (Buy side) & HZS (Sell side) => Hurdle Zone,
*** Specialty of “HZB#1, HZB#2 HZS#1 & HZS#2” is Sidewise (behaviour in Nature)
Rest Plotted and Mentioned on Chart
Color code Used:
Green =. Positive bias.
Red =. Negative bias.
RED in Between Green means Trend Finder / Momentum Change
/ CYCLE Change and Vice Versa.
Notice One thing: HOW LEVELS are Working.
Use any Momentum Indicator / Oscillator or as you "USED to" to Take entry.
⚠️ DISCLAIMER:
The information, views, and ideas shared here are purely for educational and informational purposes only. They are not intended as investment advice or a recommendation to buy, sell, or hold any financial instruments. I am not a SEBI-registered financial adviser.
Trading and investing in the stock market involves risk, and you should do your own research and analysis. You are solely responsible for any decisions made based on this research.
"As HARD EARNED MONEY IS YOUR's, So DECISION SHOULD HAVE TO BE YOUR's".
Do comment if Helpful .
In depth Analysis will be added later (If time Permits)
