EURUSD Wave Analysis – 24 October 2025- EURUSD reversed from support zone
- Likely to rise to resistance level 1.1740
EURUSD currency pair recently reversed up from the support area between the strong support level 1.1570 (which has been reversing the price from August), lower daily Bollinger Band and the support trendline of the daily up channel from July.
The upward reversal form this support zone stopped the previous minor correction 2 of the higher order impulse wave (3) from the start of October.
Given the clear daily uptrend and the strong euro sentiment, EURUSD currency pair can be expected to rise to the next resistance level 1.1740 (which stopped the previous impulse wave 1).
Support and Resistance

TRUMP : SIGNALHello friends
According to the growth we had, you can see that the price has fallen to the same level as this channel and the price is well supported. Now that the price is well supported, we can buy in steps in the specified areas with capital and risk management and move with it to the set goals.
*Trade safely with us*

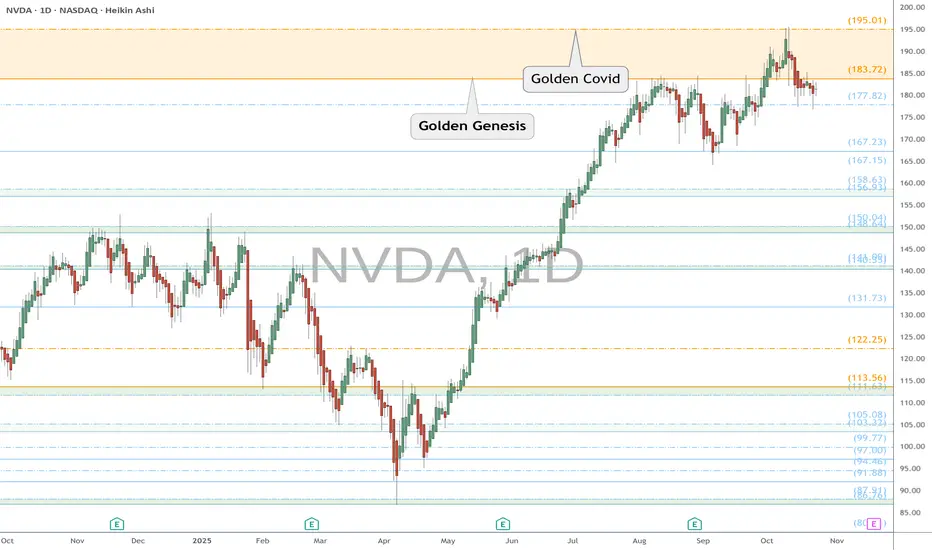
NVDA watch $183-195: Double Golden fib zone trying to TOP itNVDA was flying hard and strong UNTIL recently.
It smacked into DUAL Golden fibs at $183.72 and 195.01
Thus a "high gravity" zone that was likely to capture price.
IF there is to be TOP anywhere near here, then THIS is it.
If NOT, then it will be a key CheckPoint before continuation.
Looking for a few orbits or consolidation within before escape.
.
See "Related Publications" for other Golden Fib reactions.
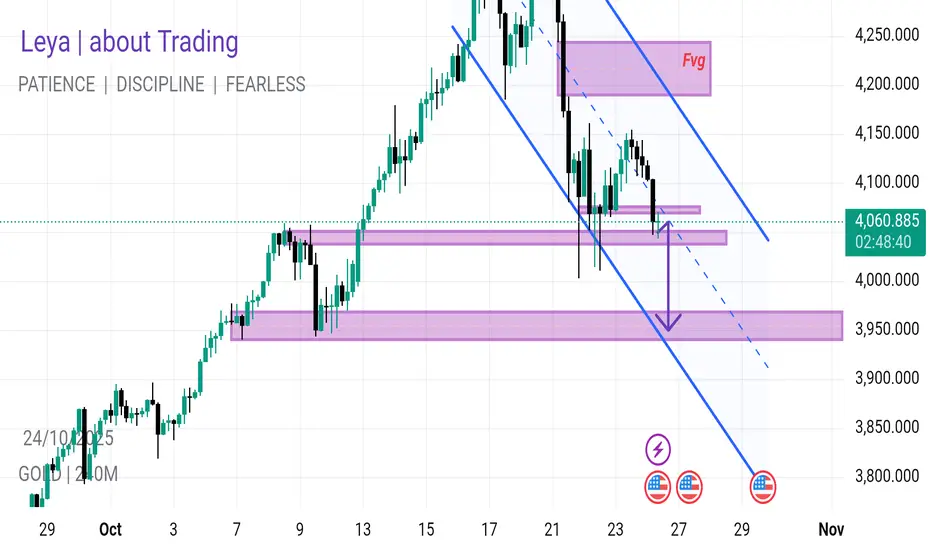
Selling Pressure will result in Change of story by tapping 3950Gold Technical Outlook
The selling pressure in Gold since the London session opened has been extremely strong. This momentum could lead to a mitigation of the major support zone around $3,950 – $3,980.
A downward parallel channel is clearly visible on the chart, providing an additional confluence for bearish momentum.
As long as the 1-hour candle does not close above $4,065 , the bearish bias remains valid.
🔹 Trade Setup (Sell Plan)
Entry Zone : $4,055 – $4,060
Stop Loss : $4,072
Targets : Major support zone at $3,950 – $3,980
🧭 Bias : Strongly Bearish
💡 Watch for any break and close above $4,065 to
HSC+PL+SL GU triple confirmation COMBOGU dropped first half of LDN 24 pips, Resistance line still valid, tested couple of times before though, late entry for a pip :(

Sharing my personal 1H outlook for EURUSD
🧠 What's Happening:
Price has been pulling back from the top near 1.173, and now it’s entering a critical Fibonacci reversal zone.
We’re currently sitting just under the 0.5–0.618 fib zone — my key area for a potential bullish reversal.
📌 Reversal Zone:
🔹 1.1589 (0.5 level)
🔹 1.1566 (0.618 level / Deep Zone start)
I’m watching this zone closely for bullish reaction signs (like structure shift, major breakout).

NBIS eyes on $112.91: proven Golden Genesis to Break or KillNBIS trying to recover from the retreat of high flyers.
Currently testing a proven Golden Genesis fib at $112.91
The whole world is keenly aware of this level so watch closely.
.
See "Related Publications" for other Golden fib reactions, such as META top:
Hit BOOST and FOLLOW for more such PRECISE and TIMELY charts.
=========================================================
.

GOLD | Awaits CPI Data for Next Direction GOLD | Awaits CPI Data for Next Direction
Gold prices are set for a strong move ahead of the U.S. CPI release.
Key Levels
Pivot: 4,053
Resistance: 4,101 · 4,124 · 4,163
Support: 4,011 · 3,985 · 3,945
Trading Plan
🔼 Buy Setup: Longs valid above 4,053, targeting 4,101 / 4,124 / 4,163 — supported if CPI prints below 3.1%.
🔽 Sell Setup: Shorts valid below 4,053, targeting 4,011 / 3,985 / 3,945 — favored if CPI comes above expectations.
📌 Premium Takeaway
Gold is poised for a strong reaction to inflation data.
A softer CPI favors bullish continuation toward 4,124–4,163,
while a hotter CPI could trigger a bearish correction toward 4,011–3,945.

US30 | CPI to Dictate Market DirectionUS30 | Direction Awaits CPI Data
The Dow Jones is set to react strongly to today’s CPI release —
a higher-than-expected reading could trigger bearish momentum,
while a softer print may extend the bullish trend.
Technically:
The index shows bullish potential if it can close a 1H candle above 46,915, targeting 47,090 → 47,230.
However, a 1H close below 46,780 would shift momentum bearish, opening the path toward 46,600 → 46,420.
Pivot Line: 46,850
Resistance: 47,090 – 47,230
Support: 46,600 – 46,420

CADCHF — 1H ChartCADCHF — 1H Chart 📉
Price has formed a Double Top at a key level.
If price returns for a retest, I’ll look to sell toward my take-profit target.
🎯 Sell Target → 0.56745
OANDA:CADCHF

SILVER Local Long! Buy!
Hello,Traders!
SILVER SMC based analysis shows price reacting from the horizontal demand area where liquidity has been swept and bullish order flow may soon resume. Expecting a possible push upward toward the next target level once internal structure confirms a shift. Time Frame 5H.
Buy!
Comment and subscribe to help us grow!
Check out other forecasts below too!
Disclosure: I am part of Trade Nation's Influencer program and receive a monthly fee for using their TradingView charts in my analysis.

GIFTNIFTY at a GLANCE.GIFTNIFTY Overview
GIFT Nifty is a derivatives index based on the Nifty 50 , traded on the NSE International Exchange (NSE IX) within Gujarat International Finance Tec-City (GIFT City ), India’s first International Financial Services Centre (IFSC). It serves as India’s international gateway for equity futures trading, providing foreign investors access to Indian markets with extended trading hours and flexibility.
What is GIFT Nifty
GIFT Nifty replaced SGX Nifty (which was traded on the Singapore Exchange) and began operations from July 3, 2023 . The transition aimed to bring offshore derivative trading back to India under a regulated domestic framework managed by the International Financial Services Centres Authority (IFSCA).
The index tracks the top 50 NSE-listed companies using a free-float market capitalization methodology, mirroring the Nifty 50. It is denominated and traded in US dollars, offering two trading sessions—
• Morning: 6:30 AM to 3:40 PM IST
• Night: 4:35 PM to 2:45 AM IST
This 21-hour structure aligns closely with global markets, improving accessibility for foreign investors.
Purpose and Function:
GIFT Nifty allows global investors to trade in Indian equities without exposure to local currency risk or registration with domestic regulators. It acts as:
• A hedging tool for institutions and large investors managing India-related portfolios.
• A predictive indicator for the Indian market’s opening direction, similar to how SGX Nifty once operated.
• A bridge for cross-border investment flows, contributing to India’s ambition of becoming a global financial hub through GIFT City.
Significance and Recent Performance
GIFT Nifty has rapidly gained volume and global traction. In May 2025, its monthly turnover reached USD 102.35 billion, marking record growth and signaling strong global confidence in India’s financial infrastructure. The platform offers tax incentives, seamless international fund transfer, and advanced trading technology to attract global funds to Indian assets.
Connection to GIFT City
GIFT City, located near Gandhinagar, Gujarat, houses India’s first IFSC and serves as the operational base for GIFT Nifty. The city hosts over 550 global financial entities, including major banks, fintechs, and exchanges. It integrates world-class infrastructure with tax-friendly regulations and aims to make India a major fintech and capital markets hub.
In essence, GIFT Nifty marks India’s evolution into an international financial powerhouse, offering liquidity, innovation, and global participation in India’s equity markets through a domestic but globally integrated platform.
🌡️Plot Levels Using 3 Min, 5 Min Time frame in your Chart for Better Analysis
L#1: If the candle crossed & stays above the “Buy Gen”, it is treated / considered as Bullish bias.
L#2: Possibility / Probability of REVERSAL near RLB#1 & UBTgt
L#3: If the candle stays above “Sell Gen” but below “Buy Gen”, it is treated / considered as Sidewise. Aggressive Traders can take Long position near “Sell Gen” either retesting or crossed from Below & vice-versa i.e. can take Short position near “Buy Gen” either retesting or crossed downward from Above.
L#4: If the candle crossed & stays below the “Sell Gen”, it is treated / considered a Bearish bias.
L#5: Possibility / Probability of REVERSAL near RLS#1 & USTgt
HZB (Buy side) & HZS (Sell side) => Hurdle Zone,
*** Specialty of “HZB#1, HZB#2 HZS#1 & HZS#2” is Sidewise (behaviour in Nature)
Rest Plotted and Mentioned on Chart
Color code Used:
Green =. Positive bias.
Red =. Negative bias.
RED in Between Green means Trend Finder / Momentum Change
/ CYCLE Change and Vice Versa.
Notice One thing: HOW LEVELS are Working.
Use any Momentum Indicator / Oscillator or as you "USED to" to Take entry.
⚠️ DISCLAIMER:
The information, views, and ideas shared here are purely for educational and informational purposes only. They are not intended as investment advice or a recommendation to buy, sell, or hold any financial instruments. I am not a SEBI-registered financial adviser.
Trading and investing in the stock market involves risk, and you should do your own research and analysis. You are solely responsible for any decisions made based on this research.
"As HARD EARNED MONEY IS YOUR's, So DECISION SHOULD HAVE TO BE YOUR's".
Do comment if Helpful .
In depth Analysis will be added later (If time Permits)

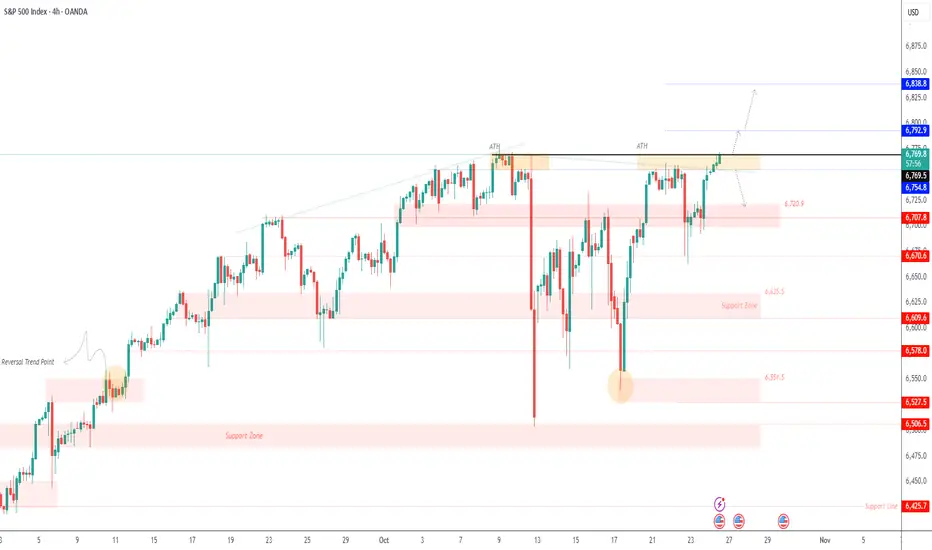
SPX500 | Futures Rise on Intel Boost Ahead of CPI DataSPX500 | Futures Rise on Intel Boost Ahead of CPI Data 📊
Wall Street futures edged higher on Friday, lifted by strong Intel earnings, as investors await a crucial U.S. inflation report (CPI) that could influence the likelihood of a December rate cut.
Technically, the SPX500 maintains a bullish structure, with potential to extend gains toward 6,792 → 6,838, especially if CPI data comes in below or in line with expectations.
However, if inflation prints higher than expected, the index could face bearish pressure toward 6,720 → 6,670.
Pivot Line: 6,770
Resistance: 6,792 – 6,838
Support: 6,720 – 6,670
NZDCAD SHORT Market structure bearish on HTFs 3
Entry at Both Weekly and Daily AOi
Weekly Rejection at AOi
Previous Weekly Structure Point
Daily Rejection at AOi
Daily Previous Structure Point
Around Psychological Level 0.80500
Touching EMA H4
H4 Candlestick rejection
Rejection from Previous structure
Levels
Entry 120%
REMEMBER : Trading is a Game Of Probability
: Manage Your Risk
: Be Patient
: Every Moment Is Unique
: Rinse, Wash, Repeat!
: Christ is King.

EURJPY FREE SIGNAL|SHORT|
✅EURJPY has reached a premium zone near a clear supply level, where smart money could be offloading long positions. Expecting a potential reversal setup as liquidity is engineered above previous highs.
—————————
Entry: 177.57
Stop Loss: 177.80
Take Profit: 177.10
Time Frame: 2H
—————————
SHORT🔥
✅Like and subscribe to never miss a new idea!✅

BANKNIFT (Spot) Intraday & Swing Levels for 27th Oct 2025Today BankNIFTY (Spot) Made LOW @ 57482.05 (Mentioned USTgt @ 57477.65 Difference JUST 4.4 points ) and Covered 259+ points (at Lower Level of "HZS#1")
Can I say Level Works. (Watch Previous Posts as Back testing.)
🚀 "WEEKLY Levels" mentioned in BOX format.
🌡️Plot Levels Using 3 Min, 5 Min Time frame in your Chart for Better Analysis
L#1: If the candle crossed & stays above the “Buy Gen”, it is treated / considered as Bullish bias.
L#2: Possibility / Probability of REVERSAL near RLB#1 & UBTgt
L#3: If the candle stays above “Sell Gen” but below “Buy Gen”, it is treated / considered as Sidewise. Aggressive Traders can take Long position near “Sell Gen” either retesting or crossed from Below & vice-versa i.e. can take Short position near “Buy Gen” either retesting or crossed downward from Above.
L#4: If the candle crossed & stays below the “Sell Gen”, it is treated / considered a Bearish bias.
L#5: Possibility / Probability of REVERSAL near RLS#1 & USTgt
HZB (Buy side) & HZS (Sell side) => Hurdle Zone,
*** Specialty of “HZB#1, HZB#2 HZS#1 & HZS#2” is Sidewise (behaviour in Nature)
Rest Plotted and Mentioned on Chart
Color code Used:
Green =. Positive bias.
Red =. Negative bias.
RED in Between Green means Trend Finder / Momentum Change
/ CYCLE Change and Vice Versa.
Notice One thing: HOW LEVELS are Working.
Use any Momentum Indicator / Oscillator or as you "USED to" to Take entry.
⚠️ DISCLAIMER:
The information, views, and ideas shared here are purely for educational and informational purposes only. They are not intended as investment advice or a recommendation to buy, sell, or hold any financial instruments. I am not a SEBI-registered financial adviser.
Trading and investing in the stock market involves risk, and you should do your own research and analysis. You are solely responsible for any decisions made based on this research.
"As HARD EARNED MONEY IS YOUR's, So DECISION SHOULD HAVE TO BE YOUR's".
Do comment if Helpful .
In depth Analysis will be added later (If time Permits)
