NTAP watch $117.45 above 110.38 below: Dual Goldens for Next LegNTAP in a minor retrace of its recovery wave.
Now between Dual Goldens at $117.45 and 110.38
Looking for a Break-n-Retest of the upper bound.
Support and Resistance

NIFTYNifty levels are based on imbalances
1. gapup 25950 long
2. 25950-25800 trade breakout
3. gapdown 25800 short

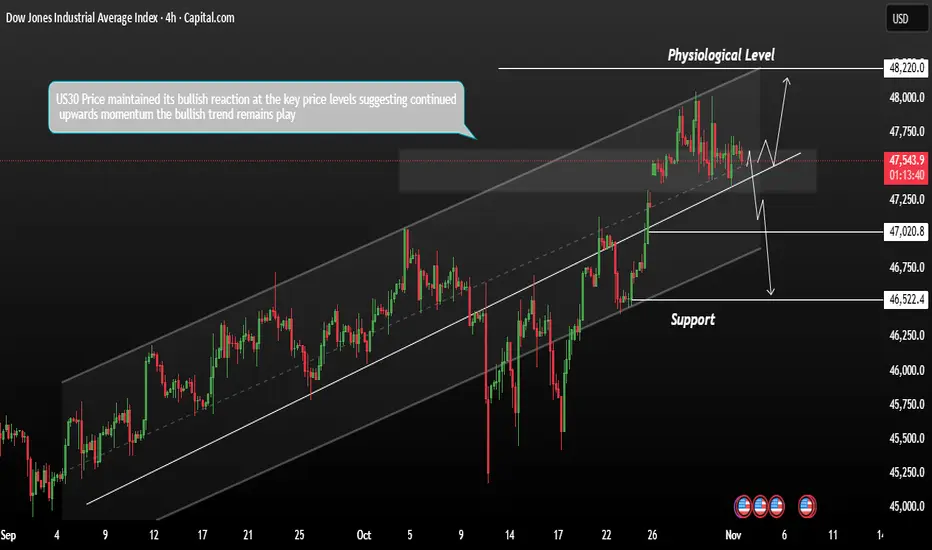
US30 Technical Outlook – Bullish Momentum IntactThe US30 maintained its bullish reaction at key price levels, suggesting continued upward momentum. As November begins, the index futures gained on Monday, supported by optimism around U.S.–China trade relations and stronger demand sentiment.
Currently, the bullish trend remains in play. If price continues to react positively to current support zones, we could see a potential move toward the next major psychological resistance level at 48,220.
However, if price fails to hold above current levels and we see a bearish reaction, a pullback could be triggered toward the support area between 47,030 and 46,520.
You may find more details in the chart.
Trade wisely best of Luck Buddies,
Ps; Support with like and comments for better analysis Thanks for Supporting.
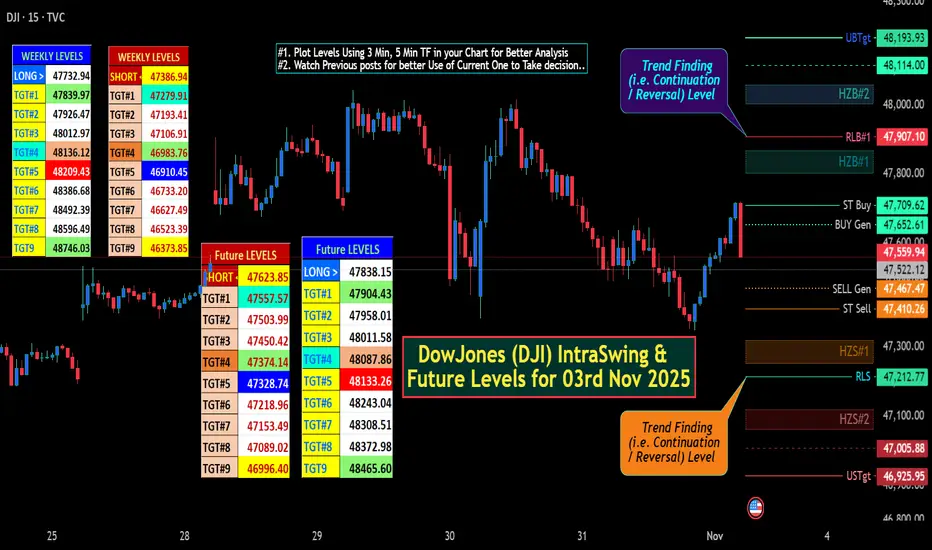
DowJones (DJI) IntraSwing & Future Levels for 03rd Nov 2025✍🏼️ "Future IntraSwing Levels" mentioned in BOX format.
✍🏼️ "WEEKLY Levels" mentioned in BOX format.
L#1: If the candle crossed & stays above the “Buy Gen”, it is treated / considered as Bullish bias.
L#2: Possibility / Probability of REVERSAL near RLB#1 & UBTgt
L#3: If the candle stays above “Sell Gen” but below “Buy Gen”, it is treated / considered as Sidewise. Aggressive Traders can take Long position near “Sell Gen” either retesting or crossed from Below & vice-versa i.e. can take Short position near “Buy Gen” either retesting or crossed downward from Above.
L#4: If the candle crossed & stays below the “Sell Gen”, it is treated / considered a Bearish bias.
L#5: Possibility / Probability of REVERSAL near RLS#1 & USTgt
HZB (Buy side) & HZS (Sell side) => Hurdle Zone,
*** Specialty of “HZB#1, HZB#2 HZS#1 & HZS#2” is Sidewise (behaviour in Nature)
Rest Plotted and Mentioned on Chart
Color code Used:
Green =. Positive bias.
Red =. Negative bias.
RED in Between Green means Trend Finder / Momentum Change
/ CYCLE Change and Vice Versa.
Notice One thing: HOW LEVELS are Working.
Use any Momentum Indicator / Oscillator or as you "USED to" to Take entry.
⚠️ DISCLAIMER:
The information, views, and ideas shared here are purely for educational and informational purposes only. They are not intended as investment advice or a recommendation to buy, sell, or hold any financial instruments. I am not a SEBI-registered financial adviser.
Trading and investing in the stock market involves risk, and you should do your own research and analysis. You are solely responsible for any decisions made based on this research.
"As HARD EARNED MONEY IS YOUR's, So DECISION SHOULD HAVE TO BE YOUR's".
Do comment if Helpful .
In depth Analysis will be added later (If time Permits)
WE ARE SELLING Price is close to our entry, so we are selling at 4014-4020 with sl at 4030 or 4035 you can
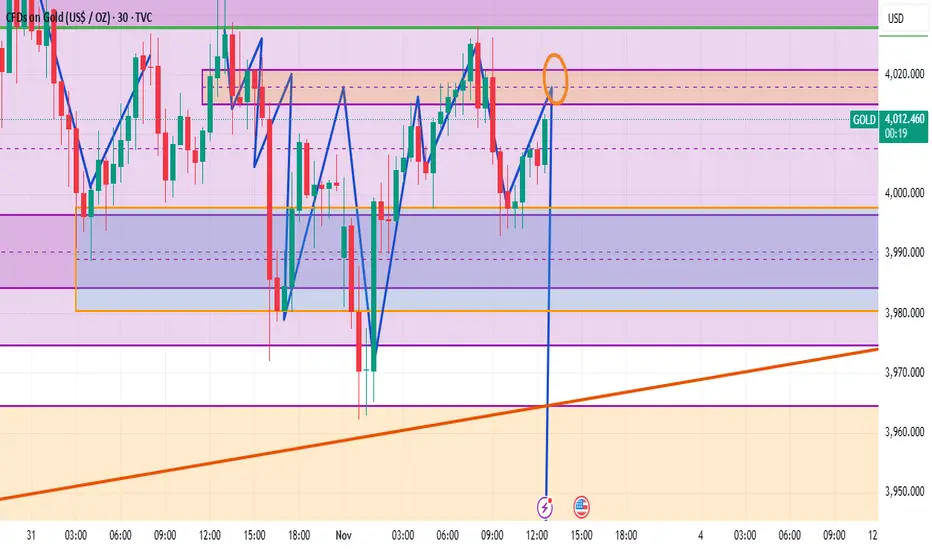
Morning Gold PeopleA few will understand my chart, but im only here to give the big picture and not the day trading ideas.
in my vision this is the path that gold will follow before wiping out some wallets like it happened after it collapsed 2 weeks ago.
trade with coition and low risk, the market today has 0% mercy and take care of your money.
thanks for leaving a like

XAUUSD (ONDA) IntraSwing Levels For 03rd -04th Nov(2.30 pm)2025Level Interpretation:
L#1: If the candle crossed & stays above the “Buy Gen”, it is treated / considered as Bullish bias.
L#2: Possibility / Probability of REVERSAL near RLB#1 & UBTgt
L#3: If the candle stays above “Sell Gen” but below “Buy Gen”, it is treated / considered as Sidewise. Aggressive Traders can take Long position near “Sell Gen” either retesting or crossed from Below & vice-versa i.e. can take Short position near “Buy Gen” either retesting or crossed downward from Above.
L#4: If the candle crossed & stays below the “Sell Gen”, it is treated / considered a Bearish bias.
L#5: Possibility / Probability of REVERSAL near RLS#1 & USTgt
HZB (Buy side) & HZS (Sell side) => Hurdle Zone,
*** Specialty of “HZB#1, HZB#2 HZS#1 & HZS#2” is Sidewise (behaviour in Nature)
Rest Plotted and Mentioned on Chart
Color code Used:
Green =. Positive bias.
Red =. Negative bias.
RED in Between Green means Trend Finder / Momentum Change
/ CYCLE Change and Vice Versa.
Notice One thing: HOW LEVELS are Working.
Use any Momentum Indicator / Oscillator or as you "USED to" to Take entry.
⚠️ DISCLAIMER:
The information, views, and ideas shared here are purely for educational and informational purposes only. They are not intended as investment advice or a recommendation to buy, sell, or hold any financial instruments. I am not a SEBI-registered financial adviser.
Trading and investing in the stock market involves risk, and you should do your own research and analysis. You are solely responsible for any decisions made based on this research.
"As HARD EARNED MONEY IS YOUR's, So DECISION SHOULD HAVE TO BE YOUR's".
Do comment if Helpful .
In depth Analysis will be added later (If time Permits)

BANKNIFTY IntraSwing (Spot) & Future Levels for 04th Nov 2025✍🏼️ "Future IntraSwing Levels" mentioned in BOX format.
✍🏼️ "WEEKLY Levels" follow Sunday / Saturday's Post.
L#1: If the candle crossed & stays above the “Buy Gen”, it is treated / considered as Bullish bias.
L#2: Possibility / Probability of REVERSAL near RLB#1 & UBTgt
L#3: If the candle stays above “Sell Gen” but below “Buy Gen”, it is treated / considered as Sidewise. Aggressive Traders can take Long position near “Sell Gen” either retesting or crossed from Below & vice-versa i.e. can take Short position near “Buy Gen” either retesting or crossed downward from Above.
L#4: If the candle crossed & stays below the “Sell Gen”, it is treated / considered a Bearish bias.
L#5: Possibility / Probability of REVERSAL near RLS#1/ RLS#2 & USTgt
HZB (Buy side) & HZS (Sell side) => Hurdle Zone,
*** Specialty of “HZB#1, HZB#2 HZS#1 & HZS#2” is Sidewise (behaviour in Nature)
Rest Plotted and Mentioned on Chart
Color code Used:
Green =. Positive bias.
Red =. Negative bias.
RED in Between Green means Trend Finder / Momentum Change
/ CYCLE Change and Vice Versa.
Notice One thing: HOW LEVELS are Working.
Use any Momentum Indicator / Oscillator or as you "USED to" to Take entry.
⚠️ DISCLAIMER:
The information, views, and ideas shared here are purely for educational and informational purposes only. They are not intended as investment advice or a recommendation to buy, sell, or hold any financial instruments. I am not a SEBI-registered financial adviser.
Trading and investing in the stock market involves risk, and you should do your own research and analysis. You are solely responsible for any decisions made based on this research.
"As HARD EARNED MONEY IS YOUR's, So DECISION SHOULD HAVE TO BE YOUR's".
Do comment if Helpful .
In depth Analysis will be added later (If time Permits)

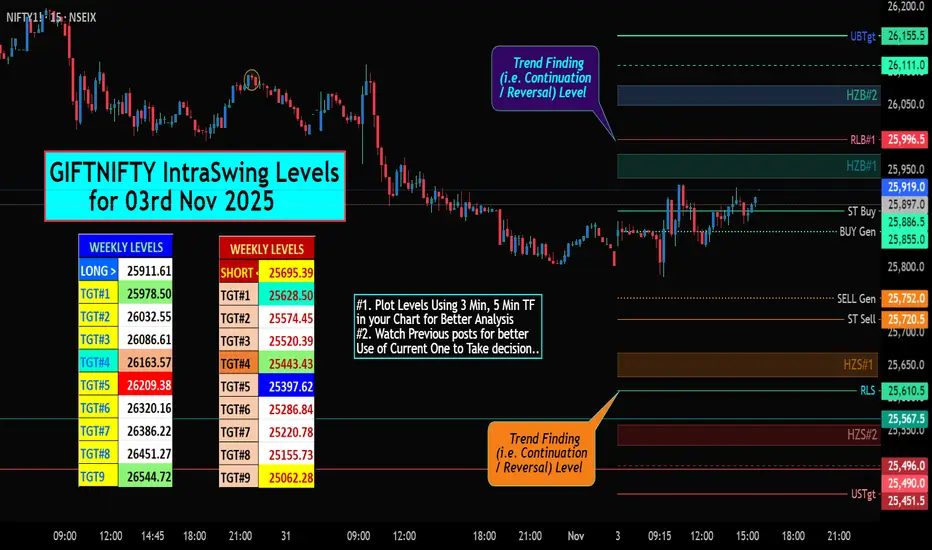
GIFTNIFTY IntraSwing Levels for 03rd Nov 2025✍🏼️ "WEEKLY Levels" mentioned in BOX format.
L#1: If the candle crossed & stays above the “Buy Gen”, it is treated / considered as Bullish bias.
L#2: Possibility / Probability of REVERSAL near RLB#1 & UBTgt
L#3: If the candle stays above “Sell Gen” but below “Buy Gen”, it is treated / considered as Sidewise. Aggressive Traders can take Long position near “Sell Gen” either retesting or crossed from Below & vice-versa i.e. can take Short position near “Buy Gen” either retesting or crossed downward from Above.
L#4: If the candle crossed & stays below the “Sell Gen”, it is treated / considered a Bearish bias.
L#5: Possibility / Probability of REVERSAL near RLS#1 & USTgt
HZB (Buy side) & HZS (Sell side) => Hurdle Zone,
*** Specialty of “HZB#1, HZB#2 HZS#1 & HZS#2” is Sidewise (behaviour in Nature)
Rest Plotted and Mentioned on Chart
Color code Used:
Green =. Positive bias.
Red =. Negative bias.
RED in Between Green means Trend Finder / Momentum Change
/ CYCLE Change and Vice Versa.
Notice One thing: HOW LEVELS are Working.
Use any Momentum Indicator / Oscillator or as you "USED to" to Take entry.
⚠️ DISCLAIMER:
The information, views, and ideas shared here are purely for educational and informational purposes only. They are not intended as investment advice or a recommendation to buy, sell, or hold any financial instruments. I am not a SEBI-registered financial adviser.
Trading and investing in the stock market involves risk, and you should do your own research and analysis. You are solely responsible for any decisions made based on this research.
"As HARD EARNED MONEY IS YOUR's, So DECISION SHOULD HAVE TO BE YOUR's".
Do comment if Helpful .
In depth Analysis will be added later (If time Permits)
HYPEUSDT.P delicious opportunities forming in many alt coinsGETTEX:HYPE delicious opportunities forming in many alt coins!
One of the best ones is HYPE. Upper fib zone of 0.618-0.705 has multiple excellent confluences for pivot reversal as monthly open, SR flip zone formed of multiple weekly open levels and bullish FVGs.
If more downside there is the very premium fib zone below with pink dotted Value Area Low level.

GBPCAD on the Rise.GBPCAD should be rising this week and potentially getting up to the RESISTANCE zone or close to it this month.

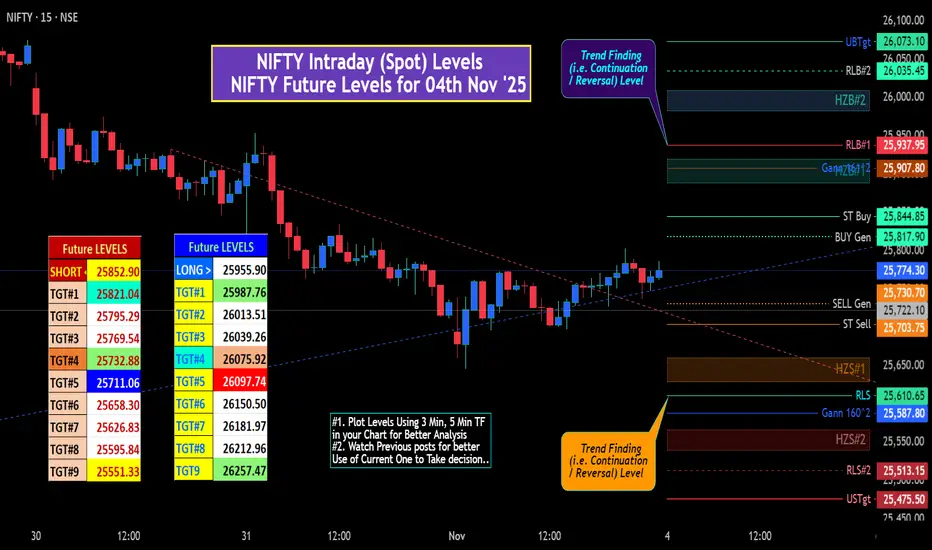
NIFTY IntraSwing (Spot) Future Levels for 04th Nov '25✍🏼️ "Future IntraSwing Levels" mentioned in BOX format.
✍🏼️For "WEEKLY Levels" follow Sunday / Saturday's Post.
L#1: If the candle crossed & stays above the “Buy Gen”, it is treated / considered as Bullish bias.
L#2: Possibility / Probability of REVERSAL near RLB#1 & UBTgt
L#3: If the candle stays above “Sell Gen” but below “Buy Gen”, it is treated / considered as Sidewise. Aggressive Traders can take Long position near “Sell Gen” either retesting or crossed from Below & vice-versa i.e. can take Short position near “Buy Gen” either retesting or crossed downward from Above.
L#4: If the candle crossed & stays below the “Sell Gen”, it is treated / considered a Bearish bias.
L#5: Possibility / Probability of REVERSAL near RLS#1 & USTgt
HZB (Buy side) & HZS (Sell side) => Hurdle Zone,
*** Specialty of “HZB#1, HZB#2 HZS#1 & HZS#2” is Sidewise (behaviour in Nature)
Rest Plotted and Mentioned on Chart
Color code Used:
Green =. Positive bias.
Red =. Negative bias.
RED in Between Green means Trend Finder / Momentum Change
/ CYCLE Change and Vice Versa.
Notice One thing: HOW LEVELS are Working.
Use any Momentum Indicator / Oscillator or as you "USED to" to Take entry.
⚠️ DISCLAIMER:
The information, views, and ideas shared here are purely for educational and informational purposes only. They are not intended as investment advice or a recommendation to buy, sell, or hold any financial instruments. I am not a SEBI-registered financial adviser.
Trading and investing in the stock market involves risk, and you should do your own research and analysis. You are solely responsible for any decisions made based on this research.
"As HARD EARNED MONEY IS YOUR's, So DECISION SHOULD HAVE TO BE YOUR's".
Do comment if Helpful .
In depth Analysis will be added later (If time Permits)
XAUUSD | Buy Setup from FVG or Order BlockXAUUSD is currently trading in a corrective range after a strong bullish move. The overall bias remains bullish, but the current structure shows that liquidity is resting on both sides — above and below the range — making this setup slightly risky and requiring extra confirmation before entry.
🔹 Market Context:
Gold has recently shown strong bullish displacement, but now price is consolidating, forming equal highs and equal lows — a clear indication of liquidity buildup on both ends.
Below the range, we have a clean Fair Value Gap (FVG) and Order Block (OB) that align with potential demand zones, which could trigger a buy-side reaction once tapped.
However, due to liquidity being stacked on both sides, a liquidity sweep can occur in either direction before price picks its true direction.
🔹 Trade Idea & Plan:
1️⃣ Wait for Price to Tap FVG / OB:
Allow price to correct and reach the marked FVG or OB zone.
These zones are areas of interest where institutional orders might react to continue the bullish move.
2️⃣ Look for LTF Confirmation:
After the tap, shift to lower timeframes (e.g., M1–M5) to wait for a strong confirmation such as a CHOCH or BOS.
Confirmation is key here because of the mixed liquidity situation.
3️⃣ Execute Only After Confirmation:
If a valid confirmation forms, plan for a buy entry targeting the next internal or swing high.
If the market shows weakness or fails to confirm, stay patient — no trade is better than a forced one.
4️⃣ Risk Awareness:
Liquidity is sitting both above and below the current range.
The setup can trap early traders, so always wait for confirmation and manage risk tightly.
🔹 Summary:
👉 Overall bias: Bullish
👉 Setup: Buy from FVG or OB after liquidity sweep
👉 Entry: Only after strong LTF confirmation (CHOCH/BOS)
👉 Risk: High, as liquidity lies on both sides — stay cautious and patient
👉 Target: Next swing high or structure point
Trade smart, not fast 💡
No confirmation = No trade 🚫
⚠️ Disclaimer:
This analysis is for educational purposes only and not financial advice . Always confirm with your own analysis and apply strict risk management before trading.

WE ARE SELLING AGAIN Don't rush to sell, price will likely come back to entry and if it doesn't come back, still don't worry we will get another opportunity, i called the initial sell invalid because market gave a signal of further push upward or more buy and it moved from 4014 to 4027, and it could have gone to 4040 to hit sl or even bought more so that's why i called it invalid and i was right , now it has signaled a sell again and I'm saying don't rush because market retrace back to entry 90% of the time and we need another time frame for better confirmation so don't rush no matter what we will get another opportunity,
We sell at 4014-20, sl at 4030 and I will still update

WE ARE SELLING AGAIN We are going to sell again at 4014-4020 with sl at 4030,don't rush price will come and retest at entry

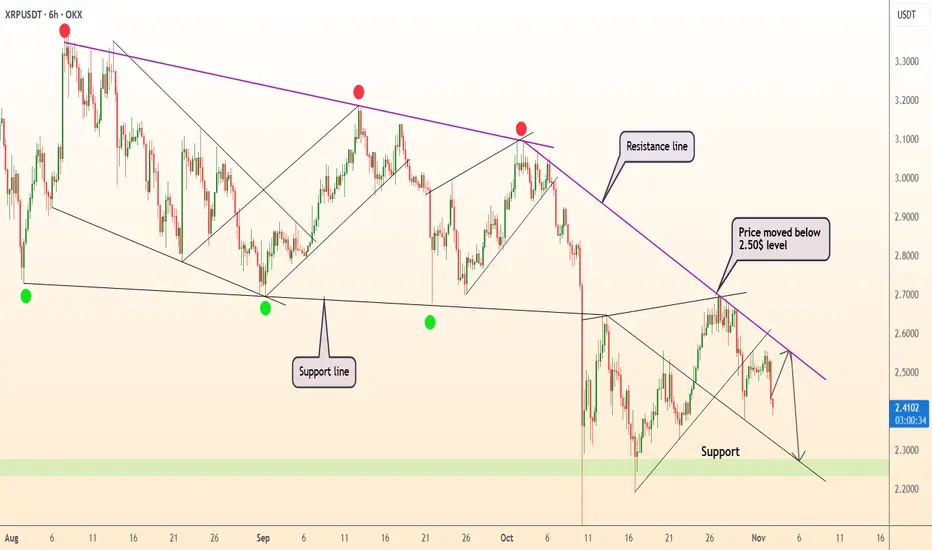
DeGRAM | XRPUSD moved below the $2.5 level📊 Technical Analysis
● XRP/USD continues to move within a descending structure, consistently rejecting from the resistance line near $2.50. The price broke below this level, confirming renewed selling momentum.
● With repeated failures to hold higher lows, the pair targets the next support zone around $2.30–$2.25, aligning with the broader bearish channel formation.
💡 Fundamental Analysis
● Ripple’s price remains under pressure as market liquidity tightens and investor appetite for altcoins declines amid rising U.S. yields.
✨ Summary
● Short bias below $2.50; targets $2.30–$2.25. Technical rejection and weaker sentiment reinforce bearish continuation.
-------------------
Share your opinion in the comments and support the idea with a like. Thanks for your support!
EUR AUD In trading range. Buying at the bottomRR 1:4
Risking 100 pips for 400 pips
adding the the winner if 100 pip profit is made, where I would move up the stop loss.

SRF MAKING PIERCING CANDLESTICKSRF MAKING PIERCING CANDLESTICK , ALSO TOOK Support on gap , have eyes on this

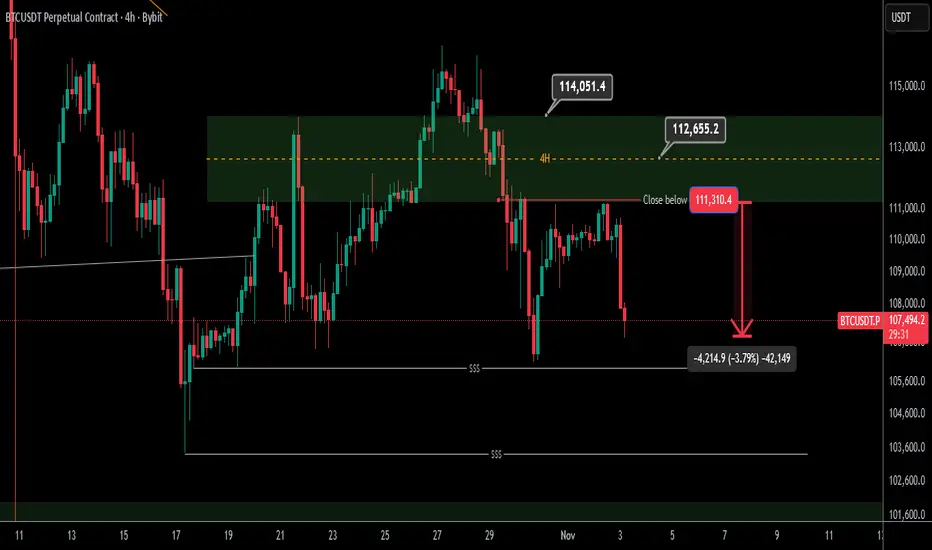
4-hour Bitcoin Analysis Update
Hello Traders
So far, the 4-hour timeframe has dropped and gained about $4,000 from the first announced resistance, and if it returns, the second resistance level of 112 is still clear on the chart, and the previous analysis remains valid
Analysis link:
Above 4000, continue to be bullish on gold.#XAUUSD OANDA:XAUUSD TVC:GOLD
Gold prices fell after opening lower in Asian trading today, but rebounded after touching the key support zone of 3960-3950 and then entered a narrow range of fluctuation. Judging from the current trend, gold is still in an upward channel, and the price is still stabilizing above the daily MA5. Therefore, as long as it does not break below the daily MA5 of 3985, we can continue to maintain a bullish view.
Observing the 1H and 4H charts, we can see that the moving average support is basically maintained in the 4010-4000 range. If the gold price retraces to this range in the short term, we can consider going long on gold. Meanwhile, the first resistance level to watch is 4035-4045, which is both the rebound high point that gold prices repeatedly tested last Friday and the location of the daily MA10 moving average. Only by breaking through and stabilizing above this level will gold prices further test the upper resistance of 4050, or even higher.

PENGUUSDT.P approaching premium major swing fib levelsCSECY:PENGU continuation downwards as loosing earlier fib levels and support. Coming to premium fib levels and lowest of all premium fib zones of 0.786-0.886.
This might be several week play as I don't believe V-shape recovery on this one. Don't see any of that in the past chart. What is always more probable in crypto is V-shape dump from the highs. 😁
Near 0.886 fib level we have a nice weekly SR-flip support zone formed from multiple weekly open levels.
There is a hefty 30% gap between fib levels so there will be amazing smaller swing trade possibilities available when things turn.
I'm looking for 2-5X leverage plays at the zone which can turn into 60-150% profits with just ranging motion. That is huge.

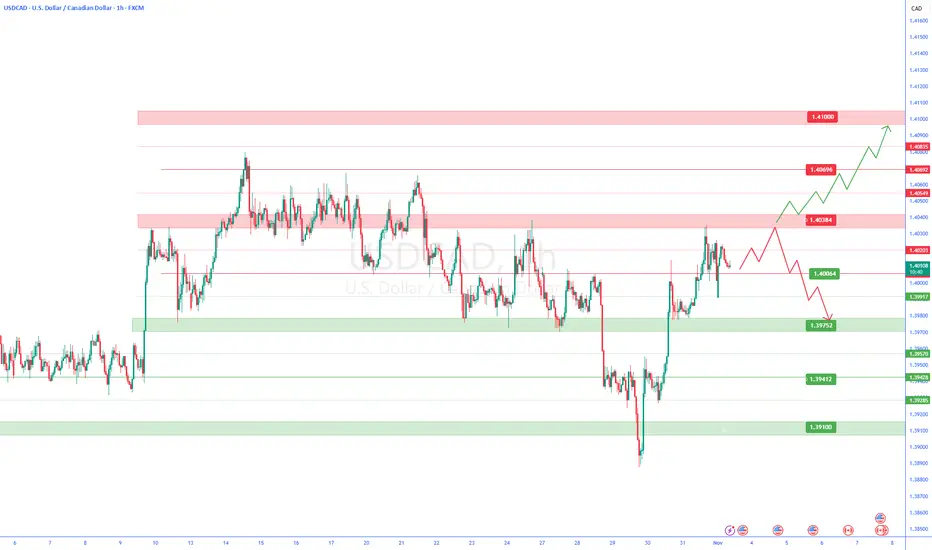
usdcad 1h🔹 Overall Outlook and Potential Price Movements
In the charts above, we have outlined the overall outlook and possible price movement paths.
As shown, each analysis highlights a key support or resistance zone near the current market price. The market’s reaction to these zones — whether a breakout or rejection — will likely determine the next direction of the price toward the specified levels.
⚠️ Important Note:
The purpose of these trading perspectives is to identify key upcoming price levels and assess potential market reactions. The provided analyses are not trading signals in any way.
✅ Recommendation for Use:
To make effective use of these analyses, it is advised to manually draw the marked zones on your chart. Then, on the 15-minute time frame, monitor the candlestick behavior and look for valid entry triggers before making any trading decisions.
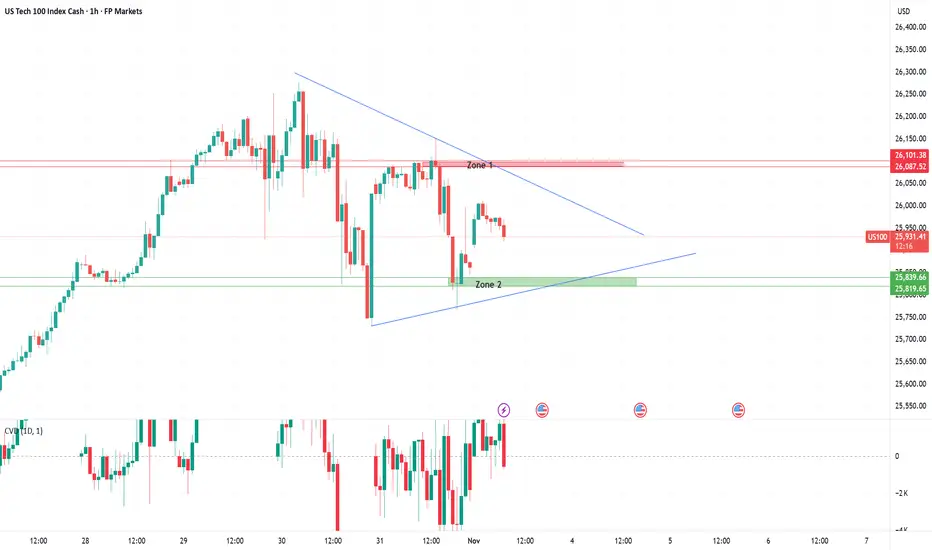
US100 – Key levels in focusUS100 – 1H Technical Zone Analysis
Zone 1: Friday’s High
This zone marks Friday’s high and the upper boundary of the current consolidation structure. It represents the point where bullish momentum paused before the weekend, and now acts as immediate resistance. A clean break and hold above Zone 1 would confirm renewed buyer strength and could open the path toward fresh all-time highs. Until then, traders are likely to view this level as a short-term decision point for directional bias.
Zone 2: Friday’s Low
This zone defines Friday’s session low — the level where buyers regained control and pushed price higher into the weekly close. It now serves as key intraday support and aligns closely with the ascending trendline structure. Holding above Zone 2 keeps market sentiment constructive and suggests that buyers remain in control of short-term direction. A clean break below would signal fading momentum and could invite a deeper pullback toward 25,700–25,750.
Market Recap – US100 Overview
The US100 closed last week on a strong note, extending its rally to fresh all-time highs as optimism spread across global markets. Sentiment was fueled by renewed progress in U.S.–China trade negotiations, with reports suggesting a potential framework deal and discussions over easing tariffs on rare-earth materials and agricultural goods. This reduced geopolitical risk and boosted risk appetite across equities.
Tech and AI-related stocks once again led the charge, highlighted by NVIDIA reaching a record $5 trillion valuation, reinforcing the dominance of the growth and semiconductor sectors. The Federal Reserve maintained a cautious stance, signalling that rate cuts are not guaranteed, but investors largely shrugged off policy uncertainty amid the ongoing government data blackout.
Overall, the tone was constructively bullish: optimism on trade and strong tech momentum outweighed concerns about stretched valuations and limited macro visibility. Heading into the new week, traders remain focused on whether the rally can hold as markets navigate high levels, thin data, and potential volatility from fresh headlines.