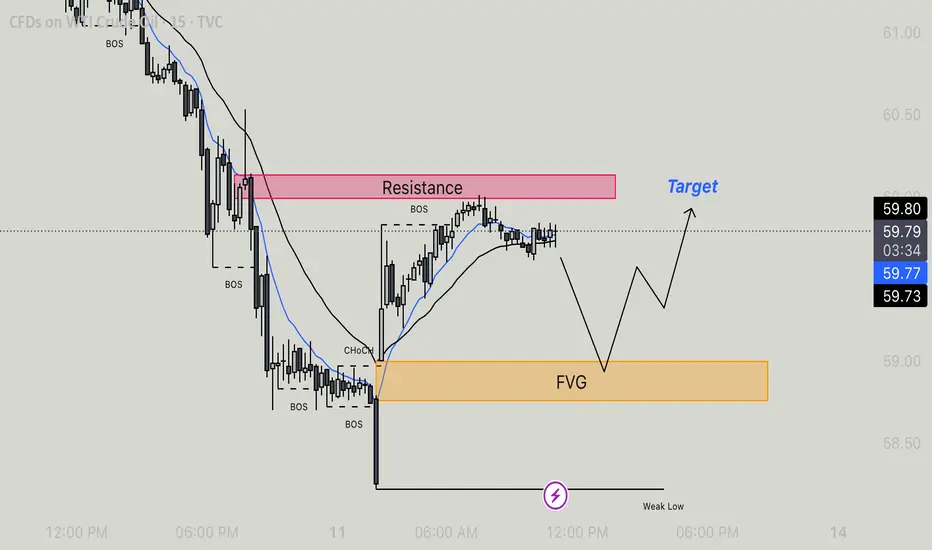
Usoil - Retracement to FVG Before Bullish ContinationMarket Structure & Key Levels
Resistance Zone: Price reacted from this supply area, showing short-term rejection after BOS (Break of Structure) to the upside.
FVG (Fair Value Gap): Price is expected to retrace into this imbalance zone for demand before resuming higher. Watch for bullish price action here.
Weak Low: If price breaks this low, the bullish scenario becomes invalid and deeper downside may follow.
Structure Highlights:
BOS (Break of Structure): Several BOS points confirm previous bearish trend and recent short-term bullish correction.
CHoCH (Change of Character): Marked at the base of reversal near FVG zone, indicating possible trend shift.
EMA Confluence: Price hovering around short EMAs, showing possible slowdown and setup for a pullback.
Trade Scenario
Expected Move:
Price could retrace to the FVG zone (imbalance fill) before a bounce.
From there, bullish momentum may resume toward the target zone above resistance.
Bullish Confirmation:
Look for price to tap into the FVG, form bullish structure (e.g., BOS, CHoCH), and engulfing patterns or lower-timeframe entries.
Target would be near recent highs or break above resistance at ~$59.90–60.00.
Invalidation:
Break below the Weak Low would invalidate this bullish setup and open room for further downside.
Supportandresistancezones
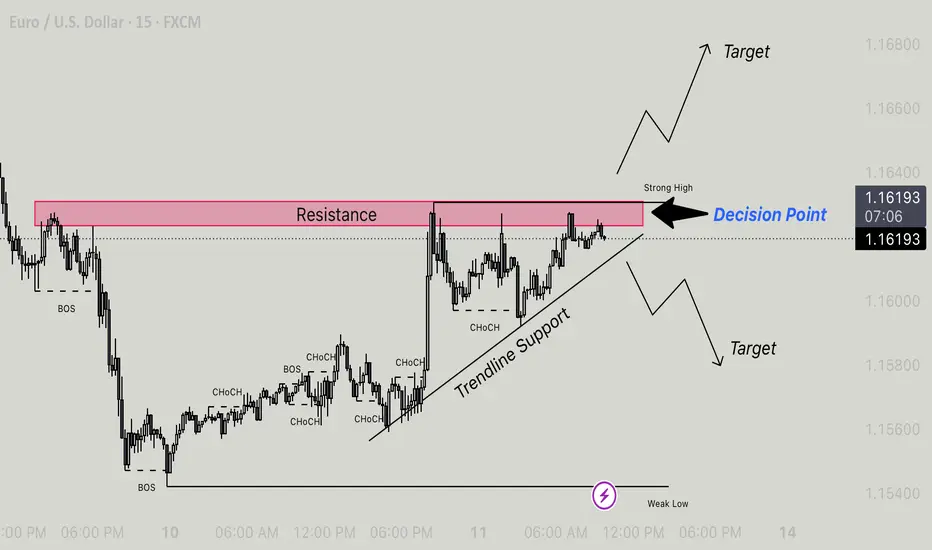
Eur/Usd - at Key Decision Point, Breakout or Reversal Resistance Zone: Clearly defined in red. Price has reacted multiple times from this area, indicating strong selling pressure.
Decision Point (DP): Price is currently sitting at a key decision point near the resistance zone. A breakout or rejection will dictate short-term direction.
Strong High: Needs to be taken out for bullish confirmation.
Weak Low: Vulnerable if price rejects the resistance and breaks below trendline.
Market Structure Highlights:
Break of Structure (BOS): Seen on the left side — marks bearish control initially.
Change of Character (CHoCH): Multiple CHoCHs observed during the upward move, signaling potential trend shift from bearish to bullish.
Trendline Support: Holding the bullish structure so far; price is respecting the ascending trendline, acting as dynamic support.
Scenarios at Decision Point:
Bullish Case:
Break and close above resistance and the Strong High.
Could signal continuation toward upper bullish targets (around 1.16600–1.16800).
Look for confirmation on lower timeframes for entries (retest + bullish engulfing or FVG fill).
Bearish Case:
Rejection from resistance + break of Trendline Support.
Opens path to bearish targets near 1.15800 and below (toward Weak Low).
A BOS to the downside would confirm bearish continuation.
Trading Tips:
Wait for clear confirmation (break and retest or price action signal) before entering.
Keep an eye on volume and momentum at the Decision Point.
Risk Management: SL below recent swing low (for longs) or swing high (for shorts).
Xau/Usd - At Make or Break LevelGold has been respecting a clear trendline support while making higher highs and higher lows, showing bullish structure on the 45-minute timeframe. Price is now testing a significant resistance zone, aligned with a weak high and prior BOS.
Structure Overview:
Trendline Support continues to hold, supporting the bullish momentum.
Multiple Breaks of Structure (BOS) confirm demand strength.
Price is now consolidating near the resistance zone (around 4,048–4,065).
Scenarios to Watch:
Bullish Case (Primary Bias):
A confirmed break above the weak high and consolidation above the resistance zone could lead to a continuation rally toward the upper target zone (above 4,100–4,125).
Bearish Case:
Rejection at resistance and a break of the trendline support may trigger a short-term correction back into the support zone (3,960–3,980).
Key Zones:
Resistance: 4,048 – 4,065
Support: 3,960 – 3,980
Trendline: Acting as dynamic support
Confirmation Needed: Watch for price action signals at resistance — e.g., breakout + retest for longs, or bearish engulfing/impulsive rejection for shorts.
Bias: Bullish (while trendline holds)
Timeframe: 45-Minute
Style: Price Action / Structure-Based Tradine

Xau/Usd- Bullish Play Above Support Price action on the 15-minute chart shows a potential bullish continuation forming after multiple CHoCHs (Change of Character) and a recent Break of Structure (BOS) to the upside.
Key Levels:
Resistance Zone: ~4,016 – 4,036
Support Zone: ~3,975 – 3,985
Strong High: Above 4,040 (target area)
Current Setup:
Price has tested the resistance zone and is showing signs of potential retracement. If price respects the support zone on the next pullback, a bullish continuation towards the target (strong high) is expected.
Scenario:
Pullback to the support zone (marked demand).
Bullish reaction from this zone could trigger a move upward.
First target: Break and close above resistance → continuation to strong high area.
Invalidation: Break and close below support zone (~3,975) would invalidate this short-term bullish setup.
Bias: Bullish (Short-Term)
Confirmation Needed: Price action around support zone
Timeframe: 15-Minute (Intraday)

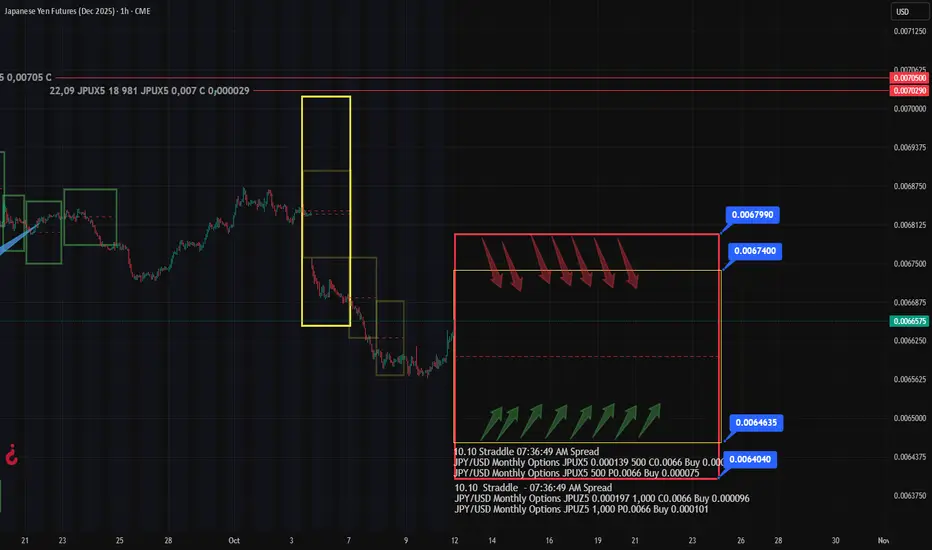
JPY Analysis & Outlook: Friday’s Options Flow Tells the StoryFriday’s trading on the options market revealed two key developments in JPY:
🔸 Two Straddles appeared in the current front-month expiry series
Plus a mid-sized Call Spread near 0.00675
Upper boundaries: 0.00674 and 0.006799 (marked on chart)
🔍 Key Takeaways:
Option traders are positioning likely for a correction in JPY futures after last week’s sharp drop.
But, Straddle isn’t a directional bet — it’s a volatility play with structure.
Call Spread is a a directional bet
As usual, when price approaches either Straddle boundary, option players will likely convert positions into synthetic calls or puts, reinforcing these levels as BE zones.
🎯 Strategic Levels:
0.00674 – 0.006799 → Potential resistance zone in the medium term
But here’s what’s interesting:
If you apply a Fibonacci retracement tool, the 61.8% level aligns almost perfectly with one of the already marked Straddle levels.
That kind of confluence?
It could attract additional downside liquidity from traders using Fib grids — especially those selling into "expected" reversal zones.
Is it a coincidence?
Sure, probably 😉
Xrp - Breakout Loading XRP is currently trading around $2.42, consolidating near a key horizontal support zone after a series of lower highs. The chart shows a descending trendline acting as dynamic resistance, while the $2.38–$2.40 region serves as strong support. This setup suggests a potential breakout opportunity as price approaches the apex of the structure.
Key Levels
• Resistance: $2.45 – $2.46
• Support (S): $2.38 – $2.40
• Current Price: $2.424
Technical Outlook
• Bullish Bias: A clear breakout and retest above the descending trendline could trigger an upside continuation toward the next resistance near $2.50–$2.52.
• Bearish Bias: Failure to hold above the support zone could lead to a drop toward the lower target area around $2.30–$2.25.
• Moving Averages: The short-term EMA is flattening out, indicating reduced volatility before a possible directional move.
Summary
XRP is consolidating between descending resistance and horizontal support, forming a potential breakout setup. Traders should watch for a confirmed close above the trendline for bullish continuation, or a break below $2.38 for bearish momentum.

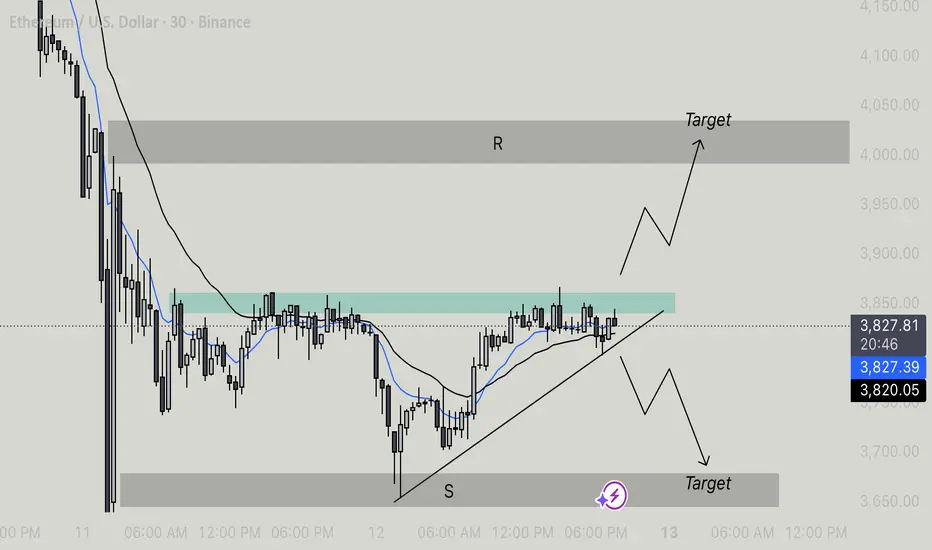
Eth/Usd - Breakout Loading, Watch Level CloselyEthereum is currently trading within an ascending triangle pattern, characterized by a horizontal resistance zone and rising trendline support. This pattern typically signals bullish continuation, though traders should watch closely for confirmation before entering a position.
Key Levels
• Resistance Zone (R): Around $3,850–$3,870, marked by repeated price rejection.
• Support Zone (S): Around $3,700–$3,720, providing strong buying interest.
• Current Price: Approximately $3,839.
Technical Outlook
• Trendline Support: ETH is respecting a clear upward-sloping trendline, showing buyers are steadily pushing higher lows.
• Horizontal Resistance: Price continues to test the $3,850 resistance area. A strong breakout and close above this level would confirm bullish momentum.
• Moving Averages: The shorter-term (blue) EMA is positioned above the longer-term (black) EMA, suggesting near-term bullish bias as long as support holds.
Scenarios
• Bullish Scenario:
If Ethereum breaks and holds above the $3,850 resistance, it could trigger a move toward the next resistance target near $4,000–$4,050. This would confirm a breakout from the ascending triangle pattern.
• Bearish Scenario:
A breakdown below the ascending trendline could lead to a retest of the $3,700 support zone or even lower toward $3,650, signaling short-term weakness.
Summary
Ethereum is consolidating just below a key resistance level within an ascending triangle. A breakout above $3,850 may open the door to further upside momentum, while a breakdown below trendline support could invalidate the bullish setup. Traders should watch for a decisive move with volume confirmation to gauge the next direction.
Bearish Divergence on Bigger tf
CMP 105228.47 (02-06-2025)
Bearish Divergence on Bigger tf (Cautious
approach should be taken).
However, if 109350 is Crossed, we may
witness 115000 & then 120000 - 121000.
and if 112000 is crossed & sustained, be ready
to get New Highs :-)
Lets be more cautious & dig out 3 Important
Support Levels.
S1 around 103000 - 102500
S2 around 97800
S3 around 93400 - 93500.

Ethereum ShortAs U.S. Treasury yields and the U.S. dollar continue to strengthen, The crypto market continues its selloff. I have outlined some key areas where bulls will start to nibble on longs. Shorts are still open for at least another 2% down.

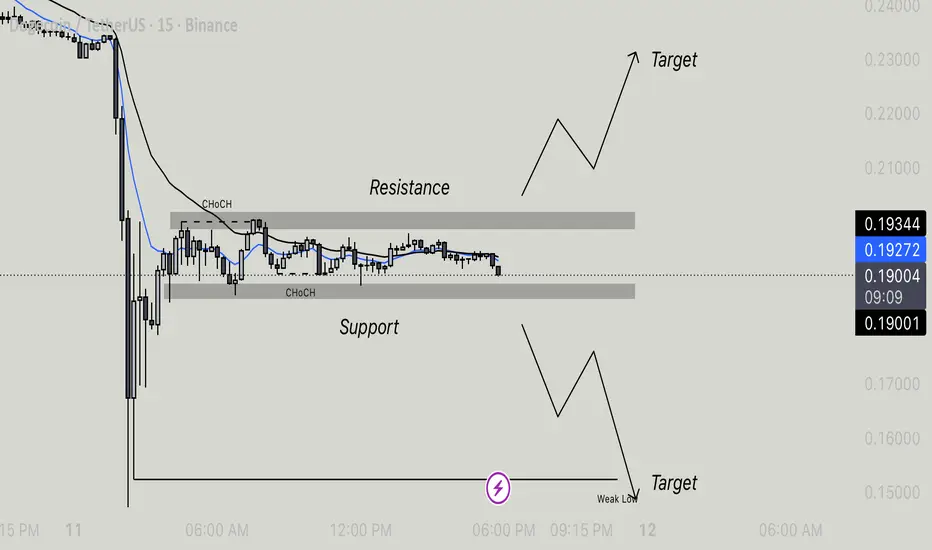
Doge/Usdt - Squeezing Between Support and Resistance Price is currently consolidating between a well-defined resistance zone (~0.193–0.195) and support zone (~0.187–0.189). A Change of Character (ChoCH) has been observed, indicating potential shift in short-term momentum.
Scenario 1 – Bullish Breakout:
If price breaks and closes above the resistance zone, expect bullish continuation towards the upper target area (~0.210–0.220). Look for retests of the breakout level for confirmation before entering long positions.
Scenario 2 – Bearish Breakdown:
If price rejects resistance and breaks below support, it may retest the weak low before moving towards the lower target zone (~0.150–0.160). Confirmation with volume and candle structure is recommended.
Market Sentiment:
Currently neutral to slightly bearish as price trades below resistance and shows reduced momentum. Traders should wait for a clear breakout or breakdown before taking positions.
Key Levels to Watch:
• Resistance: 0.193–0.195
• Support: 0.187–0.189
• Bullish Target: 0.210–0.220
• Bearish Target: 0.150–0.160
Support and Resistance VS Supply and Demand Explained
In the today's post, I will compare support and resistance levels with supply and demand zones.
I will explain to you the difference between them and share important tips and examples.
What are support and resistance levels?
We also call them key levels. These are particular levels on a price chart from where in the past we saw significant bullish or bearish movements.
Key support will be a one single level, that has a historical significance and from where a bullish reaction will be anticipated.
The all-time low on USDCHF will be a perfect example of a key support.
It is one single level that was respected one time in the past and from where a bullish reversal initiated.
Key resistance will be a one single level on a price chart that has a historical significance and from where a bearish movement will be expected.
The all-time high on Gold will represent a key horizontal resistance.
That level was respected one time in the past and from that level exactly the market dropped heavily.
What are supply and demand zones?
In comparison to support and resistance levels, supply and demand zones are the areas on a price chart. The zones that are based on multiple touches and consequent strong bullish or bearish reactions.
Demand zone will be the area that was tested at least 2 times in the past, and the price should strictly respect different price levels within that area.
A similar reaction will be anticipated from the demand zone in the future.
The yellow area above will a good example of a demand zone.
You can see that the price tested that area 3 times, and each time the market respected different levels lying within that.
These 3 tests compose the demand area.
Supply zone will be the area that was tested at least 2 times in the past and the price should strictly respect different price levels within that area.
A similar reaction will be anticipated from the demand zone in the future.
In this example, a supply area on EURUSD is based on 2 touches of key levels, lying very close to each other.
On the chart above, I underlined 2 horizontal support levels - the single levels that were respected by the market multiple times, and a supply zone - the area that is based on tests of multiple levels lying close to each other.
Support and resistance levels give you SINGLE levels from where you can look for trading opportunities. While supply and demand zones represent the areas . After a test of a supply and demand zone, the market may react to a RANDOM level within that.
For newbie traders, it is highly recommendable to trade single key levels, while experienced traders can broaden their strategies and trade supply and demand zones as well.
❤️Please, support my work with like, thank you!❤️
I am part of Trade Nation's Influencer program and receive a monthly fee for using their TradingView charts in my analysis.

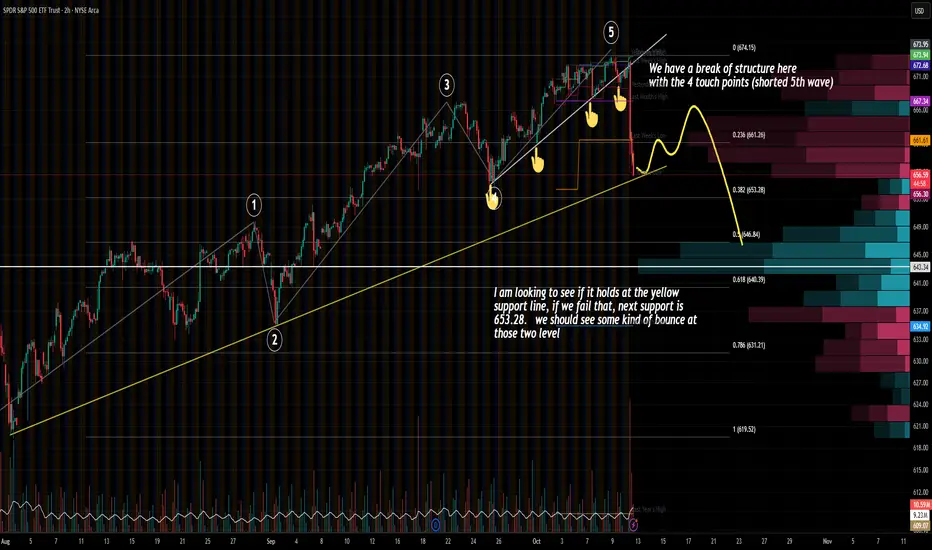
SPY potential bounce target (Fib / Trend Line)What a morning we had, I wish I would have caught the entire wave down, I did not expect a drop like this to happen, I was only able to capture maybe 20% of the drop in my short. Overall not a bad day. Usually after a drop we look to re-enter for a long. In order to avoid catching a falling knife, we are looking to break down out entry for long into 2.
1st Entry, right at the yellow support line, around 655.xx to 656
We would like to see a bounce then retest the yellow line and entry on the 2nd bounce.
2nd Entry would be at the Fib Level 0.382
I use E-wave pattern as a reference + fib retrace/ext to gauge most of my entry.
My biggest fear with this trade is that the pattern that I am expecting to happen end up finishing in ES before the market open on Monday.
So instead of buying 2 weeks out contract, I am going to buy calls closer to 4 weeks expiration in case I am wrong or ES movement on Sunday and I ended up missed out the entire structure.
TL:DR
Enter 1st long at $655.xx
If we dropped below $655
2nd Long is at 0382 FIB / $683.22
I will probably stop out if it dip below 0.5 FIB
I am not ruling out the possibility that we will go down further than 683.22 and head to 0.5 Fib or even 0.618 Fib.
As always trade with caution, always have a stop loss to prevent blowing up account.
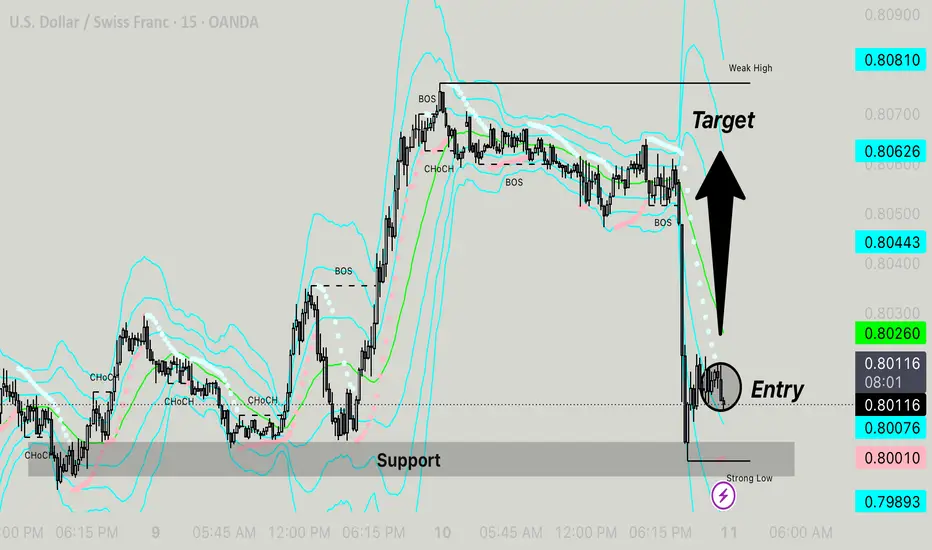
Smart Money Long SetupKey Concepts:
CHoCH (Change of Character) and BOS (Break of Structure) confirm shifts in market direction and continuation.
Liquidity Grab: Price swept a strong low and tapped into a major support zone, inducing sellers before reversing.
Entry Point: After the liquidity sweep, bullish reaction and structure formed a favorable entry (marked on chart).
Target: The target is set at a prior weak high, aligning with imbalance and liquidity resting above.
🔍 Confluences:
Price broke multiple minor structures (BOS) after the CHoCH.
Dynamic support from the Keltner/Bollinger-like bands shows mean reversion potential.
Strong rejection wick and consolidation at support confirm buyer interest.
Trade Idea:
Entry: ~0.80118
Target: ~0.80810
Stop Loss: Just below the strong low ~0.80010 or adjusted as per risk appetite.
Risk-Reward: Favorable R:R setup, especially if price reclaims mid-range levels above 0.80443.
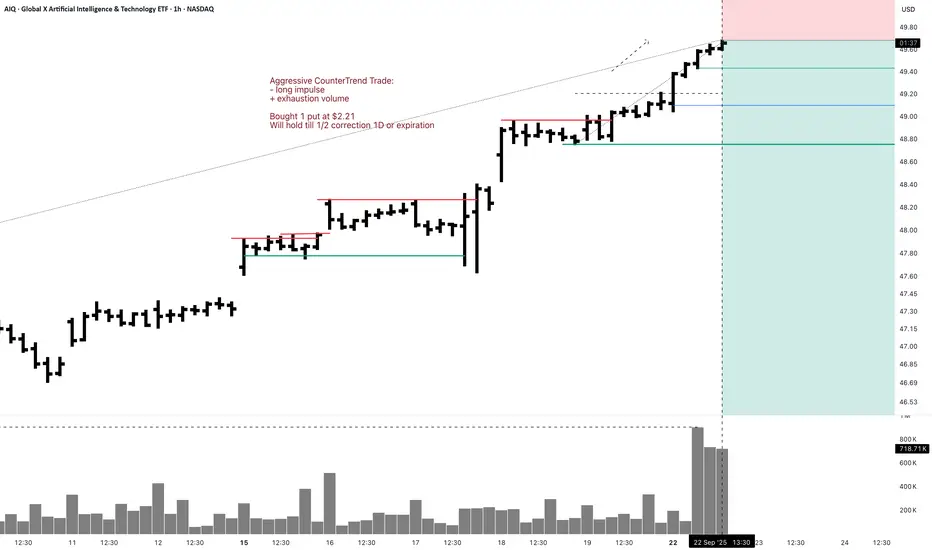
AIQ 1H Swing Aggressive CounterTrend TradeAggressive CounterTrend Trade:
- long impulse
+ exhaustion volume
Bought 1 put at $2.21
Will hold till 1/2 correction 1D or expiration
Daily CounterTrend
- long impulse
+ above expected range
+ exhaustion volume
Monthly CounterTrend:
- long impulse
+ SOS reaction bar
Yearly CounterTrend
"- long impulse
+ T1 level
+ resistance level
- far above T1"
Eth/Usd - Bullish Trendline BreakoutTrendline Breakout Confirmed
Price has broken out of the resistance trendline, forming a bullish structure with confirmation from multiple CHoCH (Change of Character) and BOS (Break of Structure).
Entry Executed
Entry was taken on breakout retest (highlighted zone). Price is now pushing above the resistance line, showing strong bullish momentum.
Target: 4430
Based on breakout projection and previous highs, next target is set at 4430.
Structure Overview:
Support Trendline holding price structure
Resistance Trendline broken with strong bullish candle
CHoCH and BOS indicate shift in market structure
15-minute timeframe suggests short-term bullish bias.
Target: 4430
Monitor for volume confirmation and continuation.

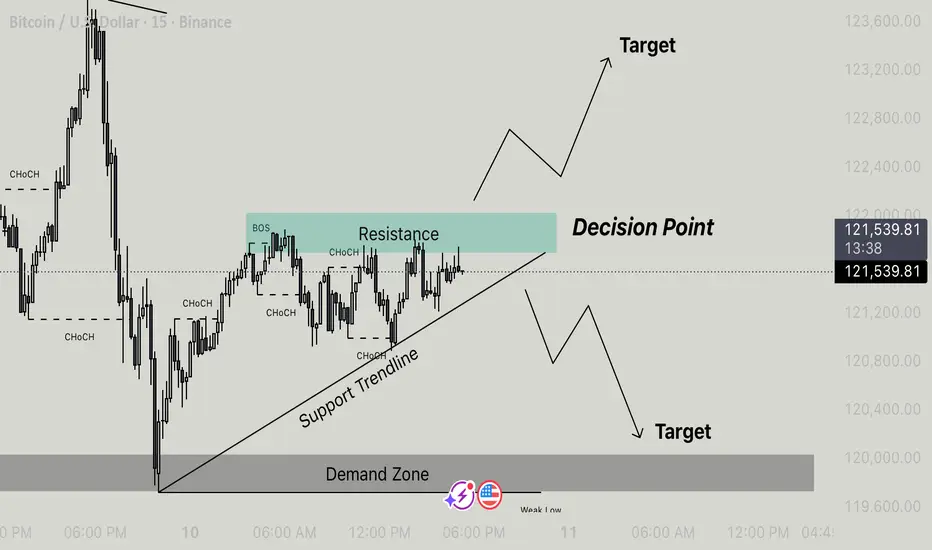
Btcusd - At A Critical Decision Point Bitcoin is currently trading around $121,575, consolidating near a key decision point where price action meets both resistance and the ascending support trendline.
Key Technical Zones
• Resistance Zone: 121,400 – 121,800
This area has acted as a rejection zone multiple times, forming the current decision point.
• Support Trendline: Connecting higher lows, showing bullish structure short-term.
• Demand Zone: 119,600 – 120,200
A strong reaction zone where price previously reversed — potential target if price breaks down.
Market Structure
• Multiple CHoCH (Change of Character) signals indicate short-term range-bound behavior.
• BOS (Break of Structure) confirms local bullish momentum but price is nearing resistance.
• Decision Point: Market could break either way soon, watch for confirmation.
Scenarios
Bullish:
• Break and close above resistance with retest → potential rally toward 122,800 – 123,200 target zone.
Bearish:
• Rejection from resistance or break below support trendline → possible drop toward Demand Zone (120,000 area).
Summary
Price is at a critical juncture — watch closely for breakout or rejection signals around 121,600. Traders should wait for confirmation before entering positions.
Xau/Usd - Buyers or Bears Next MovePrice on XAUUSD is currently consolidating after forming a change of character (ChoCH) near the decision point. The market has tapped into the previous order block (OB) zone, showing possible rejection from that area. A break above the decision point could confirm bullish continuation towards the strong high and upper target zones. However, if price fails to hold current structure and breaks below the support zone, a bearish move toward the weak low and lower target area can be expected. This is a crucial level where buyers and sellers are likely to decide the next direction of momentum.

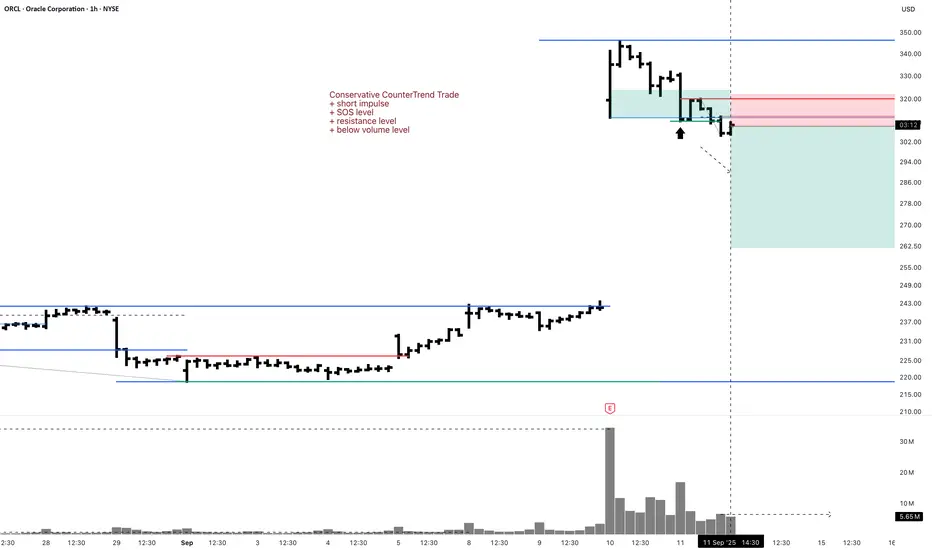
ORCL 1H Short Investment Put PurchaseConservative CounterTrend Trade
+ short impulse
+ SOS level
+ resistance level
+ below volume level
Daily CounterTrend
"- long impulse
+ exhaustion volume
- SOS level"
Monthly CounterTrend
"- long impulse
+ resistance zone
+ volumed interaction bar"
Yearly CounterTrend
"- long impulse
- neutral zone
+ impulse potential reached"
#BankNifty 10th October Friday - #CatchAndRead Bank nifty 10th October Friday - zigzag untadaa - #CatchAndRead
Follow my Yt channel... Link in dp

Eur/Gbp - Ascending Triangle Near Key Resistance Price is currently consolidating just below a key resistance zone (~0.8695–0.8700), forming a clear ascending triangle pattern.
Multiple CHoCHs (Change of Character) and BOS (Break of Structure) indicate recent bullish momentum.
Strong support is established at the 0.8665–0.8670 level, with higher lows pushing price upward.
Scenarios to Watch:
Bullish Breakout:
If price breaks and closes above the resistance and the Strong High, this could confirm bullish continuation.
Target: ~0.87200 zone (measured move and psychological round number).
Bearish Rejection:
A failure to break resistance with a strong bearish reaction could signal distribution and reversal.
Watch for a break of the ascending trendline and a CHoCH below support.
Target: Revisit of the 0.8665–0.8670 support zone or lower liquidity levels.
Trade Ideas:
Breakout buyers can look for confirmation above resistance with volume or retest entry.
Reversal traders should monitor for signs of rejection and trendline break.
Bias: Neutral–Bullish (Awaiting breakout confirmation

ETHUSD 30-MIN – Holding Zone Reaction Ahead BITSTAMP:ETHUSD
Market Overview
After sweeping liquidity from the upper rejection zone, ETH experienced a controlled sell-off, reaching into the strong blue holding zone. The current structure shows early signs of absorption and a potential W-shaped reversal forming. If buyers defend this area, we could see a breakout toward the 4 535 and 4 672 reaction zones. Otherwise, failure to hold this block could drive price deeper toward the yellow demand base for the next bullish reload.
Key Scenarios
✅ Bullish Case 🚀 → 🎯 Target 1 : 4 435 | 🎯 Target 2 : 4 535 | 🎯 Target 3 : 4 672
❌ Bearish Case 📉 → 🎯 Target 1 : 4 250 | 🎯 Target 2 : 4 100 (deeper demand)
Current Levels to Watch
Resistance 🔴 : 4 435 – 4 672
Support 🟢 : 4 280 – 4 100
⚠️ Disclaimer: This analysis is for educational purposes only. It is not financial advice.

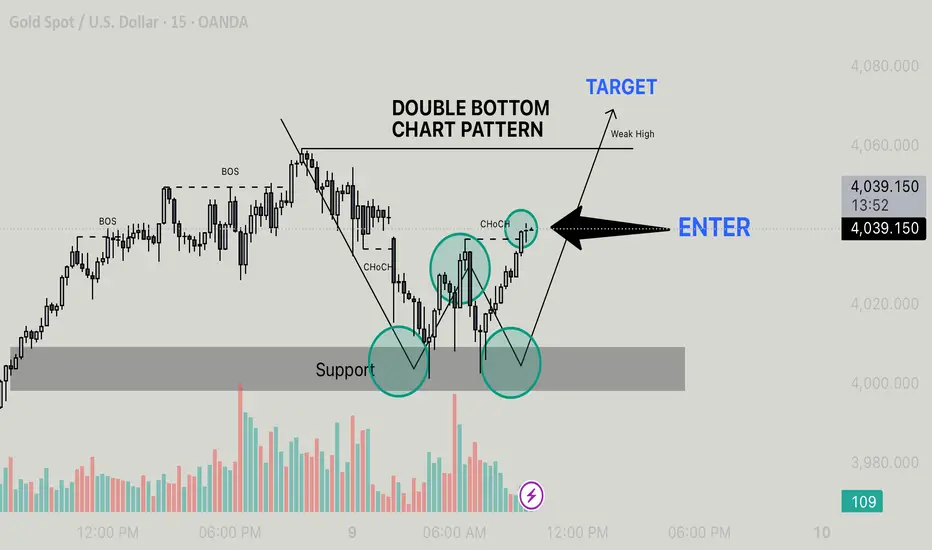
Xau/Usd - Double Bottom Breakout & Bullish Reversal Support Zone: Price tested a key support level (gray area) twice, forming a classic Double Bottom pattern.
CHoCH (Change of Character): After the second bottom, price broke above the previous minor high, signaling a potential reversal from bearish to bullish.
Volume Confirmation: Increased buying volume at the second bottom supports bullish momentum.
Trade Plan:
Entry Point: Marked at 4,037.260 after confirmation of CHoCH and bullish candle close above neckline.
Target: Aiming for the Weak High area (prior resistance level).
Risk Management:
Stop Loss: Below the second bottom and support zone (approx. < 4,000 level).
Risk-Reward: Minimum 1:2 to weak high.
Bullish Bias Justification:
Double Bottom pattern indicates accumulation.
CHoCH confirms early trend reversal.
Break of Structure (BOS) aligns with bullish continuation.
Clear breakout from bearish trendline adds confluence.