TGKA 1H Swing Conservative Trend TradeConservative Trend Trade
+ long impulse
+ expanding T2 level
+ support level
+ 1/2 correction
+ biggest volume Sp
Calculated affordable virtual stop loss
1 to 2 R/R take profit
Day Trend
"+ long impulse
+ T2 level
+ biggest volume 2Sp-
+ support level
+ 1/2 correction"
Monthly Trend
"+ long impulse
- below 1/2 correction
+ expanding T2 level
+ support level"
No context on Year
Supportandresistancezones

GPBUSD: SUPPLY AND DEMAND ANALYSISOn the 4H timeframe, GBPUSD is currently reacting around a key supply zone.
🔴 Supply Zone (1.3530 – 1.3547):
Price rejected this area previously with strong selling pressure.
Price is now retesting this zone, where sellers are likely to defend again.
🔵 Demand Zone (1.3335):
This is the next major support where buyers previously stepped in.
It remains the logical take profit target for shorts.

BTCUSD🚀 BTCUSD – 1H Time Frame Setup
📈 BTC is making HHs & HLs (short-term bullish structure).
🔑 Tried to break resistance 111,835 – 112,000 thrice ❌ — possible breakout on the 4th or 5th attempt.
⏳ 4H & Daily trend still bearish ⚠️ → trade with caution.
Currently Ranging!
💡 Trading Plan:
✅ Look for a bullish candle confirmation before entry.
🎯 Partial booking recommended at TP1 → must manage risk after first target.
🛑 Always protect profits / adjust SL.
📊 Best setup if BTC comes near 0.5 Fib (≈ 6.08 level) and then breaks above 111,835 – 112,000 🔓

No clear break of UK100 yetTRADENATION:UK100
Good morning my fellow traders!
uk100 price still within its downward trend range, currently rising but seems to have hit some consolidation around the 9150 - 9155 area.
areas to watch -
BULLS : 9162.0 has some resistance, above this is 9190.0. CAUTION around this area as the downward trend line is just above 9162.0, breaking above the trendline will see 9190.0
BEARS : watch for rejections at 9162.0, for a further pull back towards 9130.0, and 9090.0.
apply your risk management during this stage as it may break upwards pushing towards a new potential ATH, or a further continuation of its downward path.
Apply your strategy, trade the range and goodluck to you!

“BTCUSD Road to 120K – But Watch the Trap Ahead!”“BTCUSD 🚀 Road to 120K – But Watch the Trap Ahead!”
Bitcoin has shown strong momentum after a liquidity sweep around 108,000, signaling that big players collected orders before pushing price higher. This is a common smart money concept (SMC) move where liquidity is grabbed before the next leg.
🔑 Key Points to Note:
Previous Support Flip: Market reclaimed the broken support, turning it into a base for continuation.
Upside Target: The next major resistance zone is 120,000 – 123,000, where sellers are likely to step in.
Market Behavior: Price often sweeps liquidity before testing strong resistance, so patience is key.
Potential Pullback: Once resistance is tapped, a correction may follow as profit-taking starts.
📌 Educational Takeaway: Always watch how price reacts at liquidity zones and key resistance points. These levels often decide whether the trend will continue or reverse.
📈 For now, short-term bias = bullish toward 120,000, but be cautious for a possible rejection at that zone.

Us30 longU30 forms a spring on the 4hr.
The general market is bullish on the daily, so underlying conditions are on our side, I can't stress enough the value of that,
So far, setup looks A+

GOLD 15 MIN OUTLOOK
Price is reacting from the OB zone above, showing signs of short-term rejection.
If the current support fails, I’m watching the 3,525 – 3,515 zone as the next reaction point.
Deeper liquidity sweep could target the 5min OB at 3,500 or even the Major POI around 3,485 before a strong bullish push.
As long as structure holds, I expect price to hunt liquidity below before moving higher toward 3,545+.
Plan:
Wait for confirmation in demand zones.
Look for bullish setups around 3,515 / 3,500 / 3,485 depending on how deep the pullback goes.
Target continuation toward new highs above 3,545.

"Gold’s Critical Bounce Zone – Is $3,400 the Next Magnet Level?""Gold’s Critical Bounce Zone – Is $3,400 the Next Magnet Level?"
📊 XAUUSD is showing a textbook bullish structure setup after forming a Higher Low right above strong support at $3,339. Price is now trading inside the Entry Zone ($3,348 – $3,339), an area that aligns with:
✅ Order Block Support
✅ Previous Break of Structure (BOS)
✅ Smart Money Fair Value Gap (FVG) retest
🧐 Market Structure Insight
Recent BOS flipped bias to bullish after buyers pushed through prior resistance.
A bullish FVG from earlier in the trend still holds influence, attracting price back for a healthy retest.
The current Higher Low shows buyers stepping in early, maintaining upward momentum.
Strong resistance is located at $3,400 – $3,440, which also acts as a psychological magnet for traders.
🎯 Trade Plan (Educational Example)
Entry Zone: 3,348 – 3,339 📍
Stop Loss: below 3,339 🛑
Target 1: 3,380 🎯 (partial profits)
Target 2: 3,400 ⭐ (main target)
Extended Target: 3,420 – 3,440 💎
📈 Reward to Risk: ~1.6R to the main target, with potential 2.9R to extended resistance if momentum accelerates.

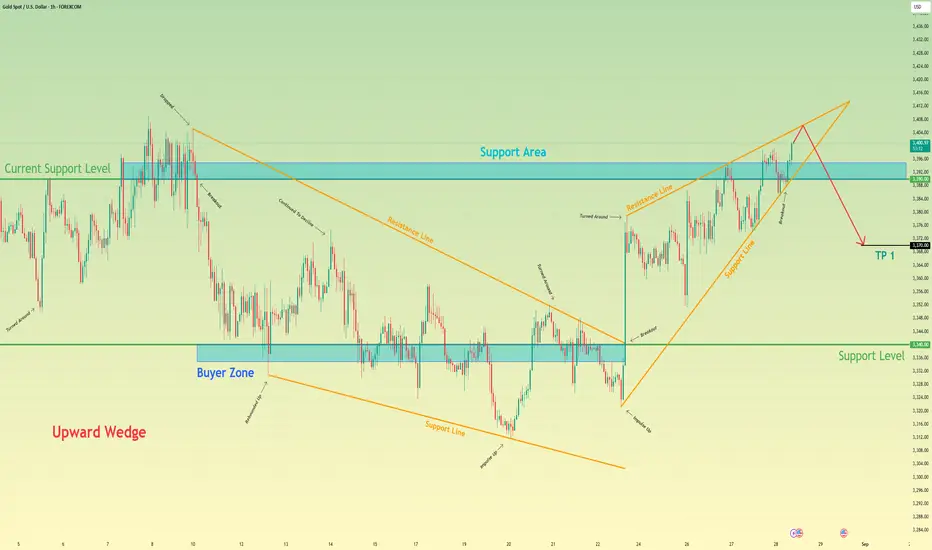
Gold will start to decline and then exit from wedgeHello traders, I want share with you my opinion about Gold. The market dynamic for XAUUSD has seen a significant evolution, transitioning from a corrective falling wedge into a new bullish phase after a powerful breakout from the lows. This upward trend has since matured and taken the shape of a large upward wedge, a pattern that has been guiding the price higher through a series of rebounds and corrections. This formation, while bullish in the short term, often signals potential trend exhaustion as it approaches its apex. Currently, the price action for XAU is at a critical juncture, pushing up against the upper resistance line of this wedge. The primary working hypothesis is a short scenario, which is predicated on the common bearish resolution of a rising wedge pattern. It is anticipated that the asset will be rejected from this resistance line, signalling that buying momentum is waning. A confirmed failure at this peak would likely trigger a sharp reversal, with enough selling pressure to cause a breakdown below the wedge's ascending support line and the current support level of 3390. This structural failure would validate the bearish thesis and initiate a new downward leg. Therefore, the TP is logically set at 3370 points, representing a prudent first objective for the price to achieve following the anticipated breakdown of the wedge structure. Please share this idea with your friends and click Boost 🚀
SUI — Where Liquidity Turns Into OpportunitySUI has been trading sideways for the past 40 days, offering solid swing opportunities both long and short. At the moment, there is one long setup that stands out → the $3.33 zone, where multiple layers of confluence align.
🧩 Confluence Factors: 5
1.0 Trend-Based Fib Extension: $3.3319
Prior Low: $3.3272 → potential liquidity sweep (SSL)
Anchored VWAP: Supporting the zone
Weekly 21 EMA / SMA: Acting as dynamic support
40d Range Context: Range low positioning
🟢 Long Trade Setup
Entry Zone: ~$3.33 (liquidity sweep into support)
Stop-Loss: Below $3.25
Target: Range highs near $4.20
R:R Potential: 1:10+
Note: Wait for bullish confirmation (order flow or strong reaction) before entering.
Technical Insight
The $3.33 level combines liquidity, fib projection, VWAP support, and the weekly 21 EMA/SMA → all pointing to a high-probability reaction zone. In sideways environments, such confluence at range lows often defines pivot points for the next swing move. If defended, upside targets remain the range high around $4.20.
🔍 Indicators used
Multi Timeframe 8x MA Support Resistance Zones → to identify support and resistance zones such as the weekly 21 EMA/SMA.
➡️ Available for free. You can find it on my profile under “Scripts” and apply it directly to your charts for extra confluence when planning your trades.
_________________________________
💬 If you found this helpful, drop a like and comment!

$BTCUSDT Breakout 124KCRYPTOCAP:BTC is testing the 113K resistance.
A clean breakout could send it toward 124.5K, nearly 10% higher.
The MACD is turning bullish, indicating growing momentum.
DYOR, NFA

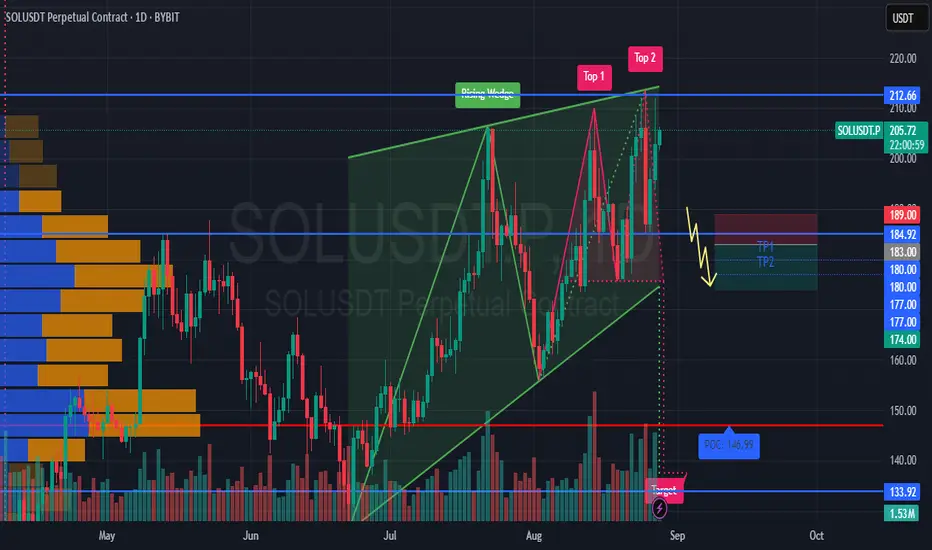
#SOLUSDT maintains a bearish setup📉 SHORT from $183.00
🛡 Stop loss $189.00
🕒 Timeframe: 1D
❗ If the price consolidates above $189, the setup becomes invalid.
⚡ Overview:
➡️ On the daily chart, a Rising Wedge has formed — a bearish pattern signaling potential reversal.
➡️ The $183.00 level is the key zone where the short scenario gets activated.
➡️ The POC at $146.99 remains a strong long-term magnet for price.
➡️ Increasing volumes on red candles confirm seller interest.
🎯 TP Targets:
💎 TP 1: $180.00
💎 TP 2: $177.00
💎 TP 3: $174.00
📢 Short entry is optimal from $183 with a clear stop at \$189.
📢 Focus on holding below $183 — this will confirm the bearish continuation.
📢 In the long term, if $174 breaks, the target could extend to the $147 (POC) zone.
🚀 #SOLUSDT maintains a bearish setup — as long as price holds below $183, expect a move toward $174 and potentially further downside.
Bulls and Bears zone for 08-26-2025It seems that traders were taking profit yesterday after Friday's huge move up.
Level to watch: 6452 --- 6454

Gold Update – Correction Complete, Acceleration Ahead?1. Yesterday’s setup
In yesterday’s update, after reviewing Gold in other currencies and concluding the bigger picture remains bullish, I pointed out that on XAUUSD a correction was normal after Friday’s huge rise. I highlighted the 3350 zone as the level where bulls should look for opportunities.
2. What happened overnight
Overnight, Gold delivered exactly that: a violent drop into 3350, immediately followed by an even more violent reversal that erased the move and spiked price up to 3385.
3. Current situation
At the time of writing, XAUUSD is trading around 3375. With the 3350 low now in place, we can reasonably consider the correction complete.
4. Key levels ahead
For a true bullish confirmation, clearing the 3380–3390 zone is essential . If this breakout occurs, I believe the 3400 level won’t act as much of a resistance, but rather as a point of upward acceleration.
5. Trading plan
My bullish view is unchanged. Buying dips against 3350 remains the strategy. For targets, a reasonable objective — if 3380–3390 gives way — is the 3450 zone.
6. Final note
Gold has shown its hand: buyers are here, defending the key level. Now it’s about confirmation above resistance — once that happens, momentum could take us higher, faster. 🚀
Disclosure: I am part of TradeNation's Influencer program and receive a monthly fee for using their TradingView charts in my analyses and educational articles.

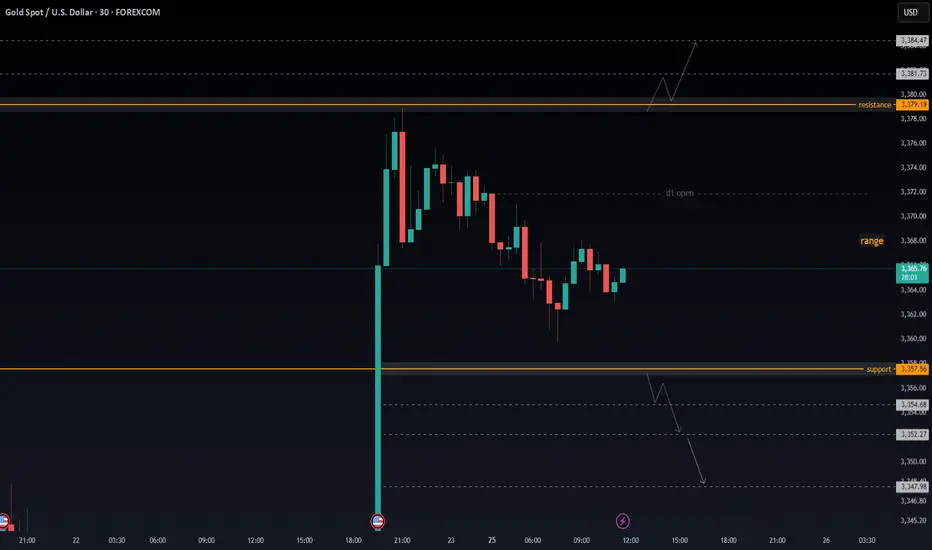
Gold XAUUSD 30M – Intraday Range PlanPrice is holding between $3,379.19 (resistance) and $3,357.56 (support). We are sitting in the middle of the box near $3,363–$3,364, with choppy candles showing hesitation. Scalps are possible, but reversals can be sharp inside this range.
🔼 Bullish Plan (needs confirmation)
Trigger: A clean 30min close above $3,379.19 (not just a wick).
Targets: First into $3,381.73, then $3,384.47. If momentum stays, room opens for $3,390+.
Management: Take partials at the first target, move SL to breakeven once $3,379 is defended.
🔽 Bearish Plan (cleaner below support)
Trigger: A 30min body close below $3,357.56.
Targets: First into $3,354.68, then $3,352.27. If sellers stay aggressive, extension into $3,347.98.
Management: Scale out at first target, protect remaining at breakeven.
🔄 Range Scalp (higher risk, small size)
Shorts: Near $3,379 on a strong rejection → aim for mid-range $3,365–$3,367, SL above rejection high.
Longs: Near $3,357–$3,358 on rejection wick → aim mid-range, SL under lows.
⚠️ Use reduced size – fast whipsaws possible inside this chop.
✅ What Confirms a Break
Strong 30min body close through the level.
Follow through with momentum candles.
❌ What Invalidates
Breakout candle closes back inside range on the next bar → likely trap.
Multiple wick pierces with no follow through.
📌 Bottom Line
Above $3,379.19 → bullish bias toward $3,384.47+.
Below $3,357.56 → bearish bias toward $3,352.27 and $3,347.98.
Inside the box = scalp zone only, manage risk carefully.
COPPER ~ TECHNICAL. 2H.Exiting this current channel may be accompanied by a significant price change...
So, we may have an eye on this after we buy or sell. but strongly.

Watching for a Pullback Entry on EUROFOREXCOM:EURUSD
🇪🇺💶 The euro remains under pressure, with EUR/USD hovering near a two-week low. Investors are cautious ahead of Federal Reserve Chair Jerome Powell’s speech at the Jackson Hole symposium, which is widely expected to provide new insights into the central bank’s policy direction. 📉 Market participants are holding back from major moves until they hear whether Powell will strike a hawkish or dovish tone.
⚖️ Traders are specifically looking for clarity on the future path of U.S. interest rates. Concerns are growing that Powell could push back against expectations for an imminent rate cut, which would reinforce dollar strength and weigh further on the euro. 💵✨ A more hawkish message could extend EUR/USD weakness, while any dovish hints may allow the pair to rebound from current lows.
🇪🇺💶The euro slipped to a two-week low versus the dollar, testing the 50-day EMA after hawkish comments from Fed officials.
Great trading day everyone! What is your opinion about EURO today?

GBP/JPY - Breakout (22.08.2025)The GBP/JPY TRADENATION:GBPJPY pair on the M30 timeframe presents a Potential Buying Opportunity due to a recent Formation of a Breakout Pattern. This suggests a shift in momentum towards the upside and a higher likelihood of further advances in the coming hours.
Possible Long Trade:
Entry: Consider Entering A Long Position around Trendline Of The Pattern.
Target Levels:
1st Resistance – 200.02
2nd Resistance – 200.42
🎁 Please hit the like button and
🎁 Leave a comment to support for My Post !
Your likes and comments are incredibly motivating and will encourage me to share more analysis with you.
Best Regards, KABHI_TA_TRADING
Thank you.
Disclosure: I am part of Trade Nation's Influencer program and receive a monthly fee for using their TradingView charts in my analysis.

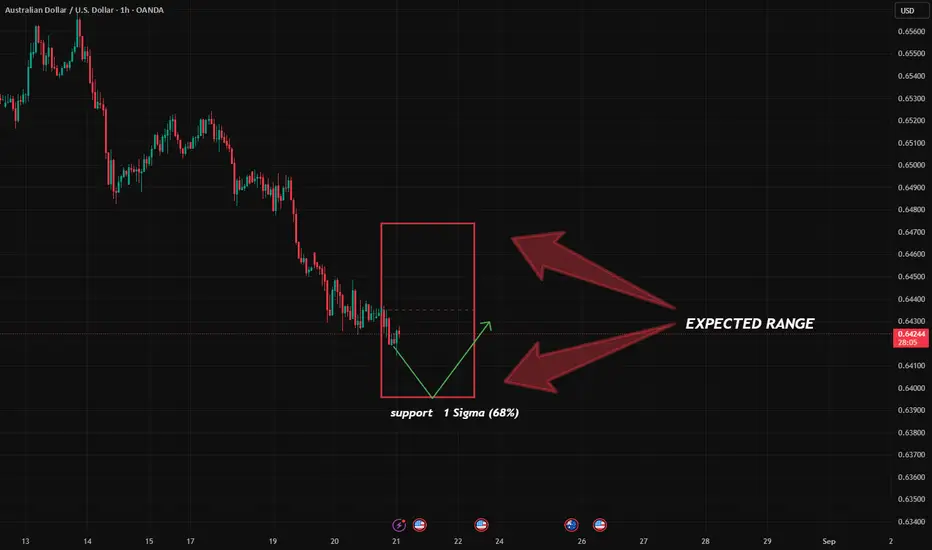
AUD Update: Volatility, Flow & The Wide Range Game
🌡 Volatility & ER Levels (Today):
Expected Range (1σ) for AUD/USD futures:
Lower bound: 0.63945 ← Key support
🧩 Options Flow: Big Portfolio Restructuring
Big news in the options pit:
A major portfolio targeting a drop to 0.64–0.63 has been restructured.
What’s left?
Put @ 0.64 (still in play)
Call @ 0.66 (new upper ceiling)
This isn’t random — it’s a shift from directional bearishness to range-bound positioning.
🧠 What’s the Sentiment?
Looks like the market is pricing in a wide sideways channel — exactly where AUD has been stuck for the past 2 months.
No strong bullish signals from COT yet.
📅 Next Catalyst: COT Report (Tomorrow)
Fresh data on institutional and retail positioning drops tomorrow.
🔍 Bottom Line:
Support at 0.63945 holds key.
Options now suggest a 0.64–0.66 range.
Wait for COT to confirm next move.
#AUD
Gold Trading Strategy XAUUSD 20/8/2025Gold Trading Strategy XAUUSD 20/8/2025: Gold falls to lowest level since early this month, continues to be under pressure from potential talks, watching the FED minutes.
Fundamental news: Spot gold prices fell sharply, hitting their lowest intraday level since August 1. Gold prices fell as US President Donald Trump, Ukrainian President Zelensky and European leaders discussed potential talks with Russia. Safe-haven demand eased as security speculation in Kiev sparked optimism that the war could end.
Technical analysis: Gold prices broke out of a bullish pattern and formed a bearish channel on the H1 timeframe. Currently, the MA lines combined with the liquidity zone are the resistance zones of gold prices. However, gold prices can recover strongly when approaching the support area of 3300, the fluctuation range of gold prices today will be 3300 - 3350.
Important price zones today: 3335 - 3340, 3350 - 3355 and 3300 - 3305.
Today's trading trend: SELL.
Recommended orders:
Plan 1: SELL XAUUSD zone 3338 - 3340
SL 3343
TP 3335 - 3325 - 3315 - 3300.
Plan 2: SELL XAUUSD zone 3350 - 3352
SL 3355
TP 3347 - 3337 - 3327 - 3300.
Plan 3: BUY XAUUSD zone 3300 - 3302
SL 3297
TP 3305 - 3315 - 3335 - 3350.
Wish you a safe, successful and profitable trading day.🥰🥰🥰🥰🥰

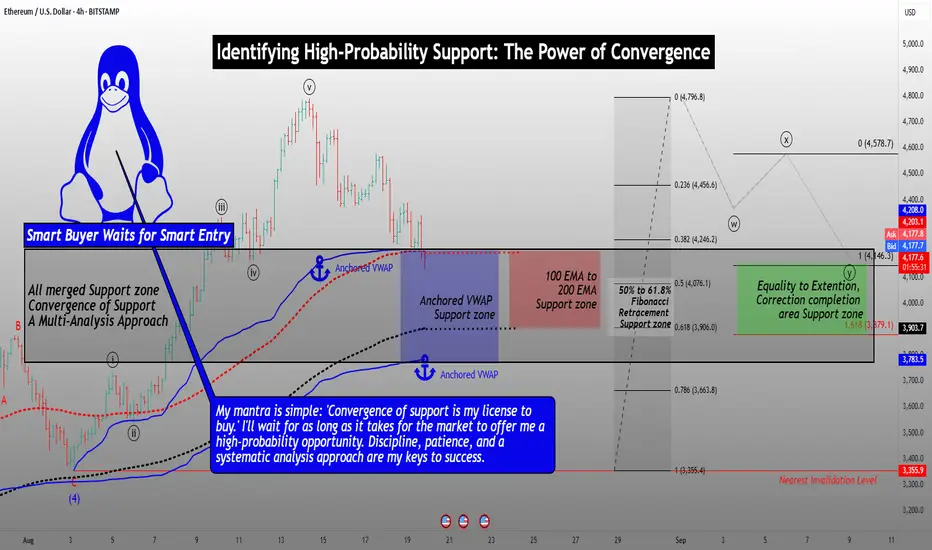
Identifying High-Probability Support: The Power of ConvergenceHello Friends,
Welcome to RK_Chaarts
Today we're going to learn Comprehensive Guide to Identifying Convergent Support Zones
Which are High Probability Support areas. This post is for Educational purpose only.
This detailed analysis will walk you through a step-by-step process of combining multiple technical analysis methods to identify a robust support zone. We'll explore how Elliott Wave theory, Anchored VWAP, EMA200, Fibonacci Retracements, and equality to extensions can coincidentally converge on the same support zone.
Step 1: Elliott Wave Analysis
Begin by identifying the Elliott Wave structure. Look for impulse waves, corrective waves, and the relationships between them. In this example:
- Wave Y is potentially completing near the equality zone (100% to 161.8% extension).
- This level marks a potential reversal point.
Support zone as per Elliott Wave theory Analysis
Step 2: Anchored VWAP Analysis
Apply Anchored VWAP to identify key support levels:
- Plot the VWAP from the last swing low and the second-last swing low.
- Note the convergence of these VWAP levels, which can indicate strong support.
Support zone as per Anchored VWAP Analysis
Step 3: EMA200 Analysis
Add the 200-period Exponential Moving Average (EMA) to your chart:
- The EMA200 has consistently provided support during previous corrections.
- Note the price approaching this level, increasing the likelihood of a bounce.
Support zone as per 200 Exponantial Moving Average
Step 4: Fibonacci Retracement Analysis
Apply Fibonacci retracements to the previous rally:
- Identify the 50%, 61.8%, and 78.6% retracement levels.
- Note the current fall has already exceeded the 38% retracement.
Support zone as per Fibonacci Retracement Analysis
Step 5: Convergence of Support Zones
Combine the analysis from each step:
- Note the striking convergence of support zones:
- Elliott Wave equality zone (100% to 161.8% extension)
- Anchored VWAP support zone
- EMA200 support level
- Fibonacci retracement zone (50%-61.8%)
Coincidentally all these are providing nearly same Support area (Price zone)
Trading Implications
With the convergence of these multiple analysis methods, you can:
- Identify a high-probability support zone.
- Look for buying opportunities near this zone.
- Monitor price action and market sentiment for confirmation of a reversal.
- Consider scaling into positions or setting limit orders within the support zone.
Important Note: Failure to Hold Support
If the price fails to hold support at this converged zone, it may indicate a stronger bearish trend. In this scenario:
- Be prepared for a potential significant downfall.
- Consider adjusting your trading plan to account for the increased bearish momentum.
- Keep a close eye on price action and market sentiment for further guidance.
By understanding the convergence of these multiple analysis methods and being aware of the potential risks, you'll be better equipped to make informed trading decisions and navigate the markets with confidence.
I am not Sebi registered analyst.
My studies are for educational purpose only.
Please Consult your financial advisor before trading or investing.
I am not responsible for any kinds of your profits and your losses.
Most investors treat trading as a hobby because they have a full-time job doing something else.
However, If you treat trading like a business, it will pay you like a business.
If you treat like a hobby, hobbies don't pay, they cost you...!
Hope this post is helpful to community
Thanks
RK💕
Disclaimer and Risk Warning.
The analysis and discussion provided on in.tradingview.com is intended for educational purposes only and should not be relied upon for trading decisions. RK_Chaarts is not an investment adviser and the information provided here should not be taken as professional investment advice. Before buying or selling any investments, securities, or precious metals, it is recommended that you conduct your own due diligence. RK_Chaarts does not share in your profits and will not take responsibility for any losses you may incur. So Please Consult your financial advisor before trading or investing.
XAU/USD Intraday Plan | Support & Resistance to WatchGold is currently trading around $3,338, sitting just below the $3,344 resistance level. Price remains under both the 50MA (pink) and the 200MA (green), which continue to act as dynamic resistance and keep the short-term structure bearish.
The recent bounce from the First Support Zone ($3,324–$3,344) shows buyers are still defending this area, but momentum is weak. A clean break and hold above $3,344 would open the path toward $3,364, with $3,386 as the next resistance.
If price fails to reclaim $3,344, then a retest of the First Support Zone is likely. A deeper break could expose the Secondary Support Zone ($3,304–$3,281), and if selling pressure accelerates, the HTF Support Zone ($3,254–$3,229) comes into play.
📌 Key Levels to Watch:
Resistance:
‣ $3,344
‣ $3,364
‣ $3,386
‣ $3,406
Support:
‣ $3,324
‣ $3,304
‣ $3,281
‣ $3,254
‣ $3,229
⚠️ For now, structure favors range-bound to bearish price action unless gold can reclaim $3,344 and hold above the 50MA.
📌 Fundamental Overview
This week is event-heavy with multiple Fed speakers, Wednesday’s FOMC Minutes, and Thursday’s U.S. jobless claims & PMI data all set to drive volatility. The spotlight will be on Friday’s Jackson Hole Symposium, where Powell’s speech could shape expectations for upcoming rate cuts.
On the geopolitical side, Trump’s push for a Russia–Ukraine peace deal has raised uncertainty, with reports of territorial concessions being discussed. While no breakthrough has been reached, the headlines add to safe-haven demand for gold.

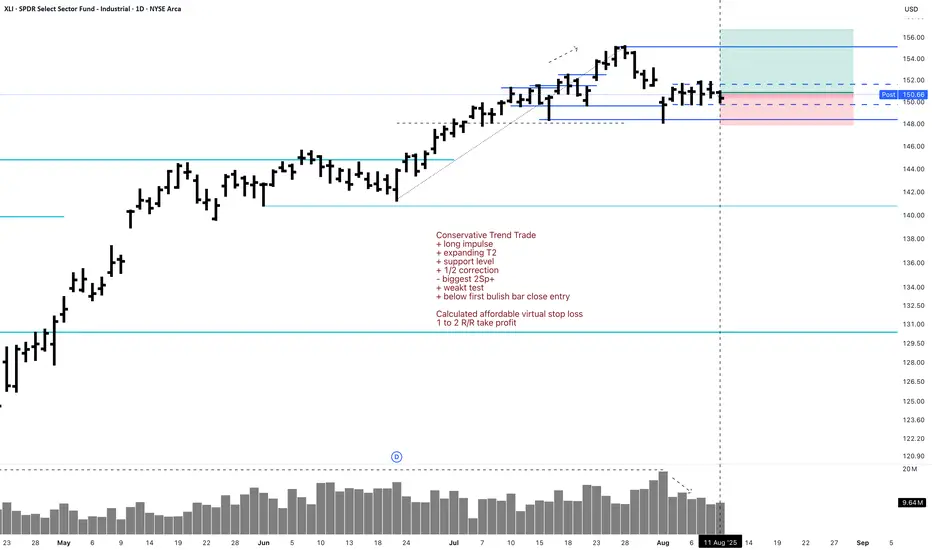
XLI 1D Long Investment Conservative Trend TradeConservative Trend Trade
+ long impulse
+ expanding T2
+ support level
+ 1/2 correction
- biggest 2Sp+
+ weakt test
+ below first bulish bar close entry
Calculated affordable virtual stop loss
1 to 2 R/R take profit
Monthly Trend
"+ long impulse
+ long volume distribution
= neutral zone"
Yearly trend
"+ long impulse
+ neutral zone"