Gold price developments today, November 141. Trendline
Descending trendline (upper red): Price is repeatedly rejected here → a strong dynamic resistance.
Ascending trendline (lower red): Price has bounced multiple times → an important dynamic support, forming a confluence with the 0.618 Fibonacci level.
2. Resistance
4,215 – 4,225:
Supply zone + confluence with the descending trendline → a high-probability selling area.
If price breaks strongly above 4,225, the next expansion target is 4,244.
3. Support
4,172 – 4,155 (Fibo 0.5 – 0.618):
Nearest support, likely to see a reaction.
4,127 – 4,130:
The strongest support zone, aligned with the ascending trendline → a potential buying area.
4. Price Scenarios
Scenario 1 (primary):
Price retraces to retest 4,215–4,225, gets rejected → declines toward 4,155 or deeper to 4,127.
Scenario 2:
If the descending trendline breaks, price could rally strongly toward 4,244.
BUY GOLD : 4127 - 4130
Stoploss : 4113
Take Profit : 100-300-500pips
SELL GOLD : 4221-4224
Stoploss : 4233
Take Profit : 100-300-500pips
Supportandresistancezones

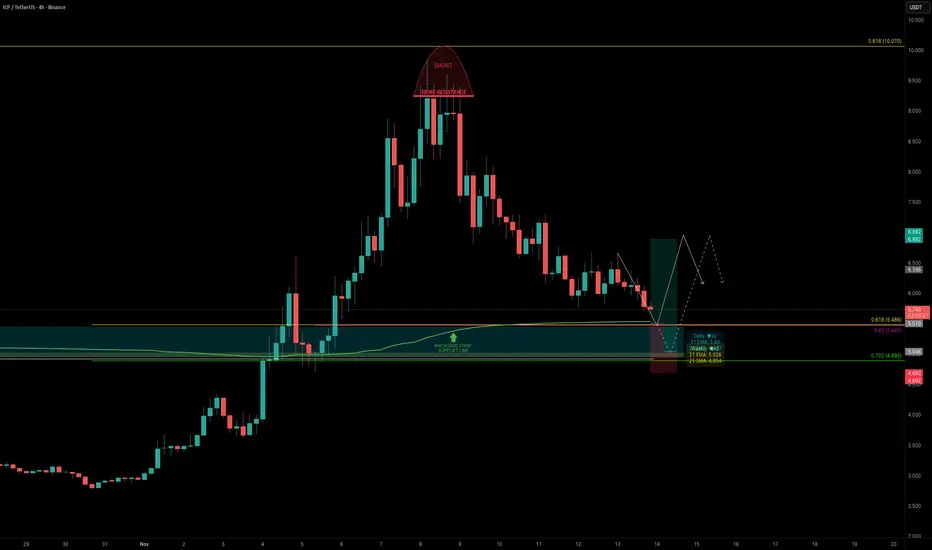
ICP — Identifying the Next High-Probability Long OpportunityICP had a great start to November, rallying over +250% in just 8 days before topping out just below the 0.618 Fibonacci retracement (~$10), right at the $3B MC resistance.
Over the past 5 days, ICP has retraced -42% from the high. The key question now: where is the next high-probability long opportunity?
Key Confluences around the $5.5 Zone
One level that stands out strongly is the $5.5 zone, where several major supports align:
0.618 Fib retracement of the entire +250% rally
0.85 Fib retracement of the smaller internal wave aligns right with the major 0.618 level
Anchored VWAP (280 day) clustering right around $5.5, adding volume-weighted support
Quarterly VWAP currently sits near $5.62
Daily 21 EMA at $5.45
Weekly 21 EMA/SMA both at around $5
$5.5 = $3B market cap
Point of Control (POC) of the past ~280 days sits around $4.9, marking it as the final major support layer below
🟢 Trade Setup Plan
Entry Zone: $5.6 – $5.0
Stop-Loss: Below POC
Targets:
TP1: $6.0
TP2: $6.9 (VWAP resistance / 0.382 Fib)
TP3: 0.618 FR
Risk/Reward: 1:2+, depending on entry precision
🔍 Indicators used
Multi Timeframe 8x MA Support Resistance Zones → to identify support and resistance zones such as the daily/weekly 21 EMA/SMA.
➡️ Available for free. You can find it on my profile under “Scripts” and apply it directly to your charts for extra confluence when planning your trades.
_________________________________
💬 If you found this helpful, drop a like and comment!
GBP/USD – Head & Shoulders Pattern (13.11.2025)🧠 Setup Overview FX:GBPUSD
GBP/USD is forming a Head & Shoulders pattern on the 1H chart — a classical bullish reversal structure after a prolonged downtrend.
Price is currently holding above the right-shoulder support zone, showing early signs of accumulation. A breakout above the neckline would confirm bullish momentum toward the next resistance targets.
📊 Trading Plan✅ Bullish Scenario
If confirmed → Expect bullish continuation toward:
🟢 1st Resistance: 1.3287
🟢 2nd Resistance: 1.3360
⚡ Fundamental Updates
1️⃣ U.S. Treasury yields eased slightly as consumer confidence declined.
2️⃣ Markets now price a 66% chance of a rate cut in December, according to CME’s FedWatch Tool.
3️⃣ U.S. government shutdown concerns keep the dollar under mild pressure as investors watch debt issuance risk.
💬 Summary
A clear trendline rejection combined with fundamental USD weakness supports a short bias.
Wait for confirmation before entering — patience protects capital.
#GBP/USD #ForexAnalysis #TradingView #PriceAction #Trendline #Ichimoku #TechnicalAnalysis #ForexTrader #Fundamentals #SwingTrading #KABHI_TA_TRADING
⚠️ Disclaimer
This analysis is for educational purposes only and not financial advice.
Always do your own research and manage risk wisely.
📢 Support My Work
💚 Like, Comment & Share this idea to motivate more chart updates!
🧠 “Charts Don’t Lie, Traders Don’t Quit.”

USDT Dominance at Key Resistance – Crypto Reversal Ahead?One of the key indices we can use to gauge the direction of the cryptocurrency market is USDT Dominance ( CRYPTOCAP:USDT.D ) .
In this analysis, let's look at USDT.D% on the weekly timeframe .
Currently, USDT.D% is moving in a Resistance zone(6.77%-5.25%) , Time Reversal Zone(TRZ) , and is near a Potential Reversal Zone (PRZ) .
From a classic technical analysis perspective, it seems that USDT.D% is inside a Symmetrical Triangle and is currently near the upper lines of this triangle.
In terms of Elliott Wave theory, USDT.D% looks like the corrective wave B of the main wave Y is completing.
So we might expect USDT.D% to move downwards again, at least towards the lower lines of the symmetrical triangle .
Note: This is purely a technical analysis. USDT.D% is at a sensitive area, and if it breaks above the upper lines of the triangle, we should anticipate a decline in Bitcoin and other tokens.
What do you think? Can USDT.D% break the upper lines of the symmetrical triangle and push the crypto market down again, or will the market bounce back? Let me know your thoughts!
Please respect each other's ideas and express them politely if you agree or disagree.
Market Cap USDT Dominance% Analyze (USDT.D%), Weekly frame.
Be sure to follow the updated ideas .
Do not forget to put a Stop loss for your positions (For every position you want to open).
Please follow your strategy and updates; this is just my Idea, and I will gladly see your ideas in this post.
Please do not forget the ✅' like '✅ button 🙏😊 & Share it with your friends; thanks, and Trade safe.

GBP/CAD Rejection at Supply → Next Stop: 1.8350📉 GBP/CAD Analysis – Rising Wedge Breakdown in Motion
GBP/CAD has broken down from a Rising Wedge formation, signaling a potential bearish continuation. Price rejected strongly from the Key Zone (≈1.8550–1.8580), followed by a break + retest of the supporting trendline.
If downside pressure holds, we may see price move toward the Key Zone near 1.8350 (psychological level).
🔎 Technical Insights
✅ Rising Wedge breakdown confirms bearish structure
✅ Retest of support-turned-resistance
✅ Momentum shifting lower
🎯 Downside target → 1.8350 (Key Zone)
A clean continuation move could unfold if sellers sustain control below current structure.
🌍 Fundamental Outlook
• The Bank of Canada (BoC) remains cautious as inflation pressures ease, reducing expectations for aggressive tightening…supportive for CAD strength.
• The Bank of England (BoE) faces slower growth and uncertain monetary outlook, limiting GBP momentum.
• Softer UK business activity + Canada’s stable macro backdrop may help fuel further decline.
Overall fundamentals reinforce bearish sentiment on GBP/CAD.
✅ Support this analysis with a
LIKE 👍 | COMMENT 💬 | FOLLOW 🔔
Your engagement keeps the content flowing!
⚠️ Disclaimer:
This outlook is for educational purposes only. It is not financial advice. Please conduct your own analysis before trading.

XAU/USD Intraday Plan | Gold Stalls Below 4153 ResistanceGold is currently trading around 4118 after a strong rally from the 4027 breakout. Buyers appear to be pausing after several failed attempts to clear the 4153 resistance, with price now consolidating just above the 50MA, which is acting as short-term dynamic support.
We need confirmed break above 4153 resistance for bulls to extend the move to 4197 and possible 4234.
However, if price loses the 50MA and 4115 support, we may see a move into the pullback zone. Failure to hold the key support at 4027 may bring the First Reaction Zone back into focus.
📌Key Levels to Watch
Resistance:
4,153
4,197
4,234
4,285
Support:
4,115
4,074
4,027
3,984
🔎 Fundamental Focus:
It’s a busy day for speeches, with multiple FOMC members scheduled to speak throughout the session — comments could spark volatility across USD pairs.
Meanwhile, markets are keeping a close watch on the scheduled House vote to approve temporary government funding and reopen the U.S. government.

Nifty50 AnalysisHere is a analysis of NIFTY50 indices . Its currently in a make or break level . Its the best support level at current time. We can expect this ti move higher from the market support level and a possible new ATH soon. But if this support break the indices can plunge and give sharp fall easily to the lower marked levels.

USD/JPY - Wedge Breakdown |Watch 150.00 & 148.00✅ USD/JPY Analysis – H4 Chart - Rising Wedge Breakdown Potential
Price is currently respecting a Rising Wedge structure, showing signs of exhaustion near the Key Zone (≈154.20–154.70). We’ve seen a break + minor retest, indicating possible bearish continuation if sellers maintain pressure.
A drop toward the Psychological Level – 150.00 remains likely, followed by a deeper move into the 148.00 Key Zone if momentum continues.
✅ Market Context:
1️⃣Downward structure building inside the pattern.
2️⃣Sellers are showing strength near support levels.
3️⃣Breakdown below the trendline indicates momentum continuation toward lower zones.
✅ Trade Plan:
Entry: Sell after confirmed breakdown below the support (Candle close below trendline or retest of the breakout).
💰Take Profit (TP): At the Key Zone – major support area identified ahead.
🛑Stop Loss (SL): Above the pattern structure / recent swing high.
✅Psychological Discipline:
1️⃣Stick to plan – No Revenge Trades.
2️⃣Accept losing trades as part of the strategy.
3️⃣Risk only 1–2% of your account balance per trade.
✅ Support this analysis with a
LIKE 👍 | COMMENT 💬 | FOLLOW 🔔
It helps a lot & keeps the ideas coming!
⚠️ Disclaimer: This analysis is for educational purposes only and does not constitute financial advice. Forex trading involves high risk. Trade only with capital you can afford to lose and always do your own research.

USD/CHF - Trendline Rejection (10.11.2025)📊 Setup Overview : FX:USDCHF
USD/CHF continues to respect the descending trendline and Ichimoku cloud resistance, signaling potential downside pressure. Price is currently retesting the resistance zone (0.8070–0.8085) — a strong supply area that has rejected multiple times.As long as this zone holds, we expect a move toward the next support zones.
🧭 Trade Plan
Bias: 🔻 Sell / Short-term Bearish
Entry Zone: 0.8060 – 0.8080 (wait for confirmation candle or rejection)
Target 1 (1st Support): 0.8015
Target 2 (2nd Support): 0.7995
Invalidation: Break and close above 0.8085 (Resistance Zone)
⚡ Fundamental Updates
1️⃣ U.S. Treasury yields eased slightly as consumer confidence declined.
2️⃣ Markets now price a 66% chance of a rate cut in December, according to CME’s FedWatch Tool.
3️⃣ U.S. government shutdown concerns keep the dollar under mild pressure as investors watch debt issuance risk.
💬 Summary
A clear trendline rejection combined with fundamental USD weakness supports a short bias.
Wait for confirmation before entering — patience protects capital.
⚠️ Disclaimer
This analysis is for educational purposes only and not financial advice.
Always do your own research and manage risk wisely.
📢 Support My Work
💚 Like, Comment & Share this idea to motivate more chart updates!
🧠 “Charts Don’t Lie, Traders Don’t Quit.”
#USDCHF #ForexAnalysis #TradingView #PriceAction #Trendline #Ichimoku #TechnicalAnalysis #ForexTrader #Fundamentals #SwingTrading #KABHI_TA_TRADING

AUD/USD - Support Rejection and Potential Bullish ReversalPrice is currently trading within a key support zone (0.6510 – 0.6520) after multiple rejections from this area. The market has been in a short-term downtrend, forming a series of Breaks of Structure (BOS) and Change of Character (CHoCH) patterns to the downside.
However, recent price action shows a potential exhaustion of selling pressure during the London session, with liquidity being swept below support. A descending trendline has been respected, and a breakout above it could confirm a shift in short-term market structure.
Key Levels
Support Zone: 0.6510 – 0.6520
Resistance Zone: 0.6535 – 0.6545
Target: 0.6535 (previous weak high / resistance)
Bias
Bullish intraday bias – looking for confirmation of a CHoCH or strong bullish candle close above the trendline for entry opportunities toward the resistance zone.
Invalidation
A clean break and close below 0.6510 would invalidate the bullish setup and suggest continuation of the bearish structure.
Summary
Watch for bullish confirmation from the support zone.
A breakout above the descending trendline could trigger a move toward 0.6535 – 0.6540.
Maintain caution around session opens (London/New York) for liquidity grabs.

USD/JPY - Key Resistance Test with Dual Scenario SetupBias: Neutral – Awaiting Reaction at Key Resistance Zone
Structure: Price is currently in a short-term bullish structure, supported by an ascending trendline while approaching a key resistance area.
Technical Overview
Resistance Zone: Price is approaching a significant resistance level marked by previous liquidity and supply, where a weak high was formed.
Trendline Support: The market has respected the rising trendline, indicating consistent bullish pressure from lower levels.
Session Structure: Tokyo and London sessions show multiple CHoCH and BOS events, highlighting active liquidity grabs before directional continuation.
Strong Low: A strong structural low remains protected, confirming current bullish order flow.
Current Setup
Price is moving toward the resistance zone. Two potential scenarios exist:
Bullish Continuation: A clean breakout above resistance could target higher liquidity levels near 154.800–155.000.
Bearish Rejection: If price fails to break the resistance and shows a CHoCH to the downside, a retracement toward the trendline support or 154.000 could occur.
Wait for confirmation before entering—either a breakout retest for longs or bearish structure break for shorts.
Targets
Upside Target: 154.800–155.000 (liquidity above weak high).
Downside Target: 154.000 (liquidity below recent lows).
Invalidation
Bullish scenario invalidated: If price breaks below the trendline support and closes under 154.000.
Bearish scenario invalidated: If price closes decisively above 155.000.
Summary
USD/JPY is testing a key resistance zone while holding bullish structure from the trendline. The next reaction around this zone will determine whether price continues upward or corrects back toward lower liquidity areas. Traders should wait for a clear structural confirmation before committing to either direction.

USD/CHF 15m Reversal PlayBias: Bullish Reversal Setup
Structure: Price has been trading within a descending channel, showing multiple Breaks of Structure (BOS) and Changes of Character (CHoCH), suggesting potential exhaustion of the bearish leg.
Technical Overview
Descending Channel: Price has respected both upper and lower bounds of the channel, indicating a controlled bearish structure.
Support Zone: Price has reached a strong support level aligned with the bottom of the channel, where demand has previously entered the market.
Weak Low: A weak low has been formed, hinting at possible liquidity sweep before a reversal.
Strong High: A strong high remains unmitigated, providing a clear upside target area.
Current Setup
Price is currently reacting at the support zone after extended bearish movement.
Expecting a potential bullish reversal from this level, supported by liquidity grab beneath the weak low.
Confirmation for long entries may come after a CHoCH or BOS to the upside, breaking the descending channel structure.
Targets
Primary Target: 0.80800 area (mid-channel and structure retest).
Extended Target: Resistance zone near 0.80950–0.81000 if bullish momentum strengthens.
Invalidation
Setup invalidated if price closes below 0.80300, confirming a clean break beneath support.
Summary
USD/CHF is testing a key support zone within a descending channel. A potential reversal setup is developing, with bullish confirmation awaited before targeting the higher resistance zone. Patience for structure shift confirmation is advised before entering long positions.

EUR/GBP 15m – Rejection from Key Resistance Zone Targeting Weak Bias: Bearish
Structure: Market structure shows multiple Breaks of Structure (BOS) and Change of Character (CHoCH), confirming bearish momentum on lower timeframes.
Technical Overview
Resistance Zone: Price has reached a strong resistance area (highlighted in orange) formed by previous highs and a key supply zone.
Strong High: The current high aligns with a major structure point, suggesting potential for a liquidity grab or rejection.
Weak Low: Liquidity is resting below the most recent swing low.
Sessions: Price behavior across the Tokyo and London sessions indicates repeated liquidity sweeps followed by bearish continuations.
Current Setup
Price has tapped into the resistance/supply zone after a strong bullish impulse.
Expecting potential distribution and rejection from this area.
A possible short opportunity could form once bearish confirmation appears (for example, a CHoCH or BOS to the downside).
Targets
Primary Target: 0.87800 area (previous low and liquidity zone).
Extended Target: Below 0.87700 if bearish momentum continues.

AUDNZD - EXTENDS RALLY AMID HAWKISH RBA TONESymbol - AUDNZD
AUDNZD continues to hold its upward momentum, supported by fundamental divergence between the two economies. The Australian dollar remains strong and has been outperforming the New Zealand dollar since the RBNZ implemented an aggressive 50 basis-point rate cut, while the RBA has stayed on hold due to persistent inflation concerns.
Today’s move is largely driven by the Reserve Bank of Australia’s hawkish tone, which has further strengthened the AUD. The pair has been trending higher without any notable pullbacks or corrections, and several technical indicators now suggest potential exhaustion in the ongoing uptrend.
A possible reversal setup could form if price action begins to show rejection patterns near key resistance zones, offering short-term trading opportunities.
Resistance levels: 1.1485, 1.1500
Support levels: 1.1427, 1.1378
However, keep in mind that if the RBA issues any additional hawkish statements or policy measures, it could further boost AUD strength - potentially driving AUDNZD higher before any meaningful correction takes place.

GBPJPY 15m | Range Breakdown in Progress Bearish Continuation Price has been consolidating within a clear range between the marked Resistance (≈203.25–203.50) and Support (≈202.25–202.35) zones. Multiple CHoCH (Change of Character) events confirmed short-term shifts in structure during both the London and Tokyo sessions.
Recently, we saw:
A rejection from resistance and formation of a weak high, suggesting exhaustion in buying momentum.
A clean break of structure to the downside during the London session, with price now retesting the lower boundary of the range (support zone).
If price fails to reclaim the support zone and confirms bearish structure, we can expect continuation to the downside toward the target area around 201.50, aligning with liquidity resting below previous lows.
Key Levels:
🟩 Resistance: 203.25 – 203.50
🟩 Support: 202.25 – 202.35
🎯 Target: 201.50
Bias: Bearish continuation below support

XAU/USD Intraday Plan | Momentum Strong, Resistance AheadGold continued its bullish move, breaking above the 4074 and 4115 resistance levels and pushing up into the 4153 zone. Price is now showing early signs of slowing momentum at this level, which has acted as a reaction area in the past.
Price is currently trading around 4128, still well above both the MA50 and MA200. However, buyers need to hold above 4115 to maintain the upside. A clean break above 4153 could open the way toward 4197 next.
If price fails to hold above 4115, we could see a pullback first into 4074, and if selling pressure deepens, the 4027 level and the First Reaction Zone (3984–3955) remain key areas where buyers have previously stepped back in.
📌 Key Levels to Watch
Resistance:
4,153
4,197
Support:
4,115
4,074
4,027
3,984
3,955
3,921
3,884
🔎 Fundamental Focus
This week remains highly sensitive due to ongoing developments around the U.S. government shutdown.
Today is a U.S. bank holiday, meaning liquidity may be lower, we may see exaggerated moves and less stable price action.

BTC/USD – Bullish Reversal from 15m Order BlockPrice is currently reacting from a key bullish order block after forming a clear CHoCH near the strong low, suggesting potential accumulation and bullish intent. As long as the order block holds, buyers may drive price toward higher liquidity areas.
Buy Entry: 104,900 – 105,100
Targets:
TP1: 106,400
TP2: 107,200
Invalidation: Break below 104,700

Xau/Usd – Weak High Sweep & Bearish Reversal SetupPrice has been respecting an ascending trendline, forming a series of BOS (Break of Structure) events during the climb. However, the most recent price action shows clear signs of exhaustion near a weak high, suggesting a potential shift in sentiment.
Key Observations
1. Trendline Resistance Break
Price has broken out above the diagonal trendline after multiple bounces.
The breakout appears shallow, lacking strong continuation — signaling possible liquidity grab rather than genuine bullish strength.
2. ChoCH at the High
A Change of Character (ChoCH) has formed near the Tokyo session high, indicating that bullish momentum is weakening.
This often signals the first early sign of a potential reversal on the lower timeframe.
3. Weak High Taken
The breakout wick suggests price may have targeted liquidity above the weak high and is now showing hesitation.
This setup is consistent with a distribution / top formation before a deeper move down.
4. Potential Bearish Scenario
If bearish follow-through confirms:
• TP1: ~4075
First major liquidity pool and inefficiency level.
• TP2: ~4000
A deeper downside target aligning with a previous structural demand and imbalance fill.
Summary
Price has reached an extended top, swept the weak high, and printed a ChoCH — all signs of a probable bearish reversal setup.
Confirmation is required through a break of internal structure, after which a move toward TP1 and TP2 becomes more likely.

GBP/USD – Bullish Reversal Setup Forming Above Key SupportPrice on GBP/USD (15M) is consolidating between a key resistance zone around 1.3180–1.3190 and a support area near 1.3135–1.3145. The pair recently broke below the ascending trendline, indicating potential short-term weakness.
If price retests the support zone and holds, a bullish reversal could occur, targeting the resistance area and possibly a breakout toward 1.3190+ (TARGET zone).
However, a clear close below the support zone could invalidate the bullish setup and open the way for deeper downside continuation.
Key Levels:
Resistance: 1.3180 – 1.3190
Support: 1.3135 – 1.3145
Target: 1.3190+
Bias: Bullish above support; bearish if price breaks and closes below 1.3135

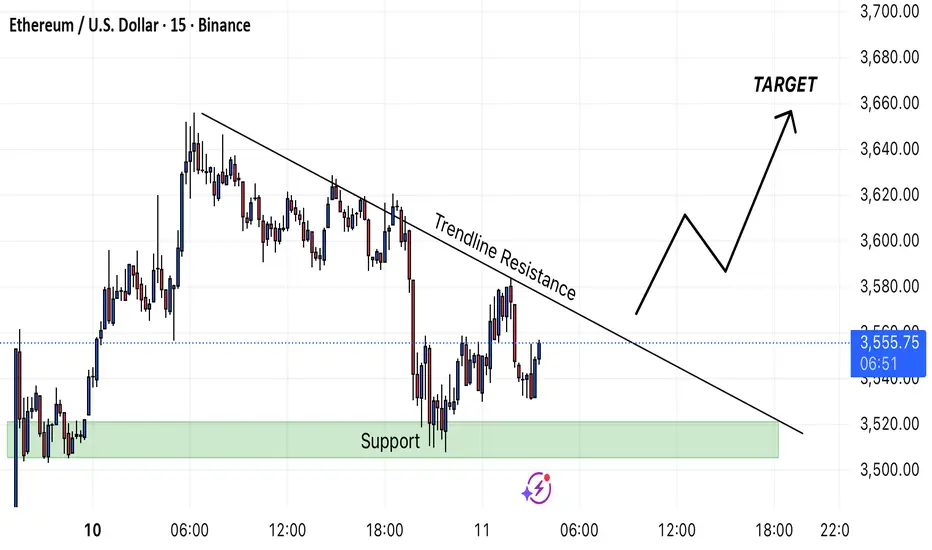
ETH/USDT – Trendline Breakout Setup FormingEthereum is currently consolidating near the $3,550 level after a short-term pullback. Price is moving within a descending trendline acting as dynamic resistance, while the green zone around $3,510–$3,530 is providing a strong support base.
A breakout above the trendline resistance could confirm a shift in short-term momentum, potentially leading to a bullish move toward the $3,650–$3,675 target area.
Key Levels:
Support: $3,510 – $3,530
Resistance: $3,575 – $3,600 (trendline breakout zone)
Target: $3,650 – $3,675
Trading Plan:
Bullish Scenario: Wait for a confirmed breakout and retest of the trendline before entering long positions toward the target zone.
Bearish Scenario: If price rejects the trendline and breaks below support, expect a potential retest of $3,480–$3,500.
Summary:
ETH is showing signs of accumulation at support. A clean breakout above trendline resistance would likely trigger bullish continuation in the short term.
AVAX/USDT – Trendline Breakout and Pullback SetupPrice is currently testing the ascending trendline after getting rejected from the $17.80–$18.00 resistance zone. If the trendline breaks and a retest confirms resistance, we could see a bearish move toward the $17.00–$16.90 support area.
Key Levels:
Resistance: $17.80–$18.00
Support: $17.00–$16.90
Bias: Bearish if price breaks below the trendline
Target: Support zone around $17.00
Trade Idea:
Watch for a clear break and retest of the ascending trendline. A rejection below resistance confirms short opportunities toward the support area.

Xrp/Usd - Approaching Resistance; Possible Trendline Break AheadPrice is currently trading around 2.33, testing a key resistance zone (highlighted in green). The pair has been respecting a short-term ascending trendline support, but momentum is weakening as price approaches the resistance area.
A potential bearish setup could form if price fails to break and close above this resistance level. A confirmed break below the trendline support may trigger a correction toward the 2.26–2.24 target zone, aligning with previous structure support.
Key levels:
Resistance: 2.33–2.34
Support (target zone): 2.26–2.24
Trend bias: Bearish rejection from resistance
Trading idea: Watch for rejection signals or a clean break below trendline support for a possible short setup toward the 2.24 area. A strong breakout above 2.34 would invalidate the bearish view.

DOGE/USDT – Key Breakout Zone Approaching Between $0.16 and $0.1Current Price: $0.1772
Trend: Short-term uptrend supported by an ascending trendline.
Support Zone: $0.1600 – $0.1660 (marked in red).
Resistance Zone: $0.1880 – $0.1920 (marked in green).
Scenarios:
Bullish Case:
If DOGE breaks and closes above the resistance zone, continuation towards the next target at $0.2100 is likely.
Watch for a strong candle breakout with volume above resistance for confirmation.
Bearish Case:
If DOGE fails to hold the trendline and breaks below it, price may retrace back to the support zone around $0.1600.
A confirmed breakdown below support could open room for deeper correction.
Summary:
DOGE is trading between key support and resistance. A breakout above $0.1900 could trigger bullish momentum toward $0.21, while a breakdown below $0.1700 may lead to a retest of $0.16. Traders should wait for confirmation before entering positions.
