Sonic Near Strong Support, Eyes 15% Rally Toward $0.36 TargetHello✌️
Let’s analyze Sonic’s price action both technically and fundamentally 📈.
🔍Fundamental analysis:
Sonic Token’s Fee Monetization lets developers keep up to 90% of fees their apps make, boosting growth by rewarding active builders. This approach helped other projects grow 20-40% TVL early on.🚀
📊Technical analysis:
BINANCE:SUSDT shows solid volume near a strong daily support; if it holds, a 15% upside toward $0.36 looks likely. Watching this level is key for a potential bounce.📊🔍
✨We put love into every post!
Your support inspires us 💛 Drop a comment we’d love to hear from you! Thanks, Mad Whale
Susdt

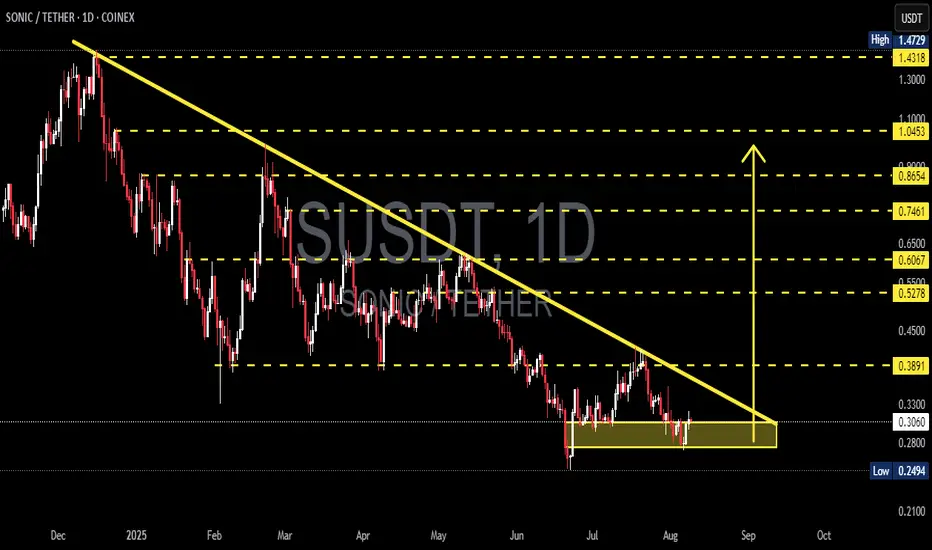
SONIC/USDT — Descending Triangle at Key Support!Overview
The daily chart shows a clear medium-term downtrend (well-defined descending trendline) meeting a strong horizontal support zone around 0.25–0.31 USDT (yellow box). Current price ≈ 0.3059 USDT. This structure forms a descending triangle or accumulation range, signaling that the market is in a decision phase — either a bullish breakout or a bearish continuation.
---
Key Levels
Current Price: 0.3059
Support Zone: 0.2494 – 0.305 (historical low at 0.2494)
Descending Trendline Resistance: ~0.33–0.35 (dynamic)
Next Resistances: 0.3891, 0.5278, 0.6067, 0.7461, 0.8654, 1.0453
Breakdown Measured Target: ~0.11 (if 0.2494 breaks)
Potential % moves from current price:
To 0.3891 ≈ +27.2%
To 0.5278 ≈ +72.5%
To 0.2494 ≈ −18.5%
To 0.11 ≈ −64%
---
Pattern & Interpretation
Main Pattern: Descending trendline + horizontal support = descending triangle (bearish bias unless broken to the upside).
Bearish Signal: Lower highs structure, price still under the descending trendline, supply pressure dominant. A daily close below 0.2494 with high volume = breakdown confirmation.
Bullish Signal: Daily close above the trendline (~0.33–0.35) with strong volume, followed by a successful retest = breakout confirmation. Extra confirmation if price breaks and holds above 0.3891.
---
Scenarios
Bullish
1. Break & daily close above trendline (~0.33–0.35) with rising volume.
2. Retest holds as support.
3. Targets: 0.3891 (+~27%), then 0.5278 (+~72%).
4. Stop-loss: below support box (~0.28 or safer < 0.2494).
Bearish
1. Daily close below 0.2494 with strong volume = breakdown.
2. Measured move target ≈ 0.11.
3. Conservative target: psychological zones 0.18–0.15.
4. Stop-loss for shorts: above 0.305–0.33.
---
Trading Notes
Conservative Long: Wait for breakout & retest above trendline.
Aggressive Long: Enter near support (0.26–0.30) with tight stop below 0.2494.
Short: Only after confirmed breakdown below 0.2494.
Always watch daily close + volume to avoid false signals.
---
Conclusion
Current trend is bearish, but the strong 0.25–0.31 support keeps the possibility of a short-term rebound alive.
Decision point: Breakout above 0.35 → bullish rally, Breakdown below 0.2494 → extended sell-off.
Risk management is key — use stop-losses and position sizing.
#SONIC #SONICUSDT #CryptoAnalysis #SupportResistance #DescendingTriangle #Breakout #Altcoin #RiskManagement
S - SONIC 1DSonic lacks the buying volume to break through its resistances.
The project, after a name change, has become Matic 2.
I expect that we'll soon reach support levels of 30 cents and 25 cents after the pullback is complete. If these supports are broken, the next support levels will be 20 cents and 17 cents.
If the 40 to 43 cent resistance breaks with high volume, there's a possibility of growth to 50 cents. If 50 cents is broken, growth to 63 cents becomes possible.

Sonic meme Goglz looking good for explosive moveSonic airdrop in a few days. I will be very surprised if Sonic's main memecoin Goglz doesn't ride the wave a bit. The graph looks good and with some momentum and a continued strong market, 35% TP shouldn't be too far off. Who knows where Sonic and Goglz will be in November/December 2025.
This is a risky idea for those who like memecoins and high risk. I like the timing of the graph and Sonic airdrop (stimulus meme money).

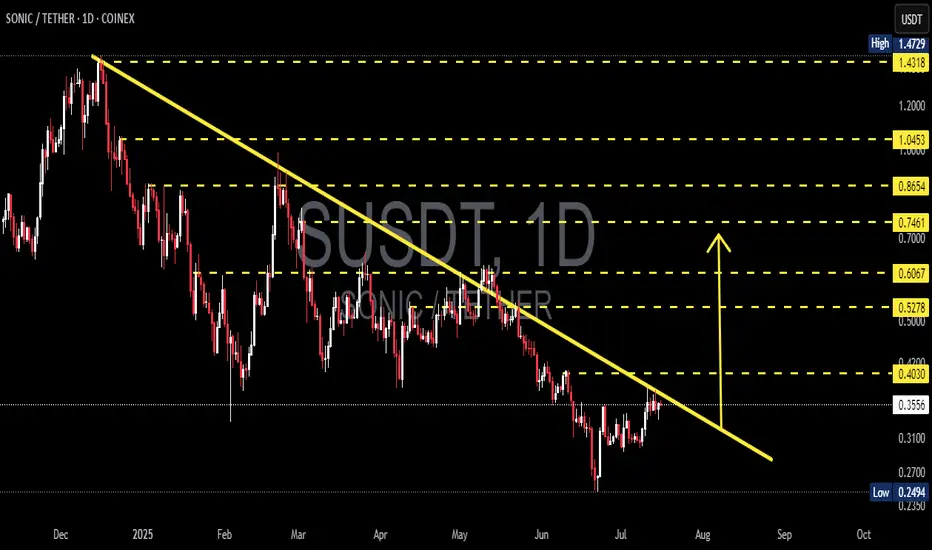
SONIC/USDT Breakout in Progress? Watch This Critical Level Close🧠 Technical Breakdown – Daily Chart (1D, Coinex)
The SONIC/USDT pair is currently exhibiting a textbook descending trendline breakout setup, formed over the past 7+ months. This long-term downtrend has been respected since late November 2024, connecting multiple lower highs and establishing a well-defined bearish structure.
However, recent price action shows a potential trend reversal as the pair consolidates tightly near the apex of the structure, with signs of breakout momentum building.
📐 Pattern Identification:
✅ Falling Wedge / Descending Triangle
✅ Continuous lower highs connected by a descending trendline
✅ Support held above $0.25 (strong demand zone)
✅ Price now testing the upper boundary of the trendline
This is a classic bullish reversal pattern—especially when price breaks out after long-term compression.
🚀 Bullish Scenario:
Should SONIC successfully break and close above the $0.4030 level (trendline + horizontal resistance), it could unlock a wave of bullish momentum. Here are the key upside targets based on Fibonacci retracement from the previous high ($1.4729) to the local low ($0.2494):
🎯 Resistance Level Significance
$0.5278 0.382 Fib – First major target post-breakout
$0.6067 Key confluence level – psychological barrier
$0.7461 0.618 Fib – Bullish continuation zone
$0.8654 High momentum extension
$1.0453 0.786 Fib – Reversal confirmation
$1.4318 Retest of the all-time high
If volume supports the breakout, we could see a sharp move toward these zones.
🧨 Bearish Scenario:
If price fails to break out and gets rejected from the trendline:
It could retrace back toward $0.3100 and $0.2700
A daily close below $0.2494 (previous low) would invalidate the bullish setup, signaling potential continuation of the downtrend
Traders should monitor RSI divergence and volume drop as warning signs
📌 Why This Setup Matters:
This is not just a short-term play. A successful breakout here signals the end of a multi-month downtrend and the potential start of a new macro uptrend. SONIC has been heavily compressed — and the tighter the coil, the bigger the move.
Smart money often enters before the breakout confirmation. Monitor for volume surges, candle structure changes, and key breakout retests.
✅ Summary:
🔄 Trendline breakout imminent
🟢 Watch for breakout confirmation above $0.4030
🔴 Breakdown below $0.2494 invalidates the bullish thesis
🧭 Fibonacci levels offer reliable target zones for profit-taking
This is a critical make-or-break zone for SONIC/USDT. Traders, be ready.
#SONICUSDT #BreakoutSetup #AltcoinAlert #CryptoAnalysis #TrendReversal #TechnicalAnalysis #CryptoTA #Altseason #FibonacciLevels #PriceAction
Sonic Moves Next · Expect Massive Growth Coming Weeks —300% EasyTwo pairs-projects will be moving strongly in the coming weeks, Sonic and Usual. This is the chart for SUSDT (Sonic) on the daily timeframe.
Notice how the action is moving back above the 3-February 2025 low (bullish). Notice the stop-loss hunt event recently. This events marks a bottom once it happens. After the event we see growth.
Finally, notice the very strong increase in trading volume. SUSDT is trading safely above EMA34. All these signals confirm strong growth in the coming weeks starting now basically, it is already happening as the action has been bullish since 22-June.
I am always giving you the best charts, the best timing in the Universe with the best results. I will continue to share daily but you need to follow. You can get notifications each time I publish and in this way you can be up to date with the Cryptocurrency market, the altcoins are moving ahead and this only happens once every four years. There are bullish waves in-between the bear market and transition years, but nothing like 2025.
The 300% on the chart is an easy target. This target can be achieved short-term maximum mid-term. Imagine the 100 years old index funds, it would take you 30 years to earn 300%. Oh my god! Leave that to your grandparents this is not for us.
My heart goes out to all the people still buying index funds related to the stock market. It is like using floppy disk still in the year 2025, we have USB sticks and smartphones, floppy disk were discontinued long ago. Buying SPX index funds and such stocks instead of Crypto is like buying CD-roms to store music, we streaming now not even MP3.
The future of finance is Crypto. Altcoins is the way to go. If you are already in this market you are ahead of the pack. You will look like a genius 10, 15, 20 years from now. For you and for me it is normal but actually, only the minority knows well enough the game. There is plenty of room left available for growth. Crypto is young.
Namaste.

Long Sonic (S) - before altcoin seasonSonic (S) - One of the strongest coins when it comes to fundandamentals.
Now listed on Coinbase. I expect more good news to come soon.
The risk reward now is incredible good for investors.
I think it is likely that we will see a bounce between 0.30-0.31 to set a higher low. that could be a killer entry before the altcoin season kicks off.
My idea is to buy and hold
I see 0.30 as a really good long term investment entry.
No financial advice.

The Altcoins Bull Market is Here: Sonic Enters New Uptrend"Everything can change in a day."
It is amazing just how fast everything can change. One day the market is bearish, it is the end; the next day everything is green and we are certain of a strong bullish wave. Watch-out, stay alert! Everything can change in a day.
Everything is already changing for the better and this is great. The greatest part of all is the fact that we are early, extremely early and us knowing that this bullish wave will be the biggest since 2021.
If you are reading this now you are blessed. You are very smart, you waited patiently or simply, you work within the Cryptocurrency space. The time is now. Take advantage of all the opportunities all around you because soon they will be gone. There will be growth long-term but bottom prices only last for a few days.
Technical analysis
SUSDT (Sonic) already produced a strong rounded bottom, high volume and ready to break the downtrend. The end of a downtrend leads to an uptrend; uptrend means long-term growth.
Thank you for reading.
Namaste.

Sonic putting in some work for a reversalS gave us the BTD opportunity, now are we going to take it? It fell below the previous bottom and caused a bit of pain. However, look at that volume bar! If the price can reclaim its previous structure, it's a good thing.
Full TA: Link in the BIO

SUSDTAnalysis is the same analysis, it just seems like the type of pattern is different... we have another low and then a high...

SUSDT 1D AnalysisS ~ 1D Analysis
#S Buy back gradually from here if you still have confidence in this coin with a short term target of at least 15%+ from here.

SUSDT - 1WThe previous bullish analysis failed and I currently expect a correction to the range of 0.3 to 0.33 cents...

S (Ex FTM) UpdateS is Preparing for a Key Liquidity Grab and Potential Reversal
Previously, S swept the liquidity from the upside and formed a zig-zag corrective structure within a descending channel. Following a clean breakdown, it has struggled to recover — despite broader bullish conditions in the market.
Now, the structure is showing strong signs of a potential long-side liquidity grab in the coming days or weeks. This setup often marks the final phase of accumulation before a major upside move.
Additionally, the price action aligns perfectly with Fibonacci extension levels, particularly around the $0.38 zone, which could act as a key support and entry area for long positions.
A decisive reaction from this zone could trigger the beginning of a strong reversal, leading to the next impulsive leg.
— Thanks for reading.

S/USDT Potential UpsidesHey Traders, in today's trading session we are monitoring S/USDT for a buying opportunity around 0.4300 zone, S/USDT is trading in an uptrend and currently is in a correction phase in which it is approaching the trend at 0.4300 support and resistance area.
Trade safe, Joe.

SUSDTAfter forming a Diametric pattern and then correcting after that, the price is now ready to move to the specified range...

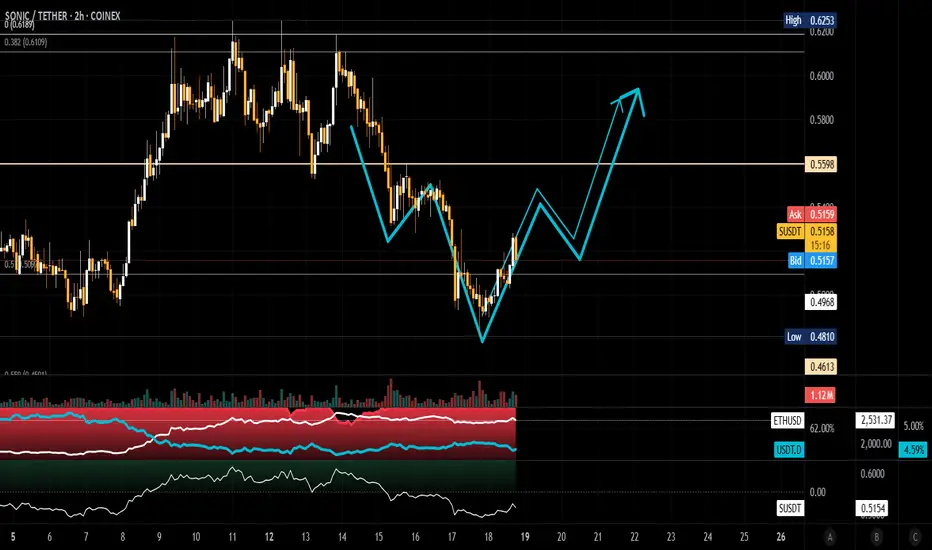
TradeCityPro | S: Trendline Break Signals Key Support Retest👋 Welcome to TradeCity Pro!
In this analysis, I’m going to review the S coin—one of the Layer 1 coins for the Sonic network.
💥 This coin currently holds a market cap of $1.43 billion and ranks 58th on CoinMarketCap.
⏳ 1-Hour Timeframe
On the 4-hour chart, as you can see, there’s a large range box between the 0.3939 and 0.6147 levels where price has been moving sideways.
🔍 A key support zone also exists between 0.45 and 0.46, which has received strong bullish reactions, pushing the price upward toward the 0.6147 top via a trendline.
✔️ Currently, this trendline has been broken, and a new support level has formed at 0.4888, which has been tested several times.
✨ If this 0.4888 level breaks, a short position targeting the 0.45 zone and 0.3939 becomes viable.
📈 For a long position, the first trigger is the 0.5266 level. A breakout here would confirm support at 0.4888 and open the path toward the 0.6147 resistance.
🎲 The RSI oscillator is hovering near the 50 level. A sustained move above this could increase the likelihood of the bullish scenario playing out.
📝 Final Thoughts
This analysis reflects our opinions and is not financial advice.
Share your thoughts in the comments, and don’t forget to share this analysis with your friends! ❤️

SONICUSDT 1D Analisis S / SET:SONIC ~ 1D Analisis
#S / #SONIC Buy gradually from here if you still have confidence in this coin with a short term target of at least 10%+ From here.

updateIs Sonic forming an ascending triangle? Sonic is acting confusingly and the market maker is probably planning a big rally after collecting all of Sonic from the public.
S = 55$
S/USDT Potential UpsidesHey Traders, in today's trading session we are monitoring S/USDT for a buying opportunity around 0.5850 zone, S/USDT is trading in an uptrend and currently is in a correction phase in which it is approaching the trend at 0.5850 support and resistance area.
Trade safe, Joe.

SUSDT - This opportunity might not come around again.!All tokens built on the Ethereum network pumped yesterday as ETH moved up by just 4%, and SONIC (S) stood out as the top performer among them, surging by around 22%.
Currently, the coin has formed a symmetrical triangle pattern, which has been broken to the upside with a massive green candle. It's now retesting the 0.382 Fibonacci level — a key zone to watch for continuation.
This is a massive investment opportunity to buy the token at around $0.55 only.
The long-term targets for S in 2026 are insane — the most conservative target for now is $1.20.
Best regards Cecilion🎯

SUSDT Potential UpsidesHey Traders, in today's trading session we are monitoring SUSDT for a buying opportunity around 0.4890 zone, SUSDT is trading in an uptrend and currently is in a correction phase in which it is approaching the trend at 0.4890 support and resistance area.
Trade safe, Joe.

Sonic is at a good level to get the support it needsS is going sideways in a tight range. RR is as good as it gets. Trend and momentum oscillators are showing signs of bullish strength, however, Sonic price action has not left the station. Buy low, sell high.
Full TA: Link in the BIO

S (EX FTM) Update (4H)Like many other altcoins, S has formed an Inverse Head and Shoulders pattern, signaling a potential trend reversal.
Additionally, a bullish flag formation has broken out on the lower timeframes, further confirming the upward momentum.
The current price structure appears suitable for long positions, especially with confluence from multiple technical signals.
A conservative target lies around the $0.64 level, based on the measured move projections from the flag and neckline breakouts.
— Thanks for reading.
