Avanti Feeds Ltd – Breakout Watch
📌 Buy Zone: ₹856
🎯 Target: ₹935
🛑 Stoploss: ₹812
Price action is testing a descending trendline on the daily chart. Volume spike and RSI momentum suggest a potential breakout. Risk-managed entry near ₹856 could offer a favorable reward-to-risk setup.
🔍 Disclaimer: For educational purposes only. Not SEBI registered. Do your own research before investing.
Swingtrade

EUR/USD Decision PhaseEUR/USD Decision Phase
Recent candles indicate a slowdown in upside follow-through, implying that short-term positioning may be crowded. This pause does not immediately invalidate the broader constructive tone but introduces the risk of a corrective rotation as liquidity is rebalanced. The projected move on the chart highlights a scenario where price may seek efficiency before determining the next directional leg.
Overall conditions suggest the market is transitioning from expansion into evaluation. Continuation higher would require renewed participation, while failure to attract follow-through could lead to a deeper reset driven by profit-taking and short-term repricing. Patience is advised as the market reveals whether this phase resolves through continuation or corrective realignment.
Price action reflects a market that has recently expanded after a prolonged phase of balanced participation. The sequence of higher intraday pushes shows growing initiative from buyers, supported by repeated structure continuation and shallow pullbacks, suggesting confidence rather than urgency. Momentum has remained constructive, with price spending more time advancing than correcting, a sign of controlled accumulation rather than emotional buying.
Recent candles indicate a slowdown in upside follow-through, implying that short-term positioning may be crowded. This pause does not immediately invalidate the broader constructive tone but introduces the risk of a corrective rotation as liquidity is rebalanced. The projected move on the chart highlights a scenario where price may seek efficiency before determining the next directional leg.
Overall conditions suggest the market is transitioning from expansion into evaluation. Continuation higher would require renewed participation, while failure to attract follow-through could lead to a deeper reset driven by profit-taking and short-term repricing. Patience is advised as the market reveals whether this phase resolves through continuation or corrective realignment.

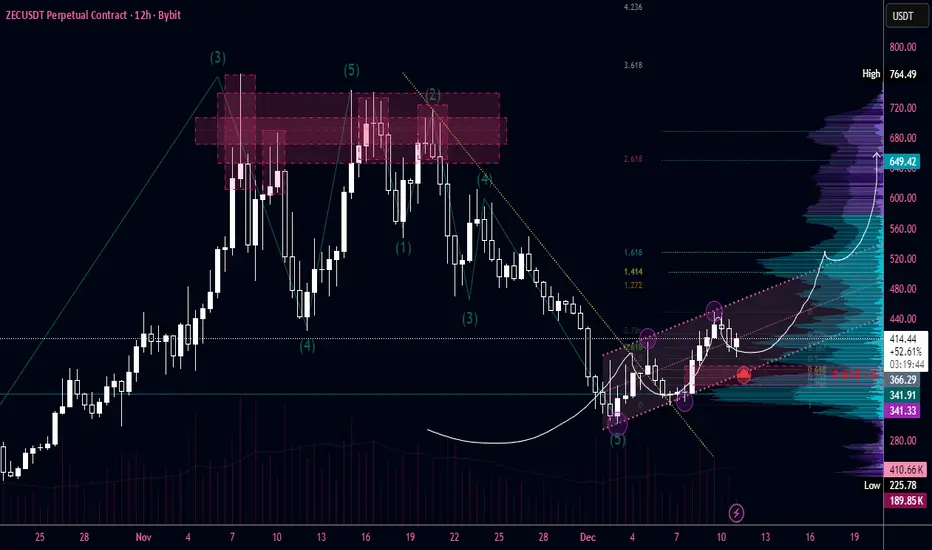
#ZEC — R:R 1:11 Target to update 765 from currentBINANCE:ZECUSDT.P
A very promising asset with a trending movement.
All assets are currently in roughly the same situation.
Here, the price has completed its wave cycle and is beginning to reverse to renew the 765 high. We cannot be sure whether it will be renewed or not.
But this is an excellent entry point to take 2 take. I am sure that the price will work out the POE level and exit the channel. The chart shows frequent touches of the channel walls.
After the resistance wall, the price is lazily moving towards its FVG, which it created through momentum. There is a break in the structure, entry from FVG 0.618 - 0.702 (exactly in the middle of FVG 12H).
Even if we don't manage to open a position, we have two targets and can open a position after the channel breaks on a retest and still have a good RR. In this trade with my POE, it is 1/11. I will be patient.
At the 1.618 - 1.272 Fibonacci level zone, there is a large HVN, followed by an equally important one at 2.618 with very strong resistance and liquidity, where the price is likely to go without difficulty.
I set small stops in such cases because I plan to go far on the price. In case of a breakout of 0.702-0.786 and the absence of a sharp impulse in the long, I would prefer not to open a position.
Ethereum - 4H Structure Call Playing Out, Daily Breakout.Ethereum Technical Breakout: 4-Hour Setup from December 8th Now Validated on Daily Chart
Our December 8th technical call on Ethereum based on 4-hour chart structure has materialized into a clean daily timeframe breakout. This analysis reviews the original setup, examines the price action that followed, and assesses the current structural picture as ETH pushes into higher territory with confirmed momentum.
🎯 Original Setup Recap (December 8th):
What We Identified:
On the 4-hour chart, Ethereum was showing:
Consolidation after a pullback to key support
Higher lows forming during the correction phase
Volume compression indicating accumulation
Momentum indicators resetting from overbought conditions
Critical support holding at structural levels
The Call:
Long position anticipation based on 4-hour structure suggesting the correction was nearing completion and continuation was probable. The setup offered defined risk below support with upside targets at previous resistance zones.
Why It Mattered:
The 4-hour timeframe captures intraday structure while filtering out noise from lower timeframes. When 4H patterns align with broader trend direction, they often precede significant multi-day moves that eventually appear on daily charts.
📈 What Happened Next:
Price Action Validation:
Following the December 8th structural read, Ethereum:
Held the identified support zone without breaking down
Began forming higher highs and higher lows on the 4-hour chart
Broke above intermediate resistance levels with increasing volume
Momentum indicators shifted from neutral to bullish
Daily chart structure began reflecting the 4H anticipation
The Breakout:
What started as a 4-hour setup has now translated into a clean daily chart breakout. This progression from lower timeframe structure to higher timeframe confirmation is textbook technical development - the 4H provided the early signal, the daily now provides the broader validation.
📊 Daily Chart Breakdown:
Current Structure:
Switching to the daily timeframe reveals:
Clean breakout above resistance: Previous consolidation highs have been cleared decisively
Volume confirmation: Breakout occurred with expansion in volume, not on declining participation
Momentum shift: Daily momentum oscillators flipping bullish after extended reset period
No immediate overhead resistance: Path to next major level is relatively clear
Why Daily Matters:
When a 4-hour setup evolves into a daily breakout:
Institutional participation typically increases (larger players operate on daily+ timeframes)
The move gains credibility beyond short-term speculation
Probability of continuation increases as higher timeframe traders enter
Support levels become more significant (daily structure holds better than intraday)
Key Observations:
Breakout candle characteristics: Strong close, minimal upper wick, suggesting buying conviction
Support conversion: Previous resistance now becomes support if price retests
Trend alignment: Daily now confirms what 4H structure was telegraphing weeks ago
🎯 From 4-Hour Call to Daily Confirmation:
The Progression:
December 8th (4H): Structural setup identified - accumulation phase near support
Initial Response: Price respected support, began building higher lows
Intermediate Action: 4H breakout triggered, resistance levels tested
Current State: Daily chart validates with clean breakout above consolidation
Why This Sequence Matters:
This is how professional technical analysis works:
Lower timeframes provide early positioning opportunities
Risk is defined based on structure (not arbitrary stops)
Higher timeframes eventually confirm or reject the thesis
Confirmation on daily adds conviction for position management
Key Lesson:
The 4-hour chart gave entry opportunity with tight risk. The daily chart now provides the validation that the trade thesis was correct. Traders who entered on 4H structure now have daily confirmation supporting continued upside.
📈 What the Daily Breakout Suggests:
Bullish Implications:
Next resistance target: Previous cycle highs now become the next logical objective
Momentum continuation: Daily breakout with momentum often sustains for multiple sessions
Support buffer: If price retraces, the breakout level should provide support
Trend clarity: Daily chart removes ambiguity - structure is now clearly bullish
Fibonacci Extensions:
From the correction low to breakout high, Fibonacci extension targets suggest:
1.272 extension: First projected resistance
1.618 extension: Major target zone where profit-taking typically occurs
2.0 extension: Extended target if momentum remains strong
These aren't guarantees but mathematical projections based on the measured move from consolidation.
🧠 Psychology of Early Entry vs. Breakout Chasing:
December 8th Entry (4H Structure):
Entry felt uncomfortable (price had just pulled back)
Risk was defined and relatively tight
Reward-to-risk was favorable (3:1 or better to first targets)
Required patience through consolidation period
Chasing Now (Post-Daily Breakout):
Entry feels "safer" (price is rising, daily confirms)
Risk has expanded significantly (stop would be much wider)
Reward has compressed (already moved toward targets)
Late entry often leads to getting shaken out on first retracement
The Professional Approach:
Buy structure on 4H when risk is defined. Use daily confirmation to hold position or add selectively, not to initiate at worse risk/reward.
📊 Current Trade Management Framework:
For Those In From December 8th:
Profit Taking Strategy:
First reduction: At previous major resistance (book partial profits)
Second reduction: At Fibonacci 1.618 extension (lock gains)
Final portion: Trailing stop or 2.0 extension (maximize upside)
Stop Management:
Move stops to breakeven after daily breakout confirmed
Trail stops below daily swing lows as new structure forms
Give daily structure room - don't tighten stops based on 4H noise
Position Psychology:
Daily confirmation means the trade thesis was correct. Avoid the temptation to overtrade or add aggressively here. The best risk/reward was on December 8th current management is about optimization, not aggressive scaling.
📅 What's Next?
Bullish Scenario:
Daily breakout continues with momentum
Price targets Fibonacci extensions sequentially
Minor retracements find support at breakout level
Volume remains elevated on green candles, diminishes on red
Retest Scenario:
Price pulls back to test breakout level as new support
This would be healthy consolidation, not failure
4H chart may provide re-entry or add opportunity
Daily structure remains intact unless breakout level fails
Invalidation:
Daily close back below breakout level
Volume deterioration suggesting exhaustion
Momentum divergence appearing on daily chart
Fundamental shifts in crypto market conditions
⚠️ Risk Considerations:
What Could Go Wrong:
Crypto Volatility:
Ethereum can experience 10-20% pullbacks even during bullish trends. Daily breakouts don't eliminate volatility - they suggest directional bias but not linear price action.
Market-Wide Weakness:
If Bitcoin enters correction or broader crypto sentiment shifts negative, individual coin technicals become secondary to market-wide flows.
False Breakout:
Daily breakouts can fail. If price closes back below the breakout level with volume, the technical picture changes and positions should be reassessed.
Regulatory/Fundamental Events:
Crypto markets remain sensitive to regulatory news, exchange issues, and macroeconomic factors that can override technical structure.
🏆 Key Trading Lessons from This Setup:
✅ Lower timeframes identify structure early: The 4H chart provided the early read when risk was defined
✅ Higher timeframes provide confirmation: Daily breakout validates the 4H thesis was correct
✅ Best entries feel uncomfortable: December 8th near support felt uncertain - that's when risk/reward was optimal
✅ Structure over emotion: The technical setup suggested bullish resolution despite uncertainty
✅ Patience pays: Allowing the 4H structure time to develop into daily confirmation requires discipline
✅ Manage, don't chase: Use daily confirmation for position management, not aggressive late entries
📌 Summary:
Then (December 8th):
4-hour chart showing structural setup
Support holding, accumulation visible
Entry opportunity with defined risk
Now (Current):
Daily chart confirms with clean breakout
Momentum supporting continued upside
Original thesis validated by higher timeframe
Next:
Monitor daily structure for continuation
Manage positions based on daily swing points
Watch for retest of breakout as potential support
⚠️ Important Disclaimers:
This analysis is for educational purposes and reflects a technical progression from 4-hour structure to daily confirmation. It is not financial advice or a recommendation to buy or sell Ethereum or any cryptocurrency.
Cryptocurrencies are highly volatile and speculative. Daily breakouts can fail, and past performance of similar setups does not guarantee future results. The December 8th call was based on structure visible at that time - subsequent price action could have invalidated the thesis.
Ethereum carries specific risks including regulatory uncertainty, technological vulnerabilities, market manipulation, and extreme volatility. Position sizing must account for potential 20-30% drawdowns even during bullish trends.
This review examines what happened after a technical call, not a prediction of future price movement. Markets change, structure fails, and no technical pattern guarantees success.
Always conduct independent research, manage risk appropriately, and never invest more than you can afford to lose. All cryptocurrency trading involves substantial risk of loss.
✨ Community Discussion:
Did you catch the December 8th setup on the 4H chart? How do you use multi-timeframe analysis in your trading? Share your approach to transitioning from lower to higher timeframe confirmation.
📜 Read the structure. Trust the process. Manage the risk.

EUR/AUD ~ Weekly 50 EMAEUR/AUD ~ Weekly 50 EMA Rejection for 3R Upside Potential
EUR/AUD is retesting the weekly 50 EMA after a controlled multi-week pullback. This level has acted as a major dynamic support in past uptrend phases. Price is showing early signs of demand returning, creating a potential swing opportunity aiming toward the prior structure highs. With clear invalidation below the EMA zone, the setup offers a clean 3R path if momentum follows through.
📊 Technical Setup Overview
Current Status: Retesting weekly 50 EMA support
Momentum: Stabilizing after multi-week correction
Target: Return to previous swing highs
Trade Type: Higher timeframe swing setup
📈 Why This Level Matters
Weekly 50 EMA Dynamic Support
The weekly 50 EMA often defines the midpoint of strong trends. EUR/AUD has respected this moving average several times throughout the year, creating reliable inflection points during corrections.
This pullback has tapped the EMA with precision, showing early demand wicks and slowing downside tempo.
Structure Alignment
The current test aligns with a previous consolidation shelf, increasing the importance of this zone.
Large timeframe participants typically step in at these overlapping structure areas.
Trend Integrity
Despite the pullback, the higher timeframe structure remains intact. The series of higher lows is not broken and the long term bullish rhythm remains valid while price holds above this support region.
🎯 Trade Structure
Entry Consideration: Weekly 50 EMA touch zone
Stop Loss: Below the recent weekly wick low
Primary Target: Prior swing high zone
Reward Potential: Approximately 3R depending on exact stop placement
Timeframe: Multi-week hold
📰 Context Behind the Pullback
Recent weakness was driven by euro softness and short term risk flows rather than structural trend change.
These types of corrective moves often fade once higher timeframe participants re-enter at key EMAs.
As volatility cools, weekly structure becomes the dominant driver again and price tends to mean-revert toward trend direction.
📊 Weekly Chart Analysis
Structure
✓ Uptrend intact
✓ Pullback respecting major dynamic support
✓ Higher low structure still active
Momentum
✓ Selling pressure slowing
✓ No breakdown continuation
✓ Volume contraction signaling exhaustion
Key Levels
Support: Weekly 50 EMA
Target Zone: Prior swing highs
Invalidation: Break and weekly close below last wick low
🧠 Why Traders Miss These Setups
Fear of Weekly Pullbacks
Many traders interpret deep pullbacks as trend failure. Weekly EMAs often attract liquidity and are engineered for shakeouts before continuation.
Waiting for Confirmation
By waiting for a break above the weekly candle high, traders risk giving away 70 to 120 pips and compress the reward to 1R or 1.5R.
Overlooking Higher Timeframes
Intraday charts may look messy or bearish. Weekly structure tells the real story and often leads the next macro move.
📅 Expected Duration and Catalysts
Estimated Duration: 2 to 4 weeks
Potential Catalysts:
✓ Euro strength rotation
✓ Weakness in AUD from risk shifts
✓ Improvement in eurozone data
✓ Mean reversion back into trend
⚠️ Risk Factors
A clean break and weekly close beneath the 50 EMA signals trend exhaustion and invalidates the setup.
Fundamental shocks affecting eurozone or Australian macro conditions could also disrupt technical structure.
🏆 The Professional Approach
Professionals focus on:
✓ Structure over emotion
✓ Entering at dynamic support with defined risk
✓ Playing the asymmetric payoff at 3R
✓ Scaling partial profits as price approaches targets
The setup focuses on buying strength at a long term trend support rather than chasing breakouts.
📌 Key Takeaways
✓ Weekly 50 EMA touch creates high probability inflection
✓ Trend structure remains intact
✓ Upside toward previous swing highs offers clean 3R
✓ Risk defined with tight invalidation
✓ Weekly timeframe swing with strong confluence

USD/CAD - Daily Oversold Bounce Setup Into 1.40000 TargetUSD/CAD Post-News Recovery Play: 0.786 Fib Hold + DeM Oversold Signal 1.40000
The US Dollar/Canadian Dollar has pulled back to a critical support zone following recent news volatility, setting up a potential swing trade opportunity targeting the psychological 1.40000 level. Technical confluence at the 0.786 Fibonacci retracement combined with deeply oversold momentum indicators suggests this pullback may be nearing exhaustion.
📊 Technical Setup Overview:
Current Status: Holding 0.786 Fibonacci retracement
Daily Momentum: DeMarker (DeM) indicator showing extreme oversold conditions
Target: 1.40000 psychological resistance
Trade Type: Swing position - multi-day hold
📈 Why This Level Matters:
0.786 Fibonacci Retracement:
The 0.786 level represents one of the deepest retracement zones in trending markets before a reversal becomes a trend change. USD/CAD has tested and held this mathematical support level, indicating strong buying interest at current prices.
This Fibonacci level was calculated from the recent swing low to swing high and marks the zone where institutional accumulation typically occurs during healthy trend corrections.
DeMarker Oversold on Daily Chart:
The DeMarker oscillator on the daily timeframe has reached extreme oversold territory - a condition that historically precedes mean reversion moves. When DeM reaches these levels, it indicates selling pressure has reached exhaustion and momentum is primed for reversal.
Unlike intraday noise, daily DeM oversold readings carry significant weight as they represent sustained directional pressure across multiple trading sessions that is now reaching a turning point.
1.40000 Psychological Target:
Round numbers act as magnetic price levels in forex markets due to:
Order clustering from institutional and retail traders
Option strike concentrations
Psychological significance creating self-fulfilling behavior
Previous support/resistance memory at these levels
The 1.40000 level represents approximately 150-200 pips of upside potential from current support, offering favorable risk/reward for a swing position.
🎯 Trade Structure:
Entry Consideration: Current 0.786 Fibonacci support zone
Stop Loss: Below recent swing low (structure invalidation)
First Target: 1.3900 (psychological level, profit-taking zone)
Primary Target: 1.40000 (round number resistance)
Timeframe: Multi-day swing trade (3-7 days estimated)
Risk Management:
Position sizing should account for potential 50-80 pip stop loss distance. The 1.40000 target offers approximately 2:1 to 3:1 reward-to-risk ratio depending on exact entry and stop placement.
📰 Post-News Context:
Recent news events created volatility that pushed USD/CAD into this technical support zone. Post-news environments often see:
Reduced volatility as immediate reactions are priced in
Technical levels regaining importance as primary drivers
Mean reversion opportunities as emotional extremes normalize
The combination of news-driven overselling into strong technical support creates a setup where fundamental pressure has eased while technical structure remains intact.
📊 Daily Chart Analysis:
Structure:
Higher timeframe uptrend remains intact
Current pullback represents correction within larger bullish context
0.786 Fibonacci acting as demand zone
Momentum:
DeM indicator deeply oversold (condition that preceded previous bounces)
Divergence may be forming (price making lower lows while momentum stabilizes)
Volume showing signs of exhaustion rather than acceleration
Key Levels:
Support: 0.786 Fibonacci zone (current)
Resistance 1: 1.3900 (first profit-taking area)
Resistance 2: 1.40000 (primary target)
🧠 Why Traders Miss These Setups:
Emotional Comfort vs. Technical Opportunity:
After a sustained decline, USD/CAD "feels" weak and most traders assume further downside. But the best risk/reward exists precisely when sentiment is most negative and price has reached structural support.
Waiting for Confirmation:
Many will wait for USD/CAD to break above 1.3850 to "confirm" the reversal. By then, risk has expanded 50-80 pips and reward has compressed by the same amount. Entries at technical support with defined risk offer superior asymmetry.
Ignoring Daily Timeframe Signals:
Intraday traders focused on 1-hour or 4-hour charts may miss the significance of daily DeM oversold conditions. These higher timeframe signals carry more weight and have longer-lasting effects on directional bias.
News-Driven Fear:
Recent news created the selloff, making traders cautious about catching a "falling knife." However, technical analysis helps identify where the knife lands - the 0.786 Fibonacci support.
📅 Timeframe and Catalysts:
Expected Duration:
This swing trade setup could take 3-7 trading days to reach the 1.40000 target, depending on:
Broader USD strength/weakness
Oil price movements (CAD correlation)
Risk sentiment shifts
Upcoming economic data releases
Potential Catalysts:
US economic data supporting dollar strength
Weakness in crude oil (negative for CAD)
Risk-off flows benefiting USD as safe haven
Technical buying at support creating momentum
⚠️ Risk Factors:
What Could Invalidate This Setup:
Support Breakdown:
If USD/CAD closes decisively below the 0.786 Fibonacci support on the daily chart, the thesis is compromised. This would indicate the correction is deeper than typical and may target the next Fibonacci level.
Fundamental Shifts:
Unexpected dovish Fed policy signals
Surge in crude oil prices (bullish for CAD)
Risk-on environment reducing USD safe-haven demand
Canadian economic data significantly exceeding expectations
Technical Failure:
Daily DeM can remain oversold longer than expected during strong trending moves. If the broader trend has changed from bullish to bearish, mean reversion may not occur at typical technical levels.
Geopolitical Events:
Unforeseen news events could override technical structure and create renewed selling pressure regardless of oversold conditions.
🏆 The Professional Approach:
They Buy Structure, Not Sentiment:
The 0.786 Fibonacci + daily DeM oversold combination provides objective structure. Professional traders recognize this confluence as an area where probability favors reversal, regardless of how the chart "feels."
They Size for Volatility:
USD/CAD is a major pair but still experiences 50-100 pip daily ranges. Position sizing accounts for this inherent volatility while keeping total portfolio risk at 1-2% per trade.
They Accept Being Early:
The perfect bottom is unknowable. Entries at structural support with defined stops accept that price may test the level multiple times before resolving higher. This is why stop placement below structure (not arbitrary) is critical.
They Scale Out at Targets:
Rather than holding for the full 1.40000 target:
Reduce 1/3 at 1.3850 (books profit, reduces emotional pressure)
Reduce 1/3 at 1.3900 (locks gains, allows breathing room)
Final 1/3 at 1.40000 or trailing stop (maximizes upside)
This approach removes emotion from exit decisions and ensures partial profits are captured even if the full target isn't reached.
📌 Key Takeaways:
✅ Technical confluence present: 0.786 Fibonacci support + daily DeM oversold creates high-probability setup
✅ Clear target structure: 1.40000 offers 150-200 pip upside with defined reward-to-risk asymmetry
✅ Post-news environment: Emotional selling into technical support often marks turning points
✅ Risk is defined: Stop below 0.786 support provides clear invalidation point
✅ Daily timeframe signal: Higher timeframe oversold conditions carry more weight than intraday fluctuations
⚠️ Important Disclaimers:
This analysis is for educational purposes and reflects a technical view based on Fibonacci retracement levels, momentum indicators, and structural support. It is not financial advice or a recommendation to buy or sell USD/CAD or any currency pair.
Forex trading involves substantial risk of loss. The 0.786 Fibonacci support could fail, and daily DeM can remain oversold during strong trending moves. Past instances of reversals from these conditions do not guarantee similar outcomes.
Market conditions can change rapidly due to economic data, central bank policy, geopolitical events, and liquidity conditions. What appears as technical support may not hold during fundamental regime changes.
Position sizing must account for volatility and potential for stop loss to be hit. Never risk more than you can afford to lose on any single trade.
Always conduct independent analysis, consider your risk tolerance, and consult with a financial professional if needed. All forex trading involves significant risk.
✨ Your Perspective:
Are you watching USD/CAD at these levels? How do you trade Fibonacci + momentum confluence setups? Share your approach in the comments.
📜 Trade the structure. Manage the risk. Stay disciplined.

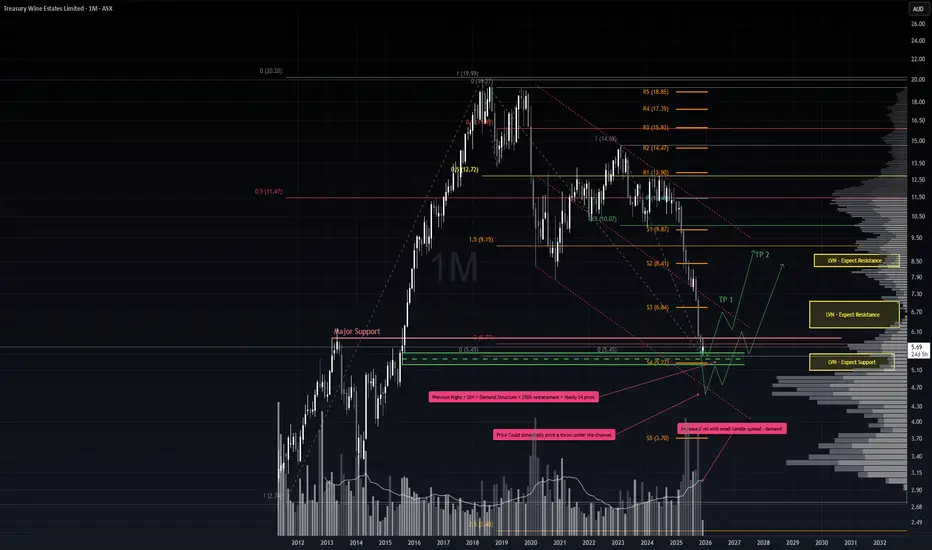
Relief Rally Incoming?It’s been a punishing stretch for TWE holders, but price action has now pulled back into a critical zone where a relief rally could emerge. The broader trend remains bearish, so any positioning here must respect that context.
Key Support Factors
1. 200% retracement from the 2018 double top.
2. Low Volume Node (LVN) zone, indicating limited price acceptance and potential for sharp moves.
3. Demand structure anchored by the August 2015 candle.
4. Historical tops acting as structural support.
5. November monthly candle showed notable demand — high volume on a narrow spread.
6. 11 consecutive weeks down in a single swing, aligning with Gann’s 7–10 bar exhaustion principle.
7. Proximity to the yearly S4 pivot, reinforcing the demand zone.
Trade Scenario 1 – Aggressive Entry
Setup: Despite no confirmed trend reversal, risk-tolerant traders could begin scaling in here, supported by the confluence of demand factors.
Stop Loss: 5.22 — just beneath the demand structure and S4 pivot.
Take Profit: Initial target at the midline (EQ) of the downward channel. If price breaks cleanly above, extend targets toward the upper bounds of the channel.
Trade Scenario 2 – Throw-Under Reversal
Setup: If the S4 pivot and demand structure fail, watch for a throw-under pattern whereby price dips below support but quickly reclaims the range.
Confirmation: A bullish hammer or doji on surging volume, ideally accompanied by negative sentiment, would strengthen the reversal case.
Take Profit: Similar roadmap to Scenario 1 — first target at the channel EQ, then potentially the upper boundary if momentum builds.
Summary
This is a high-risk, counter-trend play. The confluence of structural supports, exhaustion signals, and pivot proximity offers a tactical window for relief. However, discipline around stops and scaling is essential, as the long-term bear market backdrop remains intact.
* Note, price pathing is not time based, just the overall price movement
Buy BiogenShort Term Trading Advice by Naranj Capital
Buy Biogen
● Buy Range- 178 - 180
● Target- 188 - 190
● StopLoss- Below 180
● Potential Return- 5-6%
● Duration- 12-14 Trading Days

Gold (XAUUSD) – Don’t Get Trapped: Sell High, Buy LowGold (XAUUSD) – Structural Outlook
Price action continues to develop within a corrective framework, forming a potential A–B–C structure following the recent impulsive advance. The market is approaching a key resistance zone aligned with the 0.786 retracement , where liquidity above the internal swing high may be targeted before a broader downside continuation toward the $3,880–$3,790 demand region. A confirmed sweep and rejection from the upper boundary would strengthen the case for the final leg of the correction, completing wave (C) before a higher-time-frame bullish continuation resumes.
⚠️ Disclaimer
This analysis is provided for educational purposes only and does not constitute financial advice. Trading financial markets involves risk, and you are solely responsible for your own investment decisions. Always conduct your own research and use proper risk management.
If you found this analysis valuable, leave a like, drop your thoughts in the comments, and follow for more structured market insights.

Zcash(ZEC/USDT) | Don’t Get Caught in the Whales’ Trap🧠 ZEC/USDT – Smart Money Trap Before the Drop?
Zcash just swept liquidity below a key short-term low 👀 — now reacting from a demand zone, but volume confirms weak bullish intent.
Expect a liquidity grab + distribution phase before price dives toward the $300–$350 range, aligning with higher-timeframe imbalance fills and unmitigated demand below.
Smart Money might be engineering one last bull trap before the real markdown begins.
📉 Watch for rejection from the $620–$650 supply zone to confirm the move!
#ZECUSDT #Zcash #CryptoAnalysis #PriceAction #SmartMoneyConcepts #LiquidityGrab #BearishSetup #CryptoTraders #TradingView #Fibonacci #SwingTrade #MarketStructureBreak #Wyckoff #SMC
💬 What’s your bias — bull trap or reversal? Drop your thoughts below 👇

Title: FARTCOIN | Breakout Retest and Long-Term Structure PlayAfter a long period of compression, FARTCOIN (FART/USDT) is showing early signs of a potential trend reversal on the 1D chart.
Price has respected a descending resistance line for months while simultaneously forming higher lows on the ascending yellow trendline — signaling that bullish pressure may be building.
Currently, price is testing the intersection point between descending resistance and ascending support, forming what could be a symmetrical triangle breakout setup.
If we can hold above the breakout area and reclaim the mid-structure level (~0.40–0.42), the next technical objectives would be:
TP1: 0.56 – Retest of prior structural resistance
TP2: 0.73 – Measured move from the breakout pattern
TP3: 1.00+ – Potential full cycle expansion target
⚠️ Invalidation:
A daily candle close below 0.30 would suggest a failed breakout and continuation of the prior downtrend.
Educational Breakdown:
This setup is designed to teach how trendline confluence + structural compression can reveal early trend reversal zones.
Notice how the breakout leg aligns with a swing projection pattern, confirming momentum shift probability.
Bias:
Directional Bias: Bullish
Setup Type: Breakout + Retest (Mid-term swing)
Timeframe: 1D

Difficult and imperfect swing trade setup on BTCUSD dailyCOINBASE:BTCUSD has broken below its rising channel and is now exhibiting a downward trajectory. This shift creates a potential swing-trading opportunity arising from two distinct scenarios:
A reversal of the current downward trend, leading to a renewed bullish movement, or
A temporary pullback within the continuation of a broader bearish trend.
On the weekly timeframe, the first major traditional moving average above the current price is the 50-week moving average, positioned at approximately 100,000 USD. The daily chart reflects a similar structure: the nearest significant moving average above is again the 50-day moving average, also situated near 100,000 USD. This alignment establishes a notable—albeit high-risk—swing-trade setup. Should the price initiate even a micro bullish trend within a larger bearish context, the most probable target for such a move would be a reversion toward the 50 DMA at around 100,000 USD.
Supporting this thesis, several momentum indicators—specifically the RSI, Rate of Change (ROC), and MACD—are beginning to turn upward from recent troughs. This emerging positive momentum suggests that underlying buying strength may be forming, which would be consistent with the early stages of a bullish swing within a broader bearish structure.
A potential entry trigger on the daily chart would occur once price breaks above and remains above the 10 DMA for a sustained period (e.g., a 1- to 3-day confirmation filter, depending on risk tolerance). Historically, such moves have provided reliable signals on at least four consecutive prior occasions as depicted in the chart.
However, caution is warranted: daily closes above the 10 DMA are common, and many such moves fail to persist. This is why a multi-day filter is proposed—to increase the probability that the breakout represents a genuine shift rather than short-lived noise.
Proposed Trade Parameters
Entry: Break and sustained hold above the 10 DMA (estimated near 90,000 USD).
Take Profit (TP): Reversion to the 50 DMA (approximately 100,000 USD).
Stop Loss (SL): A daily close back below the 10 DMA (likely around 95,000 USD).
Risk–Reward Ratio: ~1:2.
Important Caveats: This setup is inherently imperfect, as both the entry and stop-loss levels are determined by moving averages and the trade itself yields a relatively modest risk–reward profile. Moreover, the rationale for a bullish retracement is based solely on technical patterns—specifically, the observation that counter-trend rallies frequently occur even within pronounced bearish phases. There is, at this point, no anticipated fundamental catalyst or macro-level justification supporting an imminent bullish move; the thesis is grounded entirely in probabilistic technical behaviour.

Buy Insmed IncorporatedShort Term Trading Advice by Naranj Capital
Buy Insmed Incorporated
● Buy Range- 188 - 192
● Target- 200 - 202
● StopLoss- Below 180
● Potential Return- 4-5%
● Duration- 12-14 Trading Days

USDCAD Alert! — Smart Money + Elliott Wave + Price Action + Fib🚨 USDCAD Wave C Correction Alert!
According to Wave Theory Confluence , we’re likely approaching the end of Wave B (Y) around the 1.4150–1.4300 zone — aligning with the 0.5–0.618 Fibonacci retracement levels. 📉
Price is showing exhaustion near this area with signs of liquidity grab (BSL hit) and smart money distribution , suggesting potential bearish reversal setups ahead. 🔍
Expecting Wave C to unfold next, targeting deeper downside correction before the next impulsive leg resumes.
📊 Key Confluences:
Elliott Wave B completion zone
Smart Money liquidity sweep
Bearish structure shift forming
Fibonacci rejection area
Fundamentals still favor short-term CAD strength
💡 Trade Idea: Watch for confirmation of bearish momentum and structure break before entering shorts toward 1.33–1.32 region.
Stay sharp — Wave C could be fast and decisive! ⚡
What’s your take, traders? 🤔
Do you think Wave C is about to drop hard or will bulls surprise us again? 🐻📉🐂
Drop your analysis 👇 — let’s see who nails the next big move! 🚀
#USDCAD #ForexAnalysis #ElliottWave #SmartMoneyConcepts #PriceAction #WaveTheory #ForexTrading #SwingTrade #Fibonacci #FXForecast #TechnicalAnalysis #TradeSetup #MarketStructure #USD #CAD #ForexCommunity

USDJPY | Institutional Sells from HTF Supply Zone (Instant ExecuUSDJPY has tapped into a higher-timeframe supply zone that aligns with the weekly sweep and 4H CHoCH, confirming potential downside momentum.
After the recent BOS, price retraced back into the previous structural supply, forming an S&S pattern (sweep and shift) within the same zone.
The setup aligns with bearish intent from institutional order flow, suggesting smart-money distribution before the next leg down.
🔹 Execution: Instant market sell from 154.15–154.20
🔹 Stop-Loss: Above 154.55 (protected high)
🔹 Target: 152.80 (Realistic TP area)
🔹 Bias: Bearish continuation into lower liquidity zones
Technical Confluence:
• W1 sweep confirms distribution phase
• 4H CHoCH + BOS = structural shift bearish
• S&S rejection inside refined M30 supply
• Liquidity resting below recent lows (152.80)
This setup respects SMC principles — liquidity sweep → structural shift → premium entry — under institutional context.
💬 Monitor for a clean M15–M5 confirmation candle close to maintain precision entry and manage partials along the way.

SANGAM (INDIA) LTD – Volume Breakout with Bullish MomentumCMP: ₹466.6
🟢 Buy Zone: ₹460–465 (on minor pullback or consolidation)
🎯 Targets:
Target 1: ₹481
Target 2: ₹490
Target 3: ₹497
🔻 Stop Loss: ₹447 (below recent swing low)
⏳ Duration: 5–10 trading days (short-term swing setup)
SANGAM (India) Ltd has shown a strong bullish breakout above the resistance zone with a surge in volume (see chart). The RSI reversal from mid-levels confirms renewed momentum. Sustaining above ₹457 could push price towards ₹490–₹497 levels in the coming sessions. A healthy retest near ₹460–₹465 offers a low-risk entry opportunity.
Risk–Reward: 1:2.5 (Favorable for short-term swing traders)
⚠️ Disclaimer:
This analysis is for educational purposes only and not financial advice. Always do your own research before investing or trading.

AAPL speculative swings, based on Quallamagie's 10/20/50.Where-ever AAPL would have good technical momentum swings. Should coincide with speculative, risk on periods. Think BTC rallies, etc. And they do.

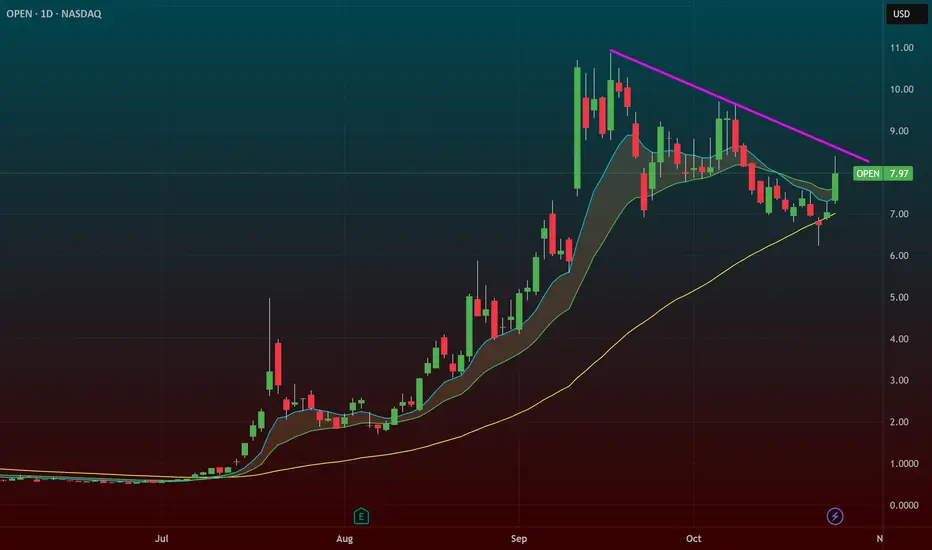
$OPEN – 50 SMA Retest with Trendline Breakout TriggerOpendoor Technologies ( NASDAQ:OPEN ) is setting up for a trendline breakout right as it tests the 50 SMA — a perfect technical spot for dip buyers to step in after a massive run.
🔹 The Setup:
After a strong multi-month rally, NASDAQ:OPEN finally pulled back into the 50 SMA, the first real test of trend support in this cycle.
Price is coiling just under a descending trendline, with an $8.50 trigger marking the breakout zone.
The consolidation is clean, volume is light, and momentum could reload quickly if the market stays hot.
🔹 Market Context:
The broader market is at all-time highs, and NASDAQ:OPEN has been one of the biggest winners in that run.
This pullback looks natural and healthy, not distributional.
Often, the first touch of the 50 SMA after a big run is where institutional buyers step back in.
🔹 My Trade Plan:
1️⃣ Entry: Watching for a breakout through $8.50 with volume confirmation.
2️⃣ Add: On strength above that level or retest of the breakout zone.
3️⃣ Stop: Below the 50 SMA — tight, well-defined risk.
Why I Like This Setup:
Trendline break + 50 SMA retest = classic continuation setup.
Big winner resting while the market is strong = ideal timing for a reload.
Risk is clean, structure is tight, and breakout potential is strong.
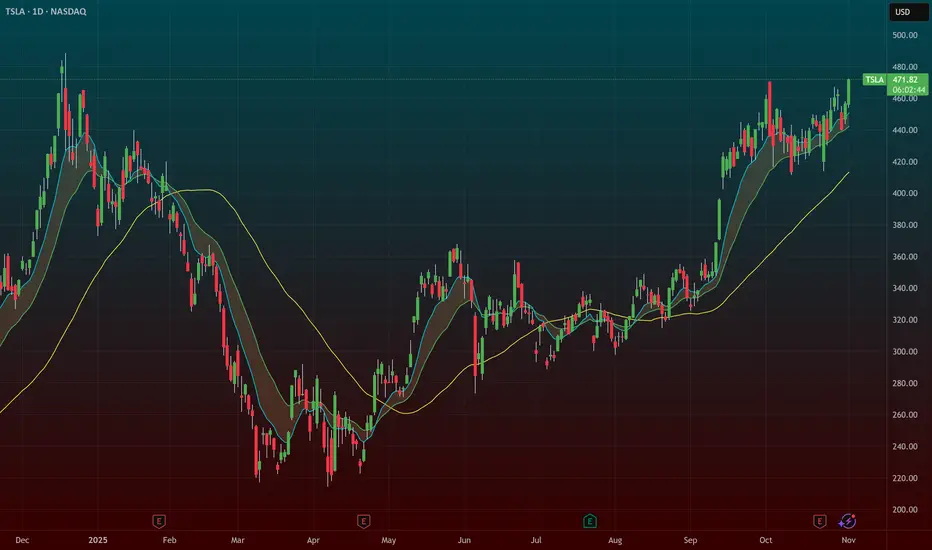
$TSLA – Breakout Setup Targeting ATHs → $500 ZoneTesla ( NASDAQ:TSLA ) looks ready for liftoff. After months of absorbing negative headlines and post-earnings volatility, it’s finally setting up for a major breakout that could take it back to all-time highs — and possibly the $500 level.
🔹 The Setup:
NASDAQ:TSLA has shaken off every piece of bad news — earnings, delivery headlines, margin fears — all absorbed without breaking trend.
The stock is now coiling under major resistance, and the tape is showing accumulation.
The narrative has flipped from “EV slowdown” to autonomous driving and robotics, giving the stock new life.
🔹 Why This Setup Has Juice:
It’s the last major leader yet to make a big move — the rotation setup is real.
Market sentiment is improving, and NASDAQ:TSLA is showing relative strength.
Volume expansion here could mark the start of the next major leg higher.
🔹 My Trade Plan:
1️⃣ Position: Added $500 calls (2 weeks out) at the open this morning.
2️⃣ Stop: If the stock goes under $450, I’m out — keeping risk tight.
3️⃣ Targets: First stop at ATHs, then a potential run toward $500 if momentum holds.
Why I Love This Chart:
The structure is perfect — long base, trendline reclaim, sector rotation lining up.
NASDAQ:TSLA has flipped from “bad news reaction” to “no sell reaction,” a clear sentiment shift.
Risk/reward is ideal here with a tight stop and clear upside roadmap.
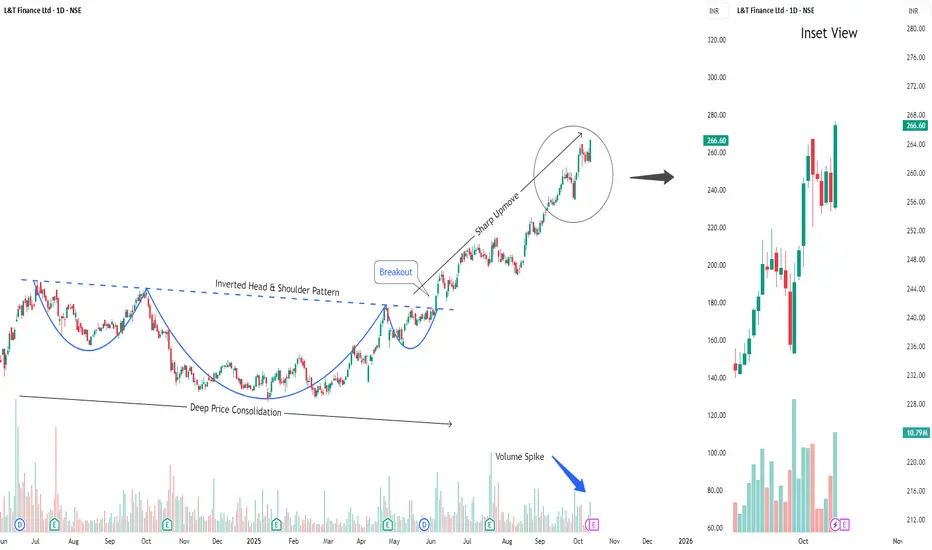
Buy L&T FinanceShort Term Trading Advice by Goodluck Capital
Buy L&T Finance
● Buy Range- 262 - 266
● Target- 280 - 285
● StopLoss- below 252
● Upside Potential- 6% -8%
● Approx trade duration 12 - 14 days
Buy Bharti AirtelShort Term Trading Advice by Goodluck Capital
Buy Bharti Airtel
● Buy Range- 2000 - 2050
● Target- 2120 - 2150
● StopLoss- below 1970
● Upside Potential- 5% -6%
● Approx trade duration 10 - 12 days

Gold (XAUUSD) Pullback Analysis: Testing OB Before TargetsA potential trading setup based on concepts from Smart Money Concepts (SMC) or similar institutional methodologies.
Asset and Timeframe: XAU/USD (Gold Spot / US Dollar) on a 1-Hour (1H) timeframe.
Current Price: The price is hovering around $3,983.55.
Market Structure:
There's a recent Break of Structure (BOS), suggesting an upward bias or a shift in momentum to the bullish side.
The price is currently pulling back into a key zone.
Key Zones/Concepts:
OB (Order Block): The shaded gray area is identified as an Order Block. This is a zone where significant institutional buying/selling previously occurred, and the price is expected to react to it.
$$$ (Liquidity/Equal Lows): The three dollar signs indicate an area of liquidity or equal lows below the current price action. These are often targeted for a stop-hunt or liquidity grab before a significant move.
1H / BPR (Balance Price Range): The lower green box is labeled as a 1H / BPR. A Balance Price Range is a more refined area of support/demand, suggesting an even stronger reaction zone if the initial OB fails.
Projected Trade Scenarios: The dotted lines outline two primary possibilities:
Bullish Scenario (Solid Line): A bounce from the OB (Order Block) to hit Target 1 ($4,030.00).
Bearish/Liquidity Grab Scenario (Dotted Line): A drop below the OB to sweep the $$$ (Liquidity), potentially testing the 1H / BPR before a sharp reversal back up to Target 1 or even Target 2 ($4,050.00).

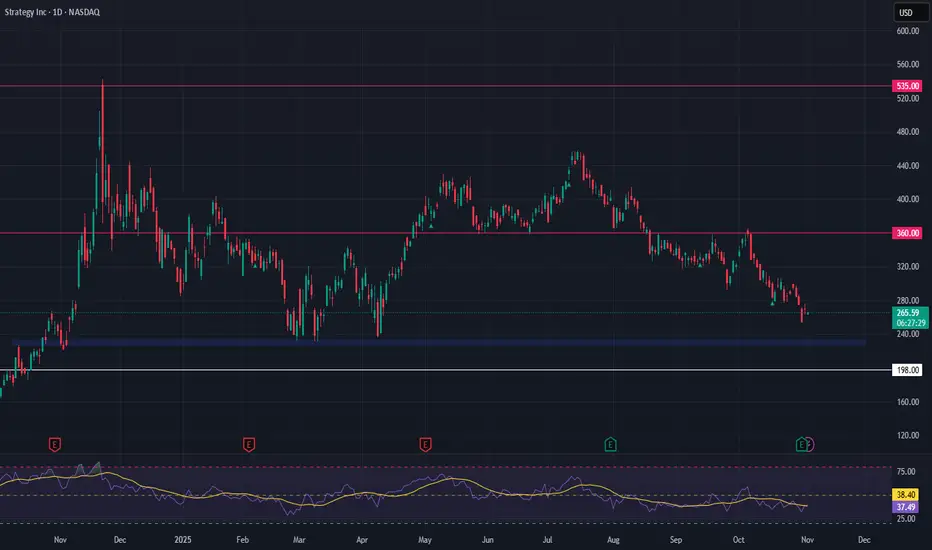
Strategy Inc (MSTR) – High-Beta Bitcoin Proxy at Key SupportStrategy Inc NASDAQ:MSTR has delivered another strong quarterly report, underscoring its continued commitment to aggressive Bitcoin accumulation. With over 158,000 BTC on the books, MSTR has firmly positioned itself as a leveraged proxy for Bitcoin, offering equity traders indirect crypto exposure. This bold balance sheet strategy has also pushed MSTR into alignment with S&P 500 inclusion criteria — a potential catalyst if index inclusion materializes.
Technically, the stock is now retesting a key support zone between $228 and $233. This level has historically held well and may offer a high-conviction entry for those anticipating a BTC rebound. Should Bitcoin aim for new highs, MSTR could respond with outsized upside, though traders must account for the volatility and downside risks that come with crypto-correlated equities.
🎯 Trade Setup:
Entry Zone: $228 – $233
Take Profit Targets: $360 and $535
Stop Loss: $198
This setup offers a high-risk, high-reward opportunity. As always, manage position size carefully and watch BTC price action for confirmation.