HYPEUSDT – Watching a Key Support Zone for Long SetupHYPEUSDT is currently pulling back and heading toward a major support area at $42–$43. This zone has historically provided strong buying interest and could act as a platform for a reversal. We’re closely watching this level for a potential long swing trade opportunity.
🛠 Trade Setup
Entry Zone: $42 – $43 (Support Area)
Take Profit Levels:
• TP1: $53
• TP2: $59
Stop Loss: $38 (Just below structure)
Swingtrade

IONQ — Re-Accumulation Structure📈 IONQ — Re-Accumulation Structure Setting Up for Phase B Expansion
After completing a clear Phase A stopping action marked by the Selling Climax (SC) and Automatic Rally (AR), price action has confirmed a re-accumulation structure rather than a full distribution. The recent retest of the AR level occurred on notably reduced volume and lower implied volatility, suggesting that supply has been exhausted and that composite operators are absorbing shares rather than distributing them.
The Volume Profile (VRVP) shows a strong high-volume node between $56–$62, where demand has consistently stepped in. Below that zone, liquidity thins rapidly—indicating that this area represents a value base rather than a weak support. Meanwhile, successive tests of this range have produced higher lows on contracting downside volume, a hallmark of accumulation nearing its Phase B transition.
As the structure matures, a move to re-test the upper resistance near $83 would represent the Up-Thrust (UT) typical of Phase B, serving as a preliminary sign of strength before the eventual breakout (Phase C–D). With improving relative strength and declining volatility, the stock is poised for a measured $20 swing, aligning with a broader markup continuation once absorption completes.
In short: Low-volume retests + balanced profile + diminishing supply = classic Wyckoff re-accumulation dynamics.

UPS Breakout & Retest – Long Spot OpportunityNYSE:UPS has broken above the key $90 resistance level, indicating a potential shift in trend. This level may now act as support, offering a textbook retest setup. We’re watching closely for a pullback to confirm $88.00–$90.00 as a buy zone for a possible long entry.
🎯 Entry Zone: $88.00–$90.00
📈 Targets:
• TP1: $103.00–$111.00
• TP2: $122.00–$138.00
🔻 Stop Loss: Below $85.00
If price holds the $90 zone with bullish confirmation (volume, wick rejections, etc.), this could be a strong continuation setup. As always, risk management is key – keep an eye on broader market sentiment and earnings-related moves.

Breakout in ENGINERSINBreakout in ENGINERSIN.
Entry - 206
Target - 250
SL - 196
DISCLAIMER: I am not SEBI registered and the ideas posted are only for educational purpose. Do a proper analysis and always trade with STOP LOSS.

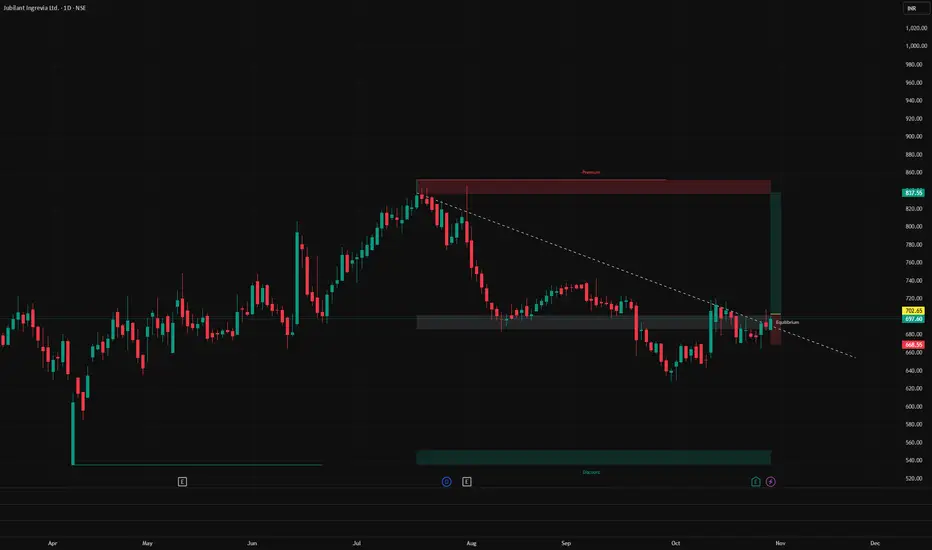
Breakout in JUBILANT INGREVIA.Breakout in JUBILANT INGREVIA.
Entry - 702
Target - 830
SL - 670
DISCLAIMER: I am not SEBI registered and the ideas posted are only for educational purpose. Do a proper analysis and always trade with STOP LOSS.
Breakout in VAIBHAV GLOBALBreakout in VAIBHAV GLOBAL.
Entry - 239
Target - 265
SL - 228
DISCLAIMER: I am not SEBI registered and the ideas posted are only for educational purpose. Do a proper analysis and always trade with STOP LOSS.

SOFI — Bullish Breakout with Strong VolumeSOFI has broken out to a new all-time high with strong volume, signaling strong buying pressure and renewed bullish momentum.
The stock remains in a clear uptrend, trading above the 50-day EMA. Recently, SOFI rebounded perfectly at the EMA 50, confirming it as a strong dynamic support zone. The bullish pennant pattern breakout further strengthens the case for a trend continuation.
The uptrend line is still intact, and as long as the price holds above the EMA 50, the bullish outlook remains valid.
Entry Price : 31.00 - 32.00
Stop Loss: Below EMA 50 (~26.80–26.90)
Targets: 35.00 and 38.00

Possibility of breakout in SWANCORPPossibility of breakout in SWANCORP.
Entry - 476
Target - 526
SL - 459
DISCLAIMER: I am not SEBI registered and the ideas posted are only for educational purpose. Do a proper analysis and always trade with STOP LOSS.

Bullish Setups Emerging: Usha Martin and Alicon in Focus🔹 Usha Martin NSE:USHAMART
After months of sideways movement, the stock has formed a rounding bottom pattern.
It recently broke out and retested its support zone. If momentum continues, the stock could move higher from here. 📈
🔹 Alicon Castalloy NSE:ALICON
The stock bounced back strongly from ₹600 after a big correction from ₹1,530.
It now trades near the key resistance zone of ₹1,000–₹1,050.
Yesterday’s 13% jump with high volume shows strong buying interest. A breakout above this zone could take it closer to previous highs. 🔥
👉 Keep an eye on both — they’re showing promising setups for the next move!

Breakout in CAMSBreakout in CAMS
Entry - 3967
Target - 4370
SL - 3870
DISCLAIMER: I am not SEBI registered and the ideas posted are only for educational purpose. Do a proper analysis and always trade with STOP LOSS.

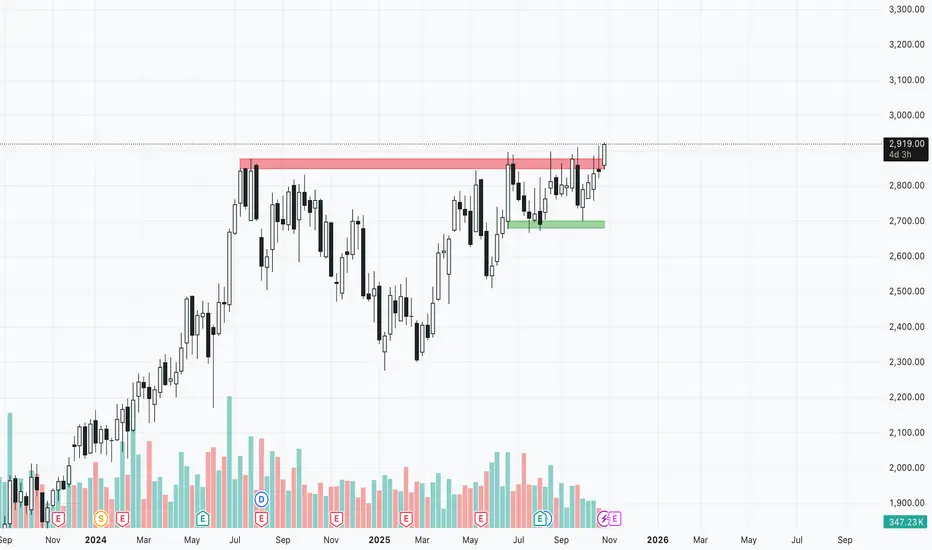
GRASIM - Weekly Breakout?Chart Analysis :
Price sustaining and breaking out above its major resistance of 2895-2910 zone. Price made a long consolidation of 67 weeks/ 15months and now breaking out.
Daily close above 2910-2920 will confirm breakout and can be considered for long.
Key Levels:
Entry level : Above 2920
Targets : 3000 psychologically imp level can move more if breaks out above 3000 (Trailing with day low SL post breakout is the suggested strategy)
StopLoss : Day close below 2820
Disclaimer:
I am not SEBI registered. This analysis is for educational purposes only and not investment advice. Please do your own research before trading or investing.
XAUUSD Bearish Retracement Targeting $4,000 SupportContext and Trend
Prior Bullish Trend: The chart clearly shows a strong, sustained uptrend leading up to October 22nd, with the price moving from below $3,920 to a peak near $4,200.
Recent Sharp Reversal: This strong bullish move was abruptly interrupted by a massive bearish candlestick on October 22nd, indicating a sharp and significant sell-off from the high. This move marks a potential shift in the short-term momentum.
Current Price Action and Key Zones
Current Consolidation/Retracement: Since the sharp drop, the price has entered a phase of consolidation or a retracement (a move back up) within the area that saw the sharpest selling pressure.
Supply/Resistance Zone: The blue shaded rectangle, which ranges roughly from $4,080 to $4,120, is a key area. This zone represents an area where the market may have found previous support or, more likely, is now acting as a supply zone (resistance) after the large drop. Traders often look to sell when the price re-enters a zone that previously broke down quickly, anticipating fresh selling pressure.
Price Prediction (The Path): The drawn arrows indicate a predicted move:
The price moves up to test the $4,080 - $4,120 supply zone.
Upon hitting resistance, the price is expected to reverse and fall.
The predicted target for the drop is the dashed green line at $4,009.10 (a level very close to the significant psychological support level of $4,000).
Conclusion
The chart suggests a high-probability short-term selling opportunity (or "short" trade) if the price reaches the supply zone, with the trade aiming for the major support level just above $4,000. The setup is based on the technical analysis pattern of a bearish continuation after a strong impulse move down.

OP/USDT – Order Block Accumulation + RSI OversoldOP is currently bound within a consolidation range, showing signs of a potential order block formation—a zone where larger players may be accumulating. These structures often precede impulsive, expansive moves once the range is broken. We're seeing tight price action between $0.400 and $0.410, which could act as a springboard.
🔍 The RSI is deep into oversold territory, signaling that the selling momentum may be fading. This aligns with the idea of a reversal or breakout from the current accumulation zone. Watch for volume spikes or candle structure shifts as potential early signals.
📊 Trade Idea:
Entry Zone: $0.400 – $0.410
Take Profit Targets: $0.462 → $0.499 → $0.570
Stop Loss: Below $0.39

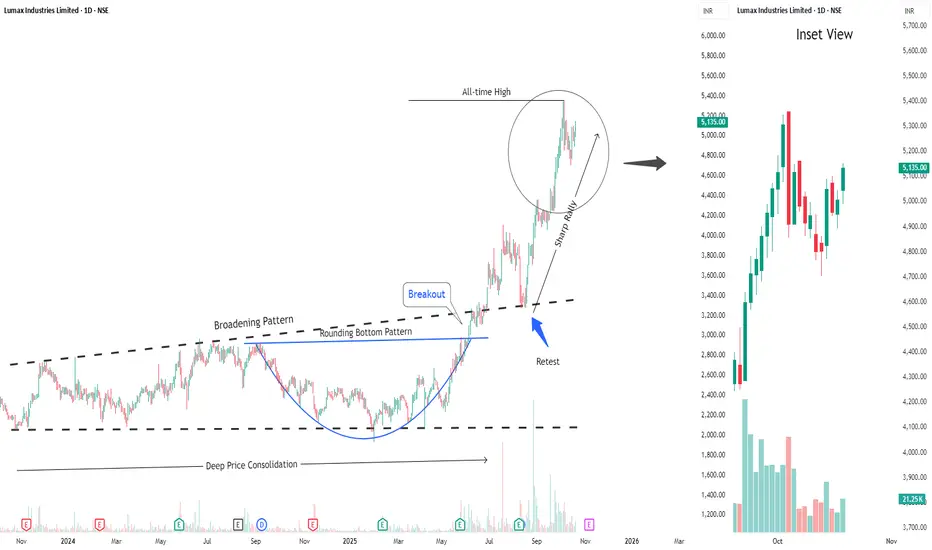
Buy Lumax IndustriesShort Term Trading Advice by Goodluck Capital
Buy Lumax Industries
● Buy Range- 5050 - 5150
● Target- 5350 - 5450
● StopLoss- below 4850
● Upside Potential- 5% -7%
● Approx trade duration 12 - 14 days
XAUUSD Bullish Continuation Setup: Post-Correction Rally to ?Key Observations and Strategy:Prior Momentum: The market showed a strong, rapid bullish move throughout October 2025.Current Price Action: The price is undergoing a healthy pullback (correction) from its recent high, currently sitting around 4,246.78.
Support Zone: The critical demand area is highlighted in light blue, acting as a Support zone roughly between 4,155}$ and 4,223. This is where buying pressure is expected to resume.
Trade Setup (Long/Buy): The strategy is to enter a long position (buy) on a rebound from the support area, banking on the continuation of the primary uptrend.
Stop-Loss: The trade is protected by a Stop-Loss placed just below the support at 4,155.67. This is the point where the bullish view would be invalidated.
Target (Take Profit): The anticipated peak for this move is the Target at 4,426.70.
Conclusion: This setup represents a high-probability trade for a bullish continuation pattern following a recent, significant rally.

BTC/USD: Potential Bearish Continuation After Support BreakKey Technical Observations
Prior Consolidation and Support: The price appears to have been trading within a range, with a significant support level identified around $109,000 to $110,000 (marked by the lowest horizontal black line). This level had been tested and held multiple times, particularly throughout late August and September.
Support Break: A large bearish candlestick (red) recently broke decisively below this key support level. This is a strong technical signal indicating that the bears have taken control and that the prior consolidation range is over.
Setup for a Short Trade (Short Entry): The chart illustrates a classic "break and retest" strategy, often used in technical analysis:
Entry/Re-entry Zone: The suggested trade entry (indicated by the blue box and the curved arrow) is a retest of the broken support level, which now acts as new resistance around the $109,000 mark.
Stop Loss: The Stop Loss is strategically placed above the most recent cluster of resistance, specifically above $112,682, to limit potential losses if the price moves against the trade and re-enters the previous high-value area.
Target: The Target price is set significantly lower at $104,001, suggesting the expectation of a strong downward momentum move, possibly towards the next significant support area not explicitly marked on the visible chart.
Risk/Reward Ratio: The setup shows a favorable risk/reward ratio, as the potential gain (Target to Entry) is visibly larger than the potential loss (Stop Loss to Entry).
Conclusion
The current chart structure strongly favors a short position on BTC/USD, anticipating a bearish continuation. The breakout below a critical support zone suggests the path of least resistance is now to the downside, with traders looking to enter a short position on a pullback to the broken support-turned-resistance area.

BTC: Monthly FVG Retest Before New ATHCurrent Status: The price is around $104,447 and is currently in a strong corrective move after reaching a recent high.
All-Time High (ATH): The previous peak is marked near $126,311. This is the key long-term target.
Monthly Fair Value Gap (FVG): The blue box between approximately $95,000 and $98,000 is a "Monthly FVG". This area is expected to act as a magnet for the price to retrace to.
Projected Path: The analyst expects the price to drop further into the Monthly FVG (the $95k - $98k zone) before finding strong support. Following this test, a major rally is projected to push the price back up to hit the All-Time High near $126,311.
The main idea is a deep correction to a technical support level (FVG) followed by a bullish continuation to a new ATH.

Bitcoin Bearish Continuation from Daily FVGa bearish continuation setup on Bitcoin (BTC/USD) in the daily timeframe.
After a sharp rejection from the Daily Fair Value Gap (FVG) zone between roughly $114,000–$120,000, price shows strong bearish momentum. The large red candle indicates sellers’ dominance, and the marked downward arrow projects a potential move toward lower support zones around $108,000 and $105,000, which act as the next liquidity levels or demand areas.

XAUUSD: $4,400 Target Next! Gold Bull Run ContinuesKey Observations:
Massive Uptrend: The chart clearly displays a strong, multi-day uptrend, marked by a series of high-momentum green (bullish) candlesticks.
Recent Price Action: Price has recently surged, followed by a minor retracement (the most recent red candle), but remains near the top of the move. This indicates the primary momentum is still firmly to the upside.
Key Support/Demand Zones:Immediate Demand (Yellow Box): A small yellow box is marked around the $\$4,250$ area. This represents a very recent, short-term support or 'flip' zone where price broke out and could potentially retest before moving higher.Deeper Demand (Blue Box): A larger blue box (around $\$4,130$ to $\$4,190$) represents a more significant, underlying demand zone.
Projected Price Action: The hand-drawn path suggests a direct continuation with potentially only a minor dip:
The path shows a small pullback toward the $\$4,300$ area (not explicitly marked by a zone) or a brief sideways move.
The black arrow points to an anticipated strong push up to the final target, resuming the dominant uptrend without necessarily hitting the marked yellow or blue zones.
Target: A dotted blue line at $\$4,400.69$ is the clear final target for this trade setup.

Gold Bullish Continuation Toward 4,300 TargetTrend Direction: The overall structure is clearly bullish, with price continuing to rise after breaking previous resistance levels.
Price Action: After a strong impulsive move upward, a small corrective phase (pullback) is visible — represented by the zigzag arrow — suggesting a healthy retracement before continuation.
Key Zone: The highlighted blue-green box marks a demand or fair value gap (FVG) region where buyers previously entered strongly, likely acting as a support area for future pullbacks.
Current Price: Around $4,195.84, maintaining bullish momentum.
Target: The projection line points toward a target zone near $4,300, indicating the next resistance or profit-taking level.
Overall Sentiment: Bullish continuation toward the upper target, provided the price sustains above the previous support zone around $4,100–$4,000.

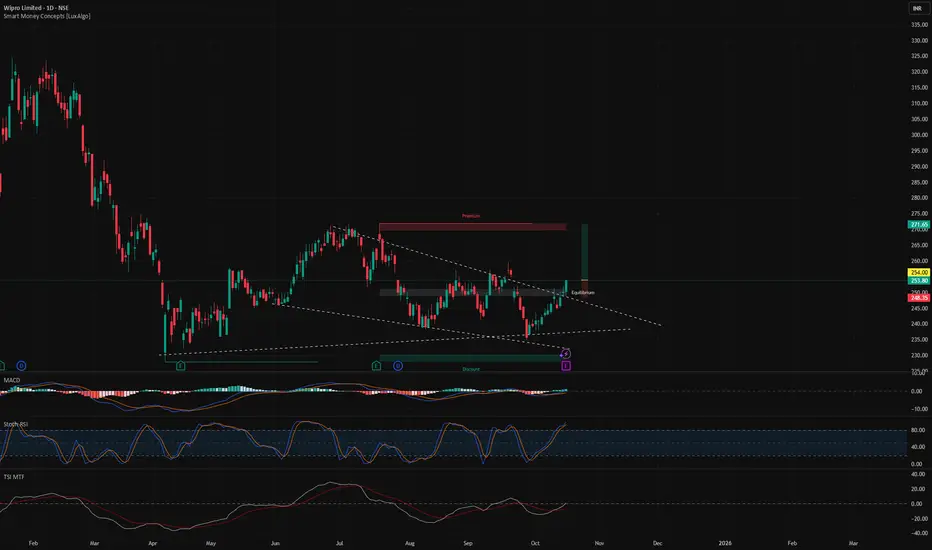
Breakout in WIPROBreakout in WIPRO.
Entry - 254
Targets - 270, 285 & 310
SL - 248
DISCLAIMER: I am not SEBI registered and the ideas posted are only for educational purpose. Do a proper analysis and always trade with STOP LOSS.
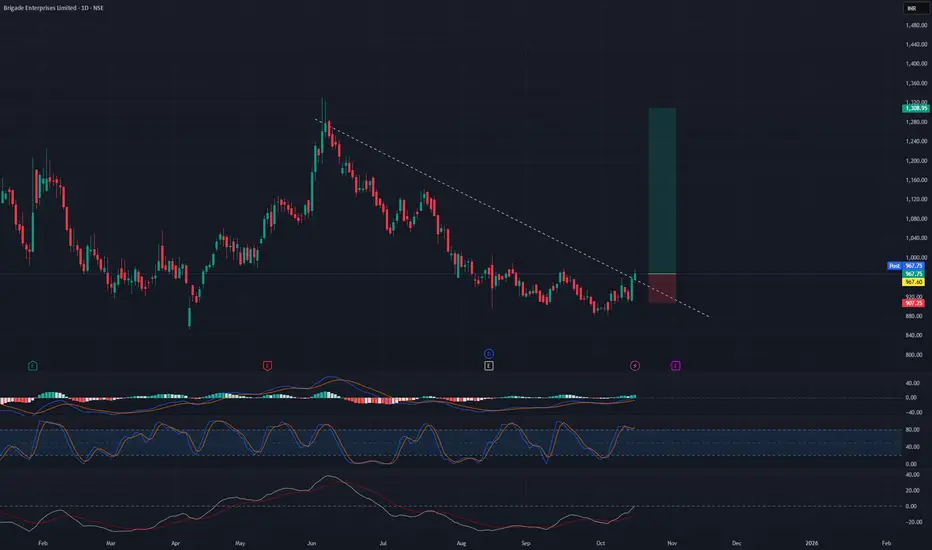
Breakout trading in BRIGADESwing trading opportunity in BRIGADE.
Entry - 970
Targets - 1130 & 1300
SL - 904
DISCLAIMER: I am not SEBI registered and the ideas posted are only for educational purpose. Do a proper analysis and always trade with STOP LOSS.
Swing trade opportunity in INOX WINDSwing trade opportunity in INOX WIND.
Entry - 150
Targets - 175 & 190
DISCLAIMER: I am not SEBI registered and the ideas posted are only for educational purpose. Always trade with proper STOP LOSS.
