Link has a good entry today.enter if Link price is within ±2% of 22.40.
take profit at 27.70.
this is a swing trade, not a quick one. patience pays off.
nb: if price goes against you, hold or move it to a Smart Rebalance Bot until the market turns.
don't allocate more than 5% of your portfolio per trade.
Swingtrade

Buy Jones Lang LaSalleShort Term Trading Advice by Naranj Capital
Buy Jones Lang LaSalle
● Buy Range- 297 - 300
● Target- 312 - 316
● StopLoss- Below 285
● Potential Return- 4-5%
● Duration- 14-15 Trading Days

Wall Street Weekly Outlook - Week 37 2025Wall Street Weekly Outlook - Week 37 2025
Starting this week, I will release a weekly outlook video for the TradingView community. Get ready for the new week from an institutional perspective!
***
This week, markets are once again dominated by 🏦 central banks, 📊 inflation data, and the ongoing debate about whether the global economy is heading for a soft 🪂 or hard 🛬 landing.
We’ll look at the major themes 🔎 banks and institutions are focusing on, analyze key charts 🖥️, and highlight what could move markets 🔥 in the coming days.
🥇 Gold and 🥈 Silver remain in the spotlight as investors hedge against uncertainty, while 📉 equities are testing important resistance levels. In 💵 currencies, the USD is positioning itself ahead of crucial macroeconomic data.
👉 Join me as we break down what really matters on Wall Street this week — and how it could impact the markets.
Best,
Meikel

BTC Breakdown Alert: Bears Eye $106K Next!
🔥 **BTC Bears Ready to Attack? 🚨 Target \$106K Incoming!** 🔥
📊 **Market Bias**
⏳ **Intraday → 4H**: 🟥 Bearish (⬇️ below EMA9/21/20SMA, 📉 MACD negative, 💥 sell volume)
📅 **Daily → Weekly**: ✅ Mixed-to-Bullish (📈 above 200 SMA ≈ 101.3k)
⚖️ → Tactical short only, ⚠️ size carefully.
🎯 **Trade Plan**
💰 Entry: **109,200**
🛑 Stop Loss: **110,800**
🎯 Take Profit: **102,400** (⚡ 50% at 105,900 / 50% at 102,400)
📏 Size: **1 BTC** (risk \~1%)
💪 Confidence: **60%**
⏰ Timing: **Market Open**
🧠 **Why Short?**
* 📉 EMAs/SMA bearish stack
* 🔻 Expanding negative MACD
* 🧊 Heavier sell volume
* 🎯 BB extension aligns w/ \~102.4k
⚠️ **Risks**
* ❓ Missing OI/liquidity data = squeeze risk
* 📈 Long-term bullish structure > 200 SMA
* 🌍 Macro shocks (ETF/reg headlines, DXY swings)
---
📊 **TRADE JSON (automation/record):**
```json
{
"instrument": "BTC",
"direction": "short",
"entry_price": 109200.00,
"stop_loss": 110800.00,
"take_profit": 106000.00,
"size": 1.0,
"confidence": 0.60,
"entry_timing": "market_open",
"signal_publish_time": "2025-09-01 17:02:46"
}
```
---
🏷️ **Hashtags:**
\#BTC 🚀 #Bitcoin 💎 #CryptoTrading 📊 #TradeSetup 🐻 #ShortTrade ⚡ #DayTrading ⏳ #RiskManagement 🛡️ #SwingTrade 🎯

BONK Approaching Key Support – Potential Long Swing Setup
BONK is pulling back and approaching a major support zone, where buyers previously stepped in. With price action slowing down, this could present a low-risk, high-reward swing trade opportunity.
Trade Setup:
🔹 Entry Zone: $0.0000183 – $0.000016
🔹 Take Profit Targets:
🥇 $0.0000226
🥈 $0.000026
🔹 Stop Loss: Close below $0.0000155
#BONK #CryptoTrading #SwingTrade #Altcoins #TechnicalAnalysis

AMD Pullback Opportunity After 70%+ Rally – Watching $111–$120 📈 AMD Update – Strategic Re-Entry Plan
From our original buys at $108, AMD has delivered an impressive 70%+ rally. This strong momentum reflects continued bullish sentiment and growth potential in the semiconductor sector.
We’re now looking to add on a pullback into a confluence support zone between $111 and $120. This level aligns with the:
61.8% Fibonacci retracement
99-day TRAMA
Horizontal support at $120
📍 Entry Zone: $111–$120
🎯 Take Profit Targets: $160 / $220 / $300
❌ Stop Loss: Weekly close below $100
#AMD #NASDAQ #SwingTrade #Fibonacci #TechnicalAnalysis #StockMarket #TradingIdeas

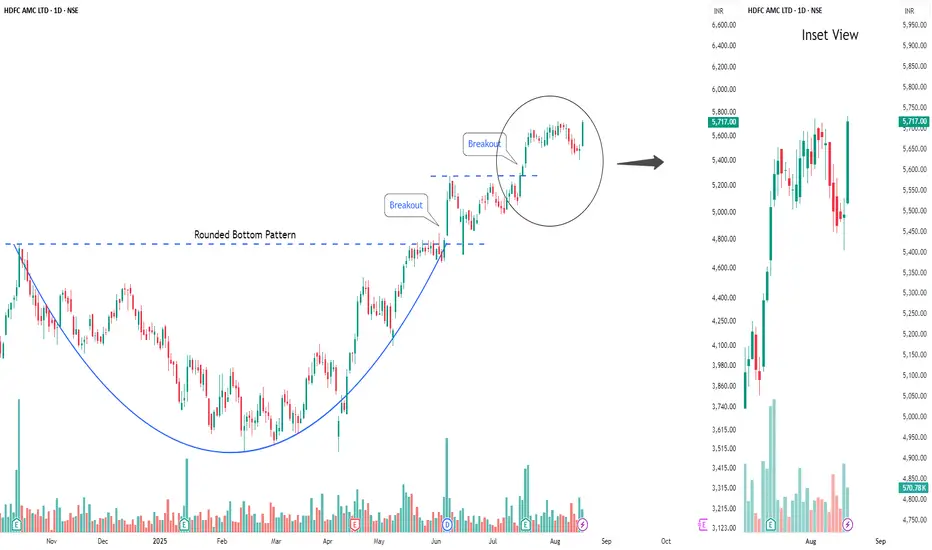
Buy HDFC AMCShort Term Trading Advice by Goodluck Capital
Buy HDFC AMC
● Buy Range- 5600 - 5700
● Target- 5900 - 6000
● StopLoss- below 5380
● Upside Potential- 4% -5%
● Approx trade duration 14 - 15 days
possible swing point on GBPJPY Alright, let’s dive into the exciting world of trading, shall we?
So, here's the scoop: we’re on the lookout for potential swing points, those sweet spots where the market might just take a turn. It's like waiting for the perfect wave while surfing—the key is to recognize the signs before riding it out. Typically, one of the best indicators we have is a classic momentum drop. Picture it: as the price rises, there’s a little dip in momentum that signals a shift is on the horizon.
Now, once we spot that drop, we keep our eyes peeled for a lovely shift in price action. That’s our cue! When we see everything aligning just right, we can jump in with a smooth swing entry on this pair. It’s all about catching that rhythm and flowing with the market's natural ebb and flow.
So, dust off those charts and let your creative side take control! Map out your strategies, draw your lines, and visualize your plan of action. Trading is as much an art as it is a science, and every eye you lay on the charts brings you closer to mastering it.
Remember, though, as tempting as it is to get swept away by the possibilities, nothing in trading is guaranteed. Embrace the journey; it's all part of the fun and learning. Let’s see how this plays out together! Happy trading!

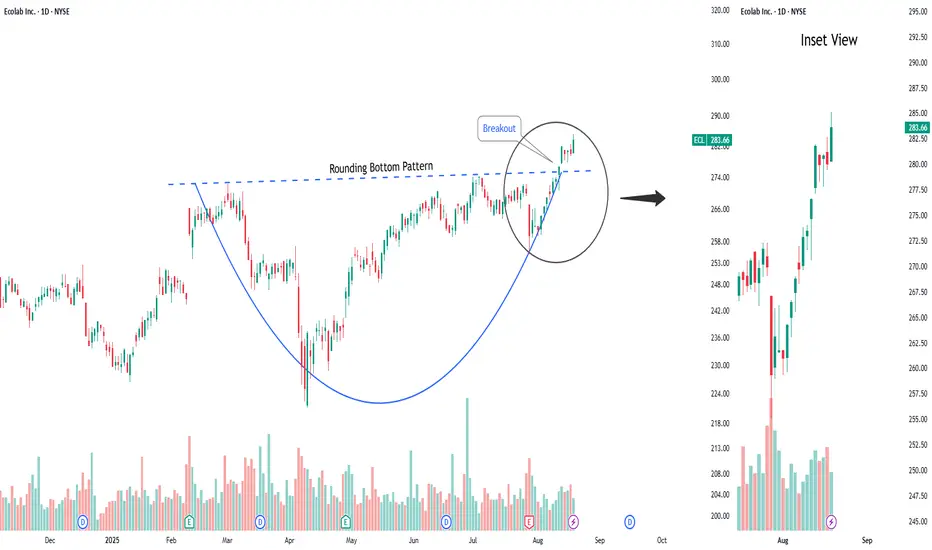
Buy EcolabShort Term Trading Advice by Naranj Capital
Buy Ecolab
● Buy Range- 282 - 285
● Target- 295 - 300
● StopLoss- Below 276
● Potential Return- 4-5%
● Duration- 12-14 Trading Days
Strong daily supply level in control on EURUSDThere is a strong daily supply level in control on EURUSD the 19th of August 2025. Will the EURUSD drop much further. Hopefully it will.

Is this where GJ starts making its big move?Hi Traders,
After breaking out of a failed swing tapping 200.000, GJ came down to retest the failed swing area at 199.000, bounced and reversed. Around 199.500 could be another retest/entry area before continuation. The weekly looks really good IMO, so I am planning to swing trade. My first target would be around 201.500, and then 203.000. 203.000 would hit an area of a weekly bearish OB.
*DISCLAIMER: I am not a financial advisor. The ideas and trades I take on my page are for educational and entertainment purposes only. I'm just showing you guys how I trade. Remember, trading of any kind involves risk. Your investments are solely your responsibility and not mine.*

GBP/USD Forecast – Bullish Continuation SetupGBP/USD has broken out of the descending channel and is maintaining bullish momentum. I expect the price to move toward the 1.3725–1.3807 resistance zone, where we may see a corrective pullback. If this zone holds and structure remains bullish, the next target sits at the weekly order block near 1.4230, aligning with higher-timeframe supply.
Bias remains bullish unless price closes back below recent lows and re-enters the channel, which would invalidate the setup. For now, market structure favours continuation to the upside.
Targets:
Short-term: 1.3725–1.3807
Long-term: 1.4230
Invalidation: Break and close back below channel lows.


Energizing gains – Initiating NHPC buy.Chart timeframe: Daily chart of NHPC.
Pattern formation: Broadening pattern observed.
Support zone: Currently taking support along the parallel channel in the ₹80–₹83 range.
Price outlook: Sustaining this support zone could lead to higher price levels.
Note: Continue monitoring price action for confirmation.
Thank You !!

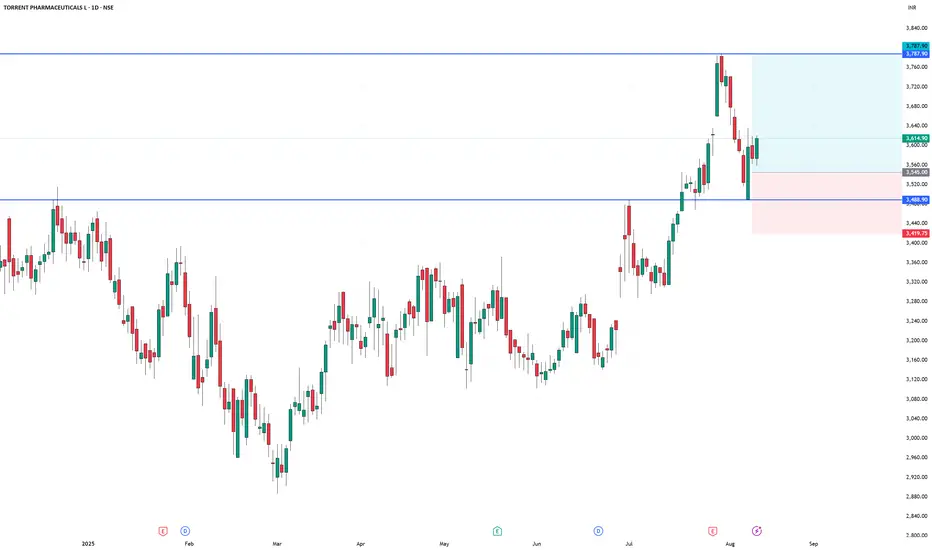
TORNTPHARM long setupTORNTPHARM long setup
Entry - 3545
Stop loss - 3420
Target - 3788
Risk Reward - 1:1.94
SUI – Ready to Drop from the $3.96 Supply WallSUI has rallied right into a key confluence area — the strong supply zone & bearish order block at $3.90–$4.00, which also aligns perfectly with the descending channel’s upper boundary.
📌 Bearish Scenario (preferred):
If price shows rejection at this zone and breaks below $3.85, a corrective move toward $3.55–$3.60 is highly probable, with potential extension toward $3.35 demand zone.
📌 Invalidation:
A 4H candle close above $4.05 would invalidate the short setup and open the door for a continuation toward $4.25+.
💡 Note: Confluence of channel resistance + supply OB + psychological $4 level makes this a high-probability short area. Watch for lower-timeframe BOS or liquidity sweep before entering.

FIGMA Grabbing Liquidity!!!
## ⚠️ FIG Swing Short Setup (2025-08-08) ⚠️
**Bias:** 📉 **Strong Bearish** — heavy put flow, weak trend, no momentum support.
**🎯 Trade Plan**
* **Ticker:** \ NYSE:FIG
* **Type:** PUT (SHORT)
* **Strike:** \$75.00
* **Entry:** \$4.80 (watch open, avoid chasing)
* **Profit Target 1:** \$7.20 (+50%)
* **Profit Target 2:** \$9.60 (+100%)
* **Stop Loss:** \$2.88 (-40%)
* **Expiry:** 2025-08-15
* **Size:** 1 contract
* **Confidence:** 75%
**📊 Key Notes**
* **C/P Ratio:** 0.45 → bearish options flow ✅
* Institutional bias heavily short ✅
* Trend falling, multi-timeframe returns flat ❌
* Volume: average — no strong push yet ⚠️
* Watch \$80 resistance for rejection trigger 🚨

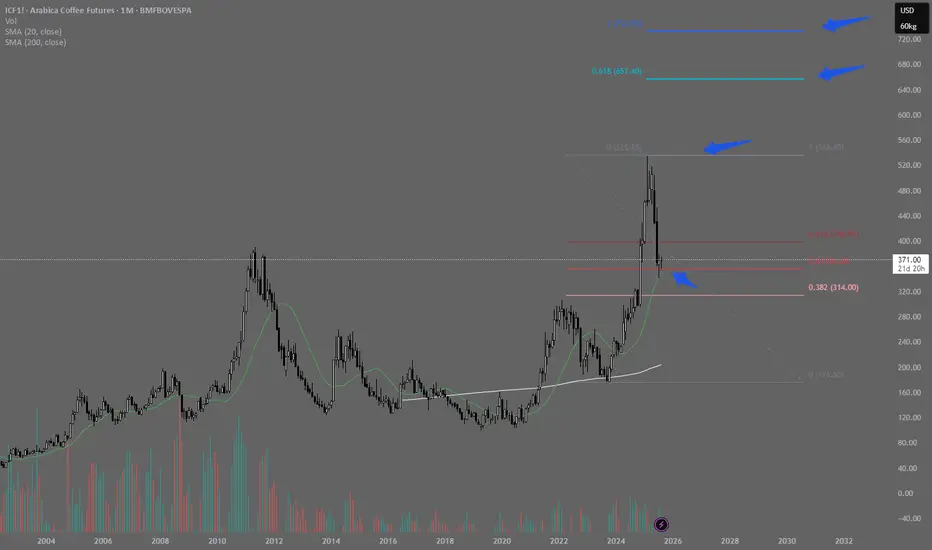
Correction Over? Coffee May Be Ready for Another Rally!After a strong rally and moving far from its moving averages, coffee futures have started a healthy and expected pullback.
As we can see, the 20-period moving average (green) stands out as a strong support level and a potential target for those who sold near the top — whether for a partial profit-taking (expecting a deeper correction) or a full exit.
The candle formed right on the 20MA clearly reflects this dynamic: positions being closed by some traders and opened by others.
This price zone offers a good buying opportunity, with a tight stop and a long target in favor of the prevailing uptrend.
The trade symmetry is favorable, further reinforcing interest in this region.
Initial targets would be the previous high, and if that level is broken, the Fibonacci projections for more ambitious upside moves.
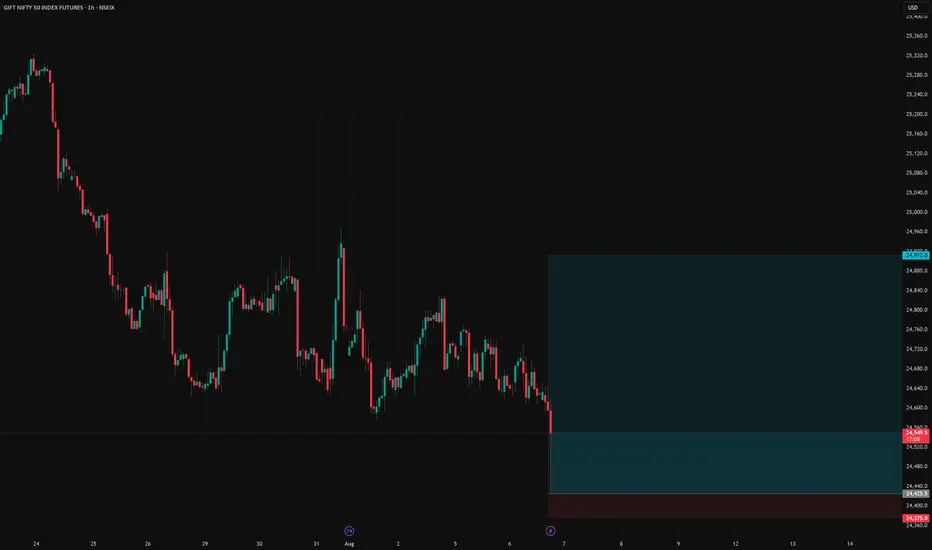
GIFT NIFTY long setupGift NIFTY long setup
Entry price - 24425.5
Stop loss - 24375
Target - 24912
Risk Reward - 1:9.6
RENDER Approaching Key Support – Swing Trade OpportunityRENDER is currently retracing and approaching a significant support zone, offering a potential long swing trade setup. This level has historically acted as a demand area, and price action around it could provide a favorable risk-to-reward entry.
💰 Entry Zone: $3.280 – $3.030
🎯 Targets:
• TP1: $4.00
• TP2: $4.500
🛑 Stop Loss: $2.950
Trade management will be key – look for bullish reversal signals like strong volume, bullish engulfing patterns, or RSI confirmation before entry. Maintain disciplined risk control with your stop loss below the key zone.
#RENDER #CryptoTrading #SwingTrade #Altcoins #TechnicalAnalysis #CryptoSetup #Bullish #SupportZone #CryptoSignals #RENDERUSDT #RiskReward #CryptoMarket

BTC – Pre-FOMC consolidation, bullish momentum, key zones__________________________________________________________________________________
Technical Overview – Summary Points
__________________________________________________________________________________
Momentum : Primary uptrend confirmed on all swing timeframes (daily to 1H). Active consolidation below major resistance (119650–120247), no capitulation or massive selling signals at this stage.
Major Supports / Resistances :
Main Supports: 116950, then 114732. Structural invalidation if daily close below 114K or low <110K.
Key Resistances: 119650–120247 (recent block), then 123218. Clean breakout >125K targets next stat zone at 141K.
Volumes : Transactional flows remain healthy, no anomalies or distribution events; normal volumes with a few impulsive bursts. No panic or selling climax detected.
Multi-timeframe behavior : Uptrend alignment from 1D to 2H; short-term divergence (MTFTI “Down” on 30m/15m/5m) indicates only breath/consolidation pre-macro event (FOMC).
__________________________________________________________________________________
Strategic Summary
__________________________________________________________________________________
Global Bias : Medium/long-term bullish bias, confirmed, with no behavioral excess or visible structural weakness.
Opportunities : Pullbacks to major supports (116950–114732) offer strategic accumulation. Potential for adding exposure on clear breakout above 125K with volume confirmation.
Risk Areas : Post-FOMC flushes, anticipated high volatility until Thursday morning, $115–123K range still active. Tactical stop loss below 114.5K, structural recalibration <110K.
Macro Catalysts : FOMC tonight (20:00 Paris): status quo expected, but markets highly sensitive to Powell’s statement. Widened spreads, max volatility expected within the following 2 hours.
Action Plan : Favor patience on breakout, accumulate on retracement, keep stops disciplined. Avoid aggressive scalping until post-FOMC volatility peak fades.
__________________________________________________________________________________
Multi-Timeframe Analysis
__________________________________________________________________________________
1D (Daily): Uptrend confirmed up to dense resistance zone 119800–123200. Solid momentum, no excess on Risk On / Risk Off Indicator or volume. Key Supports: 116950, 114732.
12H/6H/4H: Structured consolidation below 120247–119650. No behavioral warnings; markets strong, healthy liquidity. Accumulation-distribution rhythm without extremes.
2H/1H: Sideways, no sell-off or euphoria; potential consolidation before breakout. Major supports unchanged.
30min/15min: Noticeable short-term divergence (“Down”). Micro bearish setup, possible loss of short-term momentum before FOMC.
Summary: Broadly bullish swing trend with consolidation below resistance, reinforcement possible on breakout; short term fragile until macro moves (Fed) are digested.
Patience is key ahead of FOMC: prioritize accumulation on major pullback, keep stops disciplined, and avoid intraday over-trading unless clear exhaustion signals emerge.
__________________________________________________________________________________
Risk On / Risk Off Indicator: Strong Buy from 1D to 1H, intact sector support, positive structural bias.
ISPD DIV: Neutral across all timeframes: no excess, no behavioral climax.
On-chain/macro: 97% of holders still in profit; market absorbed stress test ($9B sell-off); only moderate euphoria, consistent with late bull phase but not exhausted.
Swing validation if >125K.
Tactical stop <114.5K; full capitulation <110K.
__________________________________________________________________________________

AUD/JPY: Fading the Rally at a Major Resistance ZoneWhile AUD/JPY has been in a clear uptrend, the rally is now approaching a significant technical ceiling where sellers have previously stepped in. We see a compelling opportunity for a counter-trend short, betting that this resistance level will hold and that the current bullish momentum is showing signs of exhaustion.
This trade is for those watching for a market turn, offering a well-defined risk-to-reward setup for a swing position.
🤔 The "Why" Behind the Short Setup
📰 The Fundamental Risk
The Australian Dollar is a "risk-on" currency, meaning it performs well when global markets are optimistic. The Japanese Yen, however, is a classic "safe-haven" asset that strengthens during times of uncertainty. With the upcoming high-impact Australian CPI data, any sign of economic weakness could disappoint the market, increase pressure on the RBA, and trigger a "risk-off" move that would benefit the Yen and send AUD/JPY lower.
📊 The Technical Ceiling
The chart tells a clear story. The price is currently testing a major resistance zone. Attempting to short near a strong ceiling like this provides a strategic entry to capture a potential trend reversal. We are essentially betting that the trend's multi-week momentum will stall and reverse from this key technical juncture.
✅ The High-Clarity SHORT Trade Setup
📉 Pair: AUD/JPY
👉 Direction: Short
⛔️ Entry: 96.716
🎯 Take Profit: 92.080
🛑 Stop Loss: 98.907
Rationale: This setup plays for a significant swing move. The wide stop loss is designed to withstand volatility from news events, while the deep take profit targets a full reversal back to major support levels seen earlier in the year.

Looking like an immediate buy on IBM! OptionsMastery:
🔉Sound on!🔉
📣Make sure to watch fullscreen!📣
Thank you as always for watching my videos. I hope that you learned something very educational! Please feel free to like, share, and comment on this post. Remember only risk what you are willing to lose. Trading is very risky but it can change your life!
