AUDJPY 240 MINS TIME FRAME - MY VIEWThe Structure looks good to us, waiting for this instrument to correct and then give us these opportunities as shown on this instrument (Price Chart).
Note: Its my view only and its for educational purpose only. Only who has got knowledge about this strategy, will understand what to be done on this setup. its purely based on my technical analysis only (strategies). we don't focus on the short term moves, we look for only for Bullish or Bearish Impulsive moves on the setups after a good price action is formed as per the strategy. we never get into corrective moves. because it will test our patience and also it will be a bullish or a bearish trap. and try trade the big moves.
We do not get into bullish or bearish traps. We anticipate and get into only big bullish or bearish moves (Impulsive Moves). Just ride the Bullish or Bearish Impulsive Move. Learn & Know the Complete Market Cycle.
Buy Low and Sell High Concept. Buy at Cheaper Price and Sell at Expensive Price.
Please keep your comments useful & respectful.
Keep it simple, keep it Unique.
Thanks for your support
Tradelikemee Academy
Saanjayy KG
Swingtrading

Nvidia - The bullish consolidation flag!Nvidia - NASDAQ:NVDA - is still quite bullish:
(click chart above to see the in depth analysis👆🏻)
After Nvidia retested a major horizontal support just last month, we witnessed an extremely strong bullish reversal candle which resulted in a strong +50% rally. Considering the bullish flag consolidation, a breakout is much more likely, but not in the immediate future.
Levels to watch: $150
Keep your long term vision!
Philip (BasicTrading)

AADHARHFCi Observed these Levels based on Price Action and Demand & Supply which is my own Concept "PENDAM CONCEPTS"... Please don't take any trades based on this chart/post... Because this chart is for educational purpose only not for Buy or Sell Recommendation... Thank Q

NZDJPY: Bullish Wave is Coming 🇳🇿🇯🇵
I have a strong feeling that NZDJPY will resume growth soon.
A neckline breakout of an inverted head & shoulders pattern
provides a strong swing confirmation.
The pair may reach at least 87.0 level soon.
❤️Please, support my work with like, thank you!❤️
I am part of Trade Nation's Influencer program and receive a monthly fee for using their TradingView charts in my analysis.

Apple - Please look at this chart!Apple - NASDAQ:AAPL - is just wonderful:
(click chart above to see the in depth analysis👆🏻)
Last month, Apple created a quite strong bullish rejection wick of about +25%. It was actually no surprise at all, because market structure was perfectly pushing price higher. Following the bullish break and retest pattern, new all time highs will most likely follow.
Levels to watch: $200, $300
Keep your long term vision!
Philip (BasicTrading)

BSOFTi Observed these Levels based on Price Action and Demand & Supply which is my own Concept "PENDAM CONCEPTS"... Please don't take any trades based on this chart/post... Because this chart is for educational purpose only not for Buy or Sell Recommendation... Thank Q

TEXRAILi Observed these Levels based on Price Action and Demand & Supply which is my own Concept "PENDAM CONCEPTS"... Please don't take any trades based on this chart/post... Because this chart is for educational purpose only not for Buy or Sell Recommendation... Thank Q

BTC Trap & Reverse: The Power of SFPs in ActionBTC continues to chop in a tight range near its previous all-time high. While price action may appear messy at first glance, traders using a combination of structure, Fibonacci levels, and order flow tools are spotting clean opportunities — especially through Swing Failure Patterns (SFPs).
🔍 What Just Happened?
Bitcoin recently rejected from the 0.786 Fibonacci retracement level — a classic reaction zone. What made this move powerful was the SFP that formed at that level. Price swept above a prior high, triggering breakout buys, only to reverse. This type of move traps late longs and offers an ideal short entry.
🧠 Educational Insight: Why SFPs Are One of the Best Setups
SFPs (Swing Failure Patterns) are some of the highest-probability trades you can take for a few key reasons:
1️⃣ Liquidity-driven: They form where stop losses cluster — above highs or below lows — creating a magnet for price.
2️⃣ Clean invalidation: The wick high/low gives a natural stop-loss level, keeping risk tight.
3️⃣ Fast reaction: Once trapped traders are forced to exit, price often reverses sharply — giving you strong follow-through.
4️⃣ Confirmable with order flow: Using tools like Exocharts, you can see aggressive longs/shorts piling in just before the reversal. This adds conviction to the setup.
📏 Current Confluence:
Rejection from the 0.786 Fib retracement
SFP confirmed on high volume
1:1 trend-based Fib extension sits at ~$105,410
That level also lines up with the 0.666 Fib retracement
Anchored VWAP around $105K
Liquidity pool right at that zone too — a likely magnet
🎯 Trade Idea:
Short triggered at the SFP wick, stop just above it. First target: the 1:1 extension near $105.4K. Risk-reward is excellent with high probability if price continues to unwind late longs.
✅ Key Takeaway:
In ranges like this, you don’t need to guess direction — you need to react to structure. SFPs give you that edge. When paired with real-time tools like Exocharts and anchored VWAPs, these trades become sniper entries rather than coin flips.
Let the market show its hand — and trade the reaction, not the prediction.
📌 Summary:
This is how you avoid overtrading in chop: wait for key levels, watch how price reacts, and let trapped traders create the move. If BTC revisits the $105K region, it’s a major area to watch for reaction — or to take partials if you’re in a short.
The best trades come from patience + precision.
_________________________________
If you found this helpful, leave a like and comment below! Got requests for the next technical analysis? Let me know.

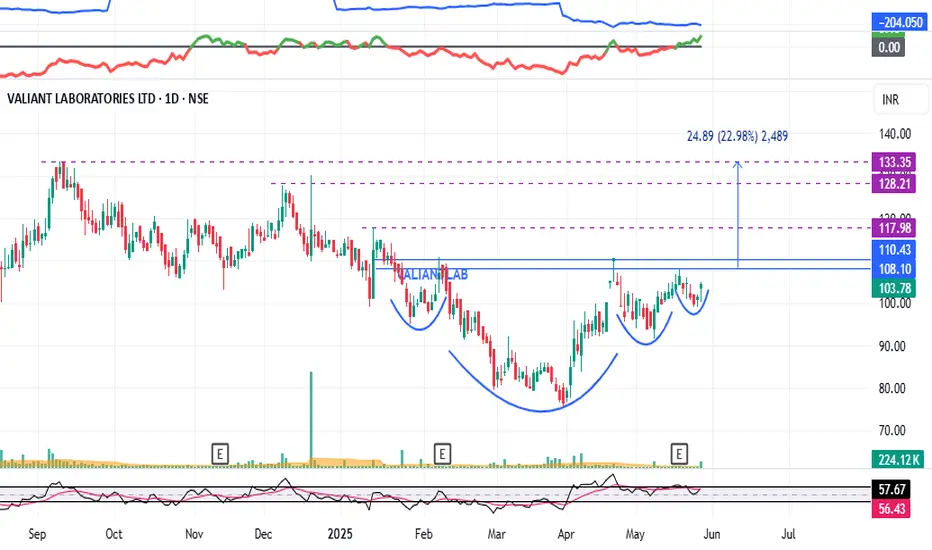
VALIANTLAB : Breakout Candidate (Swing Pick)#VALIANTLAB #swingtrading #breakoutstock #momentumstock
VALIANT LAB : Swing Trade
>> Cup & Handle Formation Visible
>> VCP Structure also Visible
>> Good Strength in stock
>> Volume Contraction seen, Expansion imminent
>> Potential Upside 23%
Swing Traders can lock 10% profit and keep trailing.
Disc : Stock chart shared for Learning Purpose and not a Trade recommendation.
BTC ANALYSIS🔆#BTC Analysis : Channel Following ⛔️⛔️
As we can see that #BTC is following ascending channel on 4h time frame. We can see a bullish formation here. And if it trade with good volume then we can see a proper bullish move in #BTC
🔖 Current Price: $108700
⏳ Target Price: $115300
⁉️ What to do?
- Keep your eyes on the chart, observe trading volume and stay accustom to market moves.🚀💸
#BTC #Cryptocurrency #ChartPattern #DYOR

EURJPY: Important Breakout 🇪🇺🇯🇵
EURJPY broke a significant resistance cluster on a daily.
We see its retest now.
I think that the price will start rising from that and reach
at least 164.5 level.
❤️Please, support my work with like, thank you!❤️
I am part of Trade Nation's Influencer program and receive a monthly fee for using their TradingView charts in my analysis.

Sail BullishAfter a long consolidation at the bottom Sail has formed a Bullish engulfing candle at the bottom and giving a breakout of the resistance level.
Entry- 111-112
Support- 107.5-107
Target- 120, 125
Disclaimer- This is just for educational purpose please take advice from your financial advisor before making any decision.
Jai Shree Ram

GAIL BUY TRADEEntry- 192-192.3
SL- 189-189.2
Target- 196.7, 198, 200
Reason- Breakout of a falling trendline in 1hr timeframe. The stock is also coming out of consolidation zone.
Disclaimer- This is just for educational purpose please.
Jai Shree Ram.

UBER – Momentum Pullback to 20 SMA: Classic Continuation SetupUber is giving one of my favorite swing setups — a shallow pullback into the “bone zone” (between the 9 EMA and 20 SMA) during a hot market.
🔹 Trend Continuation Play
Strong momentum stock pulling back right into the 20 SMA — not a deep retrace, just enough to reload.
In hot markets, I don’t wait for deep dips — I want tight consolidations into momentum zones.
🔹 The Bone Zone Setup
The shaded area between the 9 EMA and 20 SMA is where momentum stocks often base before the next leg up.
Price is respecting that zone perfectly — no breakdown, just controlled digestion.
🔹 Oversold Stochastics
Stochastics are in oversold territory — adds confirmation that this is a high-quality dip within a strong trend.
My Trade Plan:
1️⃣ Entry: Looking to start a swing position off the 20 SMA.
2️⃣ Add: On confirmation candle back above 9 EMA with volume.
3️⃣ Stop: Below 20 SMA lows — tight risk, strong reward if trend continues.
Why I Love This Setup:
Market’s hot — I want to ride strength, not fade it.
NYSE:UBER is a trending name with institutional accumulation.
This pattern has worked again and again in strong tape.

Pancake swing tradePancake is getting ready to release all the pressure that was build up inside of it.
we have vast amount of liquidity above us that we need to take.
Get ready! 🚀🌕
(You have the full responsibility for each action that u take because I'm not your financial advisor)

Ethereum - The bottom is finally in!Ethereum - CRYPTO:ETHUSD - is starting the rally:
(click chart above to see the in depth analysis👆🏻)
Finally, after dropping an expected -65% over the past couple of months, Ethereum is retesting and already rejecting a significant horizontal structure. Together with the strong confluence of support, Ethereum is now creating a long term bottom, initiating the next bullish cycle.
Levels to watch: $2.000, $4.000
Keep your long term vision!
Philip (BasicTrading)

Understanding How Dark Pool Buy Side Institutions AccumulateThe SPY is the most widely traded ETF in the world. Its price or value movement reflects the S&P 500 index value. It doesn't reflect the buying or selling of the SPY.
You must use volume indicators and accumulation/distribution indicators that indicate whether the Buy Side Institutions are in accumulation mode, rotation to lower inventory to buy a different ETF or other instrument, OR distribution due to mutual fund and pension fund redemption demands.
ETFs are one of the fastest growing industries in the US and around the world. There are more than 4000 Exchange Traded Derivatives. There are ETDs for just about anything you might wish to invest in long term or trade short term.
If you trade the SPY, it is important to study the S&P 500 index, its top 10 components, how their values are changing, and resistance and support levels. SPY will mirror the S&P 500 closely but not precisely.
ETFs are built with a variety of types of investments and always have a TRUST FUND, in which the components of that ETF inventory are held. The ETF Inventory is updated and adjusted monthly or sooner as needed to maintain the integrity of the ETF price value to the value of the S&P 500 index. Rules and regulations require that the ETF SPY be closely aligned to the S&P 500. So inventory adjustments are going on regularly.
When trading the SPY, you must remember that it is not buyers and sellers of the ETF that change its price. Rather, it is the S&P 500 top components' price fluctuations that change the SPY price value.
This is a tough concept to accept and understand. When you do understand it and apply that knowledge to your trading of the SPY, you will be far more profitable. This takes time. You also need to develop Spatial Pattern Recognition Skills so that when a pattern appears, you can recognize it instantly and act accordingly in your trading.
Today we cover the resistance levels above the current price value. That resistance is likely to slow down the rapid gains in price value over the past few weeks. The ideal would be a sideways trend to allow corporations time to adjust to the new normal of whatever tarrifs are impacting their imports and exports.
Then, the S&P500 move out of that sideways trend would result in a stronger Moderately Uptrending Market Condition.
Trade Wisely,
Martha Stokes CMT

ETH ANALYSIS🔴 #ETH Analysis : ❓❓
🔮There is a formation of "Bullish Pennant Pattern" in #ETH in 4HR time frame. We can expect around $2800 bullish move if the price break the pattern.📈
⚡️What to do ?
👀Keep an eye on #ETH price action. We can trade according to the chart and make some profits. ⚡️⚡️
#ETH #Cryptocurrency #Breakout #DYOR


Bitcoin - Approaching the all time high!Bitcoin - CRYPTO:BTCUSD - will break out again:
(click chart above to see the in depth analysis👆🏻)
It has been quite some time since we saw such a strong move on Bitcoin. But finally - not totally unexpected to be honest - Bitcoin is following its destiny and about to create another new all time high. Patience is key and strategy, risk and mindset will help you master the volatility.
Levels to watch: $100.000
Keep your long term vision!
Philip (BasicTrading)

MARUTIi Observed these Levels based on Price Action and Demand & Supply which is my own Concept "PENDAM CONCEPTS"... Please don't take any trades based on this chart/post... Because this chart is for educational purpose only not for Buy or Sell Recommendation... Thank Q

Why EUR vs GBP Could Be Your Best Trade This Week!When it comes to forex swing trading or even forex intraday trading, the temptation to zoom into lower timeframes—like the 15-minute or 1-hour charts—is strong. Most forex traders focus on short-term momentum, often diving into scalping strategies that chase quick pips. However, the real edge lies where most don’t look: the higher timeframes, particularly the weekly chart. The EUR/GBP forex pair is a perfect example of these higher timeframes' power, especially when paired with smart money concepts like demand and supply imbalances.
EUR/GBP: A Hidden Gem for Forex Swing Traders
The EUR/GBP Forex cross pair is often overlooked compared to major USD-based pairs. However, for seasoned swing traders and institutional players, EUR/GBP offers deep liquidity, cleaner technical analysis and price action structures, and strong reaction zones that are respected time and time again.
At the end of May 2025, a significant weekly demand imbalance at 0.8384 finally took control of price action—something smart money traders had been anticipating for months. This wasn't a surprise for those watching the higher timeframes. Similar to how the previous weekly imbalance at 0.8299 took control in February 2025, these zones have proven critical in guiding the medium- to long-term direction of EUR/GBP.

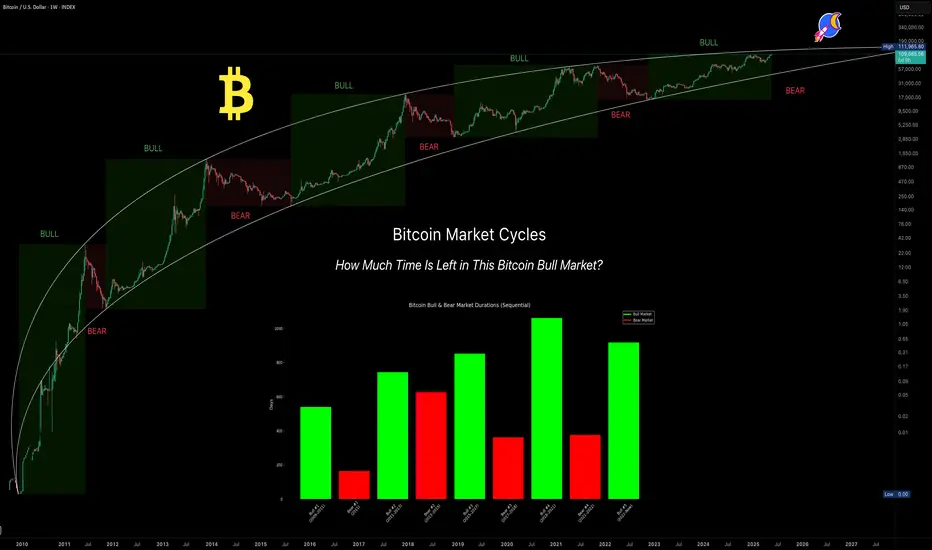
Bitcoin's Market Cycles — Are We Nearing the Top?Bitcoin is approaching a critical moment and the signs are everywhere.
After more than 900 days of steady bull market growth, BTC now flirts with all-time highs (ATH) while momentum stalls, liquidity thins, and emotions run hot. You might be asking:
Are we nearing the cycle top?
Is now the time to de-risk or double down?
What comes next?
This isn’t just a question of price. It’s about timing, structure, and psychology.
In this analysis, we’ll break down Bitcoin’s historical cycles, the current macro structure, the hidden signals from Fibonacci time extensions, and how to think like a professional when the crowd is chasing FOMO.
Let’s dive in.
📚 Educational Insight: Understanding Bitcoin Cycles
Bitcoin doesn’t move in straight lines, it moves in cycles.
Bull markets grow slowly, then explode. Bear markets fall fast, then grind sideways. These rhythms are driven by halving events, liquidity expansions, and most importantly: human emotion.
Here’s what history tells us:
Historical Bull Markets:
2009–2011: 540 days (+5,189,598%)
2011–2013: 743 days (+62,086%)
2015–2017: 852 days (+12,125%)
2018–2021: 1061 days (+2,108%)
2022–Present: 917 days so far (+623%)
Bear Market Durations:
2011: 164 days (-93.73%)
2013–2015: 627 days (-86.96%)
2017–2018: 362 days (-84.22%)
2021–2022: 376 days (-77.57%)
💡 What does this tell us?
Bull markets are growing longer, while bear markets have remained consistently brutal. The current cycle has already surpassed the average bull run length of 885 days (cycles #2–#4) and is quickly approaching the 957-day average of the two most recent cycles (#3 and #4). That makes this the second-longest bull market in Bitcoin’s history.
⏳ 1:1 Fibonacci Time Extension — The Hidden Timing Signal
In time-based Fibonacci analysis, the 1.0 (1:1) extension means one simple thing: this cycle has now lasted the same amount of time as previous cycles — a perfect time symmetry.
Here’s how I measured it:
Average bull market length #2–#4(2011–2021): 885 days
Average bull market length #3–#4(2015–2021): 957 days
Today’s date: May 27, 2025 = Day 917
✅ Result: We are well inside the time window where Bitcoin historically tops out.
You don’t need to be a fortune teller to see that this is a zone of caution. Markets peak on euphoria, not logic and this timing confluence is a red flag worth watching.
🗓️ "Sell in May and Go Away" — Not Just a Meme
One of the oldest market adages is showing its teeth again.
Risk assets — including Bitcoin — tend to underperform in the summer months. Why?
Lower liquidity
Institutional rebalancing
Exhaustion from prior run-ups
Vacations and reduced trading volumes
And here we are:
Bitcoin is hovering near ATH
It's been in an uptrend for 917 days
We just entered the time-extension top zone
Liquidity is thinning across the board
You don’t need to panic. But you do need to think like a professional: secure profits, reduce exposure, and wait for structure.
😬 FOMO Is a Portfolio Killer
This is where most traders make their worst decisions.
FOMO (Fear of Missing Out) isn’t just a meme — it’s the reason so many people buy tops and sell bottoms.
Before entering any trade right now, ask yourself:
Where were you at $20K?
Did you have a plan?
Or are you reacting to headlines?
📌 Clear mind > urgent clicks
📌 Patience > chasing green candles
📌 Strategy > emotion
Let the herd FOMO in. You protect your capital.
Will This Bear Market Be Different?
Every past cycle saw BTC retrace between 77%–94%. That was then. But this time feels… different.
Here’s why:
Institutions are here — ETF flows, sovereign wealth funds, and major asset managers
Regulation is clearer — and risk capital feels safer deploying in crypto
Supply is tighter — much of BTC is now held off exchanges and in cold storage
While a massive crash like -80% is less likely, that doesn’t mean a correction isn’t coming. Even a 30%–40% drop from here would wreak havoc on overleveraged traders.
And that brings us to…
🚨 Altseason? Or Alt-bloodbath?
Here’s the hard truth:
If BTC corrects, altcoins will crash — not rally.
Most altcoins have already seen strong rallies from their cycle lows. But if BTC drops 30%, many alts could tumble 50–80%.
Altseason only happens when BTC cools off and ranges — not when it dumps. Don’t get caught holding the bag. Be tactical. Be disciplined.
So Where’s the Next Big Level?
You may be wondering: “If this is the top… where do we fall to?”
Let’s just say there’s a very important Fibonacci confluence aligning with several other key indicators. I’ll reveal it in my next analysis, so stay tuned.
🧭 What Should You Do Right Now? (Not Financial Advice)
✅ Up big? — Take some profits
✅ On the sidelines? — Wait for real setups
✅ Emotional? — Unplug, reassess
✅ Are you new to Trading? — study, learn (how to day trade) and prepare for the next cycle
The best trades come to the calm, not the impulsive.
💡 Final Words of Wisdom
Bitcoin rewards discipline. It punishes emotion.
Right now is not about catching the last 10% of upside — it’s about:
Watching structure for potential trend change
Measuring risk
Avoiding overexposure
Protecting what you’ve earned
📌 The edge isn’t in indicators. It’s in mindset. Stay prepared, stay sharp because in this market…
🔔 Remember: The market will always be there. Your capital won’t — unless you protect it.
The next big opportunity doesn’t go to the loudest.
It goes to the most ready.
_________________________________
Thanks for reading and following along! 🙏
Now the big question remains: Is a bear market just lurking around the corner?
What are your thoughts? Let me know in the comments. I’d love to hear your perspective.
_________________________________
If you found this helpful, leave a like and comment below! Got requests for the next technical analysis? Let me know.