KPIT TECH LONGEntry- 1200 (OR any dip till 1188)
Support- 1150 (which is the hammer candle low)
Target- 1300
Reason- A great reversal can be seen with a hammer candle in 4hr and a bullish engulfing in `1hr with 4hr RSI being oversold.
Disclaimer- This is just for educational purpose please take advice from your own financial advisor before taking any decision.
Jai Shree Ram.
Swingtrading

Cummins India LongEntry- 2805-2810. ( Any dip till 2780 will be a buying opportunity)
Support- 2650
Target- 2950, 3000
Pattern- Looking great for a reversal from hereon. Making a bullish engulfing on daily chart and a sort of triple bottom around 2600 levels.
Disclaimer- This is just for education purpose please take advice from your financial advisor before making any decision.
Jai Shree Ram.

BTC Scaling Strategy: Trade Like a Pro with Precision EntriesIf you’re new to trading, this guide will walk you through a scaling in and out strategy. We’ll cover:
Risk management – protecting your capital.
Entry points – how to build your position gradually.
Exit points – how to lock in profits while leaving room for further gains.
Maximising profit – using a small runner to capture additional upside.
By the end, you'll understand:
✅ How to enter trades at optimal levels
✅ How to take profits gradually
✅ How to manage risk so you don’t blow your account
BTC Market Analysis
Bitcoin has been trading in a tight range for over 100 days near the 100K mark. For 22 consecutive days, bulls have tried to break above 100K, but as the price nears this level, bears consistently rejected the move. Currently, BTC broke below our critical support level at 90K confirming a breakdown in market structure. Adding fuel to the bearish fire, Bitcoin has slipped below the weekly 21 EMA (89,503) and SMA (90,437). With the bears now in control, the critical question emerges: Where will Bitcoin find its next foothold? Let’s map the high-probability support zones and strategic entry points for the next potential long opportunity.
Using Fibonacci analysis:
Fib Speed Fan: With a low of 49K and an ATH of 109,588 (from March), the 0.618 trend line projects support between about 78K and 82K.
Anchored VWAP: When anchored from 49K, the VWAP support is around 81.7K.
Negative Fibonacci Retracement: From the ATH down to the current low at 91,231, the –0.618 level is at about 79,886.
Fib Extension & Retracement: Additional levels lie around 79,466 (1.618 extension) and 79,230 (0.5 retracement).
Moving Averages: The 233 EMA/SMA currently ranges between roughly 83K and 78.5K.
These indicators converge to form a robust support zone between approximately 83K and 78K. For a more detailed breakdown, please check my previous Bitcoin analysis, where I conducted a deeper examination.
Step 1: Understanding Risk Management (The Golden Rule)
Before placing a trade, you must decide:
📌 How much you’re willing to lose (risk per trade)
📌 Where you’ll enter and exit (never place a trade without a plan)
How Much Should You Risk?
Always risk no more than 1–2% of your total account on a single trade.
Example (for a $100K Account):
1% Risk = $1,000 max loss
2% Risk = $2,000 max loss
For this trade, we plan to risk about $1,366, which is approximately 1.37% of a $100K account. This disciplined approach protects your capital over the long run.
Step 2: Where Do We Enter the Trade? (Scaling In)
Instead of going all-in at one price, we break our $30,000 investment into 10 smaller entries and exits. This method reduces risk and often achieves a better average entry price.
💡 Why? Because no one can time the exact bottom! Spreading entries reduces risk and gets a better average entry price.
www.tradingview.com
BTC Buy (Entry) Levels
We will buy BTC as it falls from $83,050 down to $78,050 using the following allocation percentages:
Entry # Price (BTC) % of Position Amount Invested ($) BTC Acquired
1 83,050 5% $1,500 1,500 ÷ 83,050 = 0.018072
2 82,550 5% $1,500 1,500 ÷ 82,550 = 0.018181
3 82,050 5% $1,500 1,500 ÷ 82,050 = 0.018278
4 81,550 8% $2,400 2,400 ÷ 81,550 = 0.029430
5 81,050 8% $2,400 2,400 ÷ 81,050 = 0.029606
6 80,550 10% $3,000 3,000 ÷ 80,550 = 0.037234
7 80,050 12% $3,600 3,600 ÷ 80,050 = 0.044974
8 79,550 12% $3,600 3,600 ÷ 79,550 = 0.045275
9 79,050 15% $4,500 4,500 ÷ 79,050 = 0.056956
10 78,050 20% $6,000 6,000 ÷ 78,050 = 0.076352
Total Investment: $30,000
Total BTC Acquired:
0.018072 + 0.018181 + 0.018278 + 0.029430 + 0.029606 + 0.037234 + 0.044974 + 0.045275 + 0.056956 + 0.076352 ≈ 0.37436 BTC
Average Entry Price: $80,150
Stop Loss: Set at $76,500
Risk per BTC: $80,150 – $76,500 = $3,650
Total Risk: 0.37436 BTC × $3,650 ≈ $1,366 (~1.37% of $100K)
Step 3: Where Do We Exit the Trade? (Scaling Out)
We exit gradually as BTC rises between $86,950 and $91,450. The exit percentages are as follows:
Exit # Price (BTC) % of Position BTC Sold Proceeds ($)
1 86,950 5% 0.018718 0.018718 × 86,950 = $1,628.10
2 87,450 5% 0.018718 0.018718 × 87,450 = $1,637.03
3 87,950 8% 0.029949 0.029949 × 87,950 = $2,638.15
4 88,450 12% 0.044924 0.044924 × 88,450 = $3,976.39
5 88,950 14% 0.052420 0.052420 × 88,950 = $4,664.19
6 89,450 14% 0.052420 0.052420 × 89,450 = $4,691.19
7 89,950 12% 0.044924 0.044924 × 89,950 = $4,047.12
8 90,450 10% 0.037436 0.037436 × 90,450 = $3,388.20
9 90,950 5% 0.018718 0.018718 × 90,950 = $1,705.71
10 91,450 15% 0.056154 0.056154 × 91,450 = $5,137.68
Total BTC Sold: 0.018718×3 + 0.029949 + 0.044924×2 + 0.052420×2 + 0.037436 + 0.056154 = 0.374381 BTC (matches our total acquired ~0.37436 BTC)≈ $33,488.26
Profit on the Trade: Total Proceeds – Total Investment = $33,488.26 – $30,000 = +$3,488.26
Return on the Trade:
$3,488.26/$30,000×100≈11.63%
On Overall Account: For a $100K account, $3,488 represents a gain of about 3.49% if fully realised on this trade.
Risk-to-Reward Ratio: Risk = $1,366; Reward = $3,488; Ratio ≈ $3,488 / $1,366 ≈ 2.55:1
Step 4: Profit & Risk Summary
Metric – Per Trade - Based on $100K Account
Total Investment - $30,000 - $30,000 (30%)
Risk (Stop Loss) - $1,366 (4.6%) - $1,366(1.37%)
Profit (Closed) - $3,488 (11.63%) - $3,488 (3.49%)
Profit + Runner - $4,311.18 (14.37%) - $4,311.18 (4.31%)
Risk-to-Reward Ratio Calculation:
If Stop Loss Hits ($76,500):
Average Entry Price: $80,150
Loss per BTC: $80,150 – $76,500 = $3,650
Total Risk: 0.37436 BTC × $3,650 ≈ $1,366 (1.37% of a $100K account)
If BTC Reaches Our Exit Targets:
Total Proceeds: ≈ $33,488
Profit: $33,488 – $30,000 = $3,488
Profit Percentage on Trade: ~11.63%
Overall Account Impact: ~3.49% gain on a $100K account
Risk-to-Reward Ratio: ~2.55:1
Step 5: The Power of Scaling In & Out
Capital Protection: You risk only about $1,366 (1.37% of a $100K account), protecting your capital even during a series of losses.
Optimised Entry: Scaling in from $83,050 to $78,050 yields an average entry of about $80,150—significantly lower than the top price.
Profit Locking: Scaling out from $86,950 to $91,450 allows you to lock in profits at multiple levels, ensuring you capture gains along the way.
Healthy R:R: With a risk-to-reward ratio of approximately 2.55:1, your potential reward significantly outweighs your risk.
Discipline & Consistency: This structured approach minimises emotional trading and helps you stick to your plan.
Optional Note: While this guide fully closes the trade, leaving a small portion (15%) open (runner) is an option if BTC continues to rally.
Step 6: Final Pre-Trade Checklist
🔹 Support & Resistance: Is BTC trading near a strong support zone?
🔹 Technical Indicators: Is BTC holding above key moving averages (e.g., 21 EMA/SMA)?
🔹 Risk Management: Are you only risking 1–2% of your total account?
🔹 Trade Plan: Are you scaling in and out instead of going all-in? Are your entry levels and exit levels clearly defined?
🔹 Market Confirmation: Do volume, candlestick patterns, and order flow support your trade setup?
Conclusion
✅ We protect our money by limiting risk
✅ We enter trades gradually (scaling in)
✅ We take profits at multiple levels (scaling out)
✅ We fully close the trade or leave some BTC open to ride the trend higher
Final Tips:
Common Mistakes to Avoid
👉 Overleveraging – 10x leverage + 2% risk = 20% account risk!
👉 Ignoring Volatility – Tight stops on Bitcoin often trigger early exits.
👉 Never trade based on emotions. Stick to your plan, adhere strictly to your risk management rules, and let your disciplined strategy work in your favour.

AUDUSD: Bearish Outlook For Next Week Explained 🇦🇺🇺🇸
AUDUSD broke and closed below a significant daily horizontal support on Friday.
It feels like the pair is returning to a global bearish trend.
The market will most likely continue falling.
Next support - 0.61725
❤️Please, support my work with like, thank you!❤️

Buy Visa Inc.Short Term Trading Advice by Naranj Capital
Buy Visa Inc.
● Buy Range- 347 - 351
● Target- 361 - 364
● StopLoss- 342
● Potential Return- 3-4%
● Duration- 14-15 Trading Days

Cardano - The Historic Rally Of +700%!Cardano ( CRYPTO:ADAUSD ) perfectly repeats the previous cycle:
Click chart above to see the detailed analysis👆🏻
Cardano perfectly retested a major horizontal support in the beginning of 2023. Recently we then saw the break above the neckline of the double bottom formation and a rally of about +400%. Cardano is clearly repeating the cycle of 2021 and a potential rally of another +700%.
Levels to watch: $0.7, $6.0
Keep your long term vision,
Philip (BasicTrading)

Tesla - Elon Is Playing The Charts!Tesla ( NASDAQ:TSLA ) is perfectly respecting structure:
Click chart above to see the detailed analysis👆🏻
Two months ago Tesla perfectly retested the previous all time high resistance and closed with a massive rejection wick. This means that a correction - which is currently happening - is expected and after the bullish break and retest, we will then finally see new all time highs.
Levels to watch: $280, $400
Keep your long term vision,
Philip (BasicTrading)


NASDAQ ENTRY ON THE FLOOR?! 4H chart Sep-Feb 27.2.25Simple up-trend with a recent confirmation of support.
September24 to Feb 25 is consistent and predictable with an average 7 to 11% rise from the support within a time frame of up to 6 weeks.
If the price closes a 4h candle below the line (20,850) - Up-trend will be broken, as long as the price keeps above, aiming for $800-$1500 swing trade up can be very profitable.
Make logical, consistent decisions based on an overall plan with risk management as top priority.

GBPNZD: Bullish Pattern & Breakout 🇬🇧🇳🇿
GBPNZD formed a bullish accumulation pattern on a daily.
Its neckline was broken with a high momentum bullish candle yesterday.
The next strong resistance is 2.236.
It will most likely be the next goal for the buyers.
❤️Please, support my work with like, thank you!❤️

Why USD/JPY looks ripe for a bounceWith key levels holding and bullish divergences forming, USD/JPY looks like it may want to retrace higher over the near term before its bearish trend resumes and head for the 146 - 47 area.
Matt Simpson, Market Analyst at City Index and Forex.com

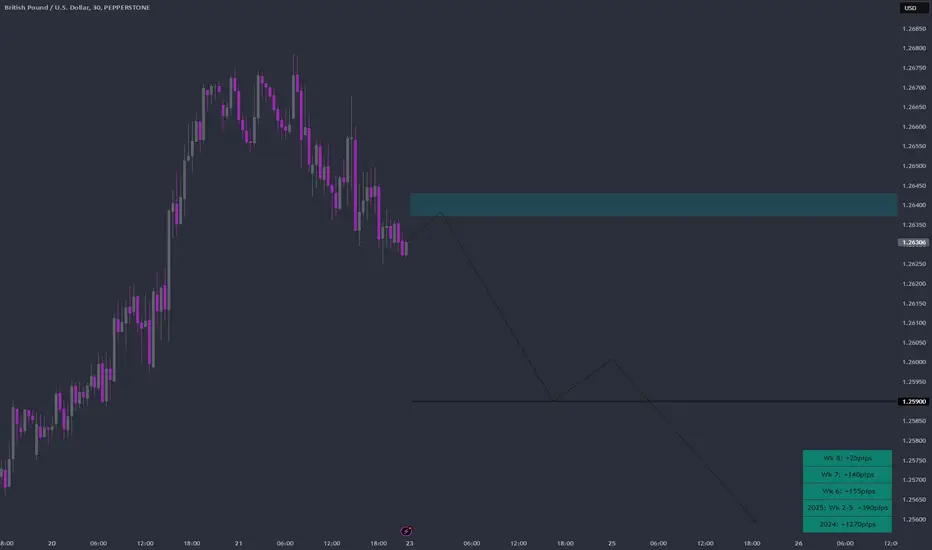
GBPUSD Week 9 Swing Zone/LevelsLast week saw a few pinched pips and also few losses. This highlights the benefit of having a good risk to reward ratio.
Weekly zone and levels are mapped based on previous week daily high-low relationship (ie Monday HL in relation to Tuesday in relation to Wednesday HL, etc). This generates a fairly accurate levels with actual price action determining trades.
SL, stoploss is usually btw 10-15pips
TP, Takeprofit is 5-10x that, with sl moving to BE, breakeven once trade pinches +20pips.
USD/CAD rallies for fourth day into resistanceUSD/CAD has continued higher for a fourth day, but I suspect this is part of a countertrend move around a larger move lower.
Market positioning his extreme levels of record short exposure to CAD futures last year, and many of these bears refused to return despite USD/CAD continuing higher. The sharp reversal lower from 1.48 also suggests we have seen a significant top on the pair.
I am now seeking evidence of a swing high around the 1.4386 HVN (high-volume node) and for momentum to realign with the sharp selloff witness at 1.48.
Matt Simpson, Market Analyst at City Index and Forex.com

AUD/USD dip could be nearing its inflection pointAfter a 3-week rally which stalled around the 64c handle with a shooting star candle, a pullback was almost inevitable. but we have already seen AUD/USD fall for four consecutive days, and recent history shows its bearish streaks tend to max out at five down days. Given support is nearby and the AU-US 2-year yield is rising, I am now seeking a swing low around the 0.62750 - 0.6300 area for at least a minor bounce.
But if the recent swing low on the US dollar index gives way, perhaps something much bigger.
A break above 0.6420 opens up a run to 0.6500.
Matt Simpson, Market Analyst at City Index and Forex.com

S&P500 - The 2025 Bullrun Just Started!S&P500 ( TVC:SPX ) will rally massively during 2025:
Click chart above to see the detailed analysis👆🏻
Over the past couple of years, the S&P500 has perfectly been respecting the trendlines of a rising channel formation. After the recent rally of +70%, it is quite likely that - following the 2020 cycle - we will see another final rally of about +20% before the S&P500 will correct itself.
Levels to watch: $7.000
Keep your long term vision,
Philip (BasicTrading)

Update on HYPE Swing TradesPerfectly bounced on Medium Support from original idea. I took a long there and already sold. Now waiting for a small swing down to re-enter.
Original Idea:

CADJPY: Massive Breakout 🇨🇦🇯🇵
There is a high probability that CADJPY will drop much lower.
The violation of a significant daily demand cluster leaves clear bearish clues.
Next support - 103.5
❤️Please, support my work with like, thank you!❤️

Buy Costco Wholesale CorporationShort Term Trading Advice by Naranj Capital
Buy Costco Wholesale Corporation
● Buy Range- 1035 - 1050
● Target- 1101 - 1110
● StopLoss- 1010
● Potential Return- 5-6%
● Duration- 12-14 Trading Days

BERGEPAINT good to studyNSE:BERGEPAINT
Given Breakout of Range
Good to keep on the radar
Always respect SL & position sizing
========================
Trade Secrets By Pratik
========================
Disclaimer
NOT SEBI REGISTERED
This is our personal view and this analysis
is only for educational purposes
Please consult your advisor before
investing or trading
You are solely responsible for any decisions
you take on basis of our research.


EURCAD: Important Breakout 🇪🇺🇨🇦
EURCAD broke and closed above a key daily horizontal resistance.
The underlined blue area is also a neckline of a cup & handle pattern.
The violation indicates more growth.
Next resistance - 1.497
❤️Please, support my work with like, thank you!❤️

ASX 200 futures (SPI 200) stablising around 8200The ASX 200 futures market has fallen close to 5% from its all-time high, with 5 of the 7 candles since the top being bearish. However, the daily RSI (2) reached oversold on Friday, a bullish pinbar formed on Monday and a small bullish divergence is now forming on the daily and 1-hour chart. The pinbar low also found support at a weekly VPOC (volume point of control) and weekly S1 pivot.
Given the selloff came in a relatively straight line, I cannot help but suspect at least a minor bounce is due.
The near-term bias remains bullish while prices hold above last week’s low, and bulls could seek dips towards 8200 / 8191 VPOC area. 8300 and the weekly pivot point at 8345 could make viable upside targets for bulls.

