EURUSD Long: Impulse Up from Demand Line of TriangleHello, traders! The price auction for EURUSD has been consolidating for an extended period, forming a large symmetrical triangle pattern. This structure signifies a period of balance and contracting volatility, with key pivot points establishing the upper supply line near the 1.1735 SUPPLY level and the lower demand line originating from the 1.1575 DEMAND level. The market has been coiling within these boundaries, building energy for a decisive move.
Currently, the auction is at a critical inflection point. Following a rejection from the supply line, the price has completed a full rotation to the downside and is now directly testing the ascending demand line. This area represents a key potential support, where the market will decide if the bullish initiative can absorb the recent selling pressure and maintain the pattern's integrity.
The primary scenario anticipates a successful defense of this ascending demand line by buyers. A confirmed bounce from this dynamic support would validate the triangle pattern and signal that a bullish rotation back towards the upper boundary is underway. The take-profit is therefore set at 1.1730 points, targeting the descending supply line of the triangle, which is the logical objective for this rotational play. Manage your risk!
Symmetrical Triangle

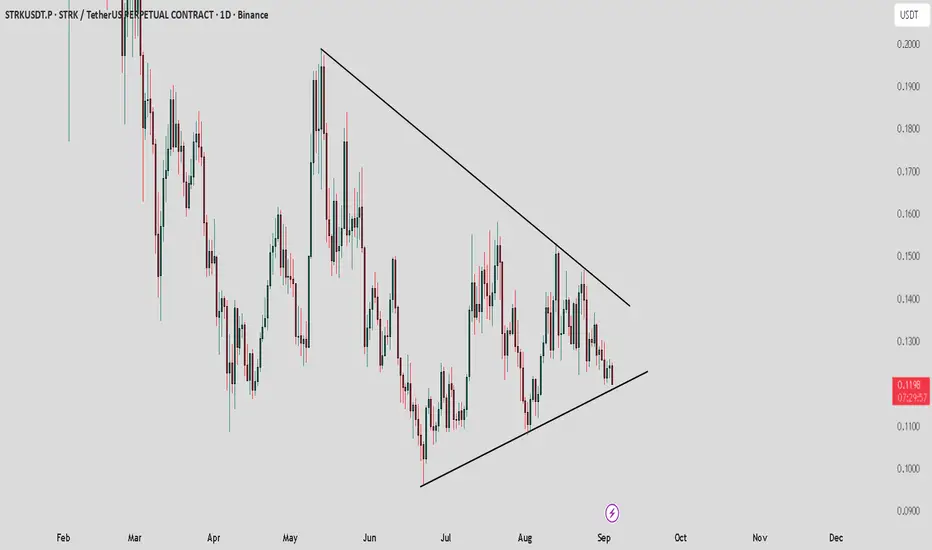
STRK / USDT : Near to support of symmetrical triangleSTRK/USDT is trading near the support of the symmetrical triangle.
Bullish scenario: If support holds, price could bounce toward the resistance at $0.13.
Bearish scenario: A breakdown from this support may drag price toward $0.096.
Always wait for confirmation before entering. Manage risk properly and trade according to market conditions.
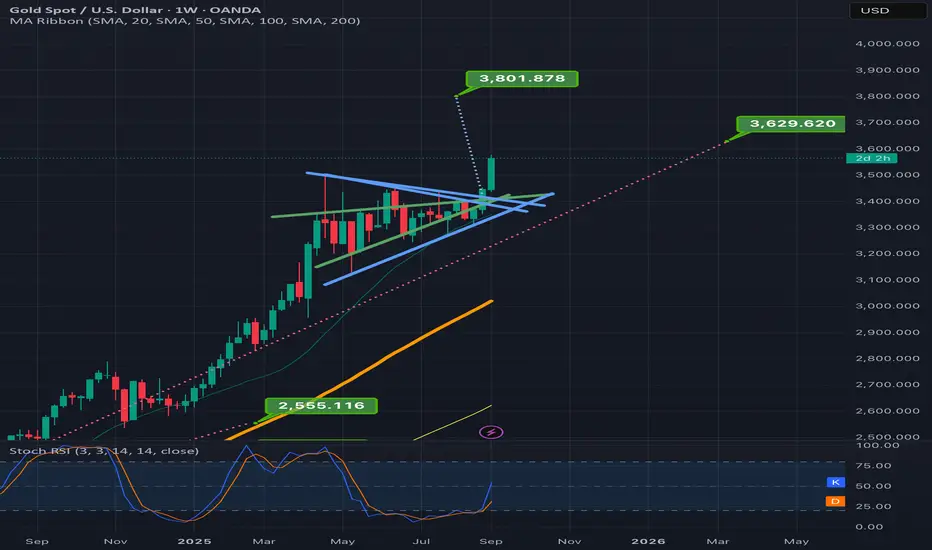
Gold is now less than $100 from hitting target I called in 2023Been a long journey but the top target I charted all the way back in 2023 for gold is about to get hit as we are now less than100 dollars away from that target. Based on this blue symmetrical triangle it is currently breaking up from we should not only hit the old target but surpass it and head to 3800 as well. *not financial advice*
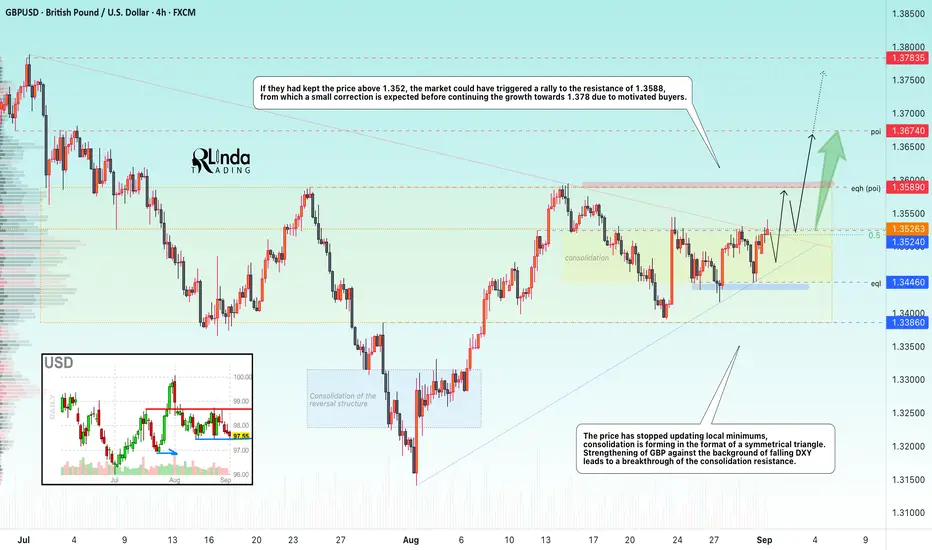
GBPUSD → Retest resistance for a breakout. Distribution?FX:GBPUSD is attempting to break through the resistance of the symmetrical triangle consolidation pattern, which is a continuation pattern of the main bullish trend.
Against the backdrop of stagnation and weakening of the dollar index, the GBPUSD price has stopped updating local lows, and consolidation in the form of a symmetrical triangle is forming. The strengthening of the GBP led to a breakout of the consolidation resistance, and if the bulls can stay above 1.352, then the market may trigger a rally to the resistance at 1.3588, from which a small correction is expected before continuing to grow to 1.378 thanks to motivated buyers.
Resistance levels: 1.3589, 1.3674
Support levels: 1.3524, 1.3446
In the 1.3525 zone, there may be a prolonged struggle for the buying area (above resistance). If the bulls manage to stay above the resistance conglomerate, this will confirm the fact of a resistance breakout and the end of the downward correction, which may trigger a continuation of the global trend and price growth to 1.378.
Best regards, R. Linda!
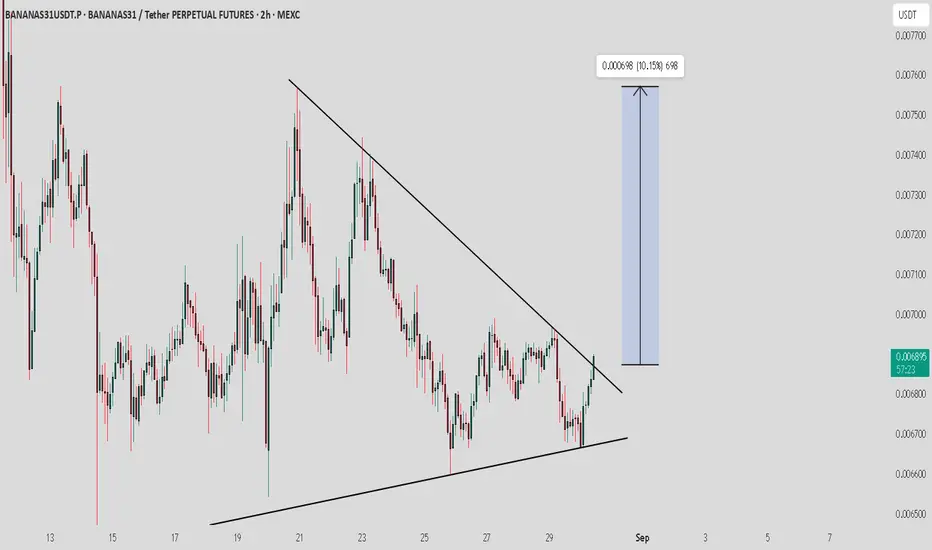
BANANAS31 / USDT : Breaking out from symmetrical triangleBANANAS31/USDT is breaking out of its trendline resistance. If this breakout holds, a short-term rally toward $0.0075 looks likely.
📌 Best strategy: Wait for confirmation through a bullish move or successful retest before entering. Always manage risk and avoid chasing without confirmation.
GOLD → Retest 3400 before the news. Will there be a rally?FX:XAUUSD is pulling back slightly after hitting a new high of 3423. The trend is bullish, and on the D1 chart we see a breakout of a symmetrical triangle, which generally hints at bullish potential.
Gold is correcting after rising to $3423 in anticipation of US PCE inflation data.
Key factors: Doubts about the Fed's independence are limiting the USD's strengthening. Soft Fed rhetoric: Board member Waller supported a rate cut in September and further easing. The probability of a September rate cut is estimated at 87%.
Today's news: Core PCE inflation data (forecast: 2.6% y/y).
If below forecast → increased expectations for policy easing → support for gold
If above forecast → dollar strength → gold correction
Short-term gold dynamics depend on inflation data and its impact on Fed rate expectations
Support levels: 3405, 3394, 3386.5
Resistance levels: 3415, 3423, 3433
As part of the correction, the price may test liquidity zones and enter a consolidation phase ahead of the news. However, the market is one step away from distribution (exit from a symmetrical triangle). If the bulls keep the price above 3400 as part of the correction, we will have a good chance to catch the rally...
Best regards, R. Linda!

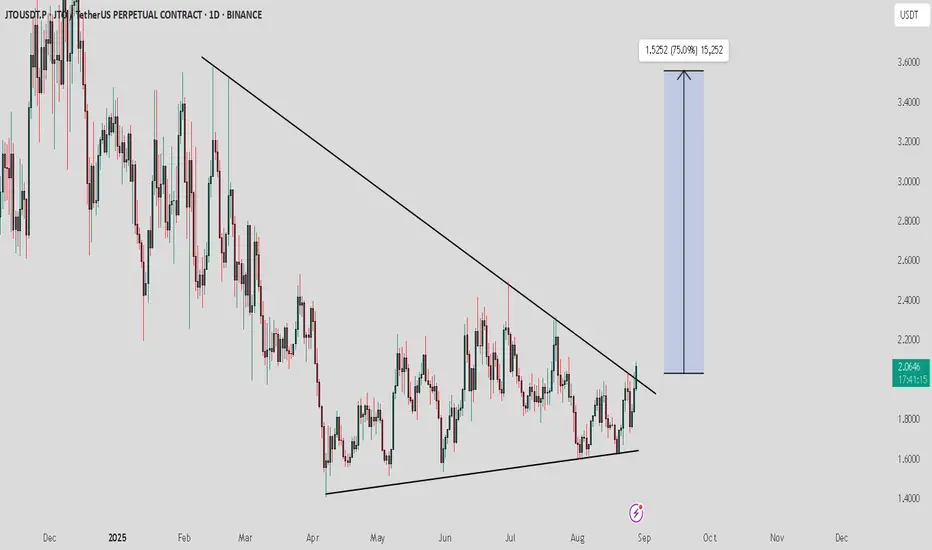
JTO / USDT : Breaking out from symmetrical triangleJTO/USDT is breaking out of a symmetrical triangle pattern. If this breakout sustains, we could see a strong bullish rally toward the $3 – $4 zone.
Recommendation: Spot buying is favorable here — enter after confirmation and consider holding for midterm gains. Always manage risk wisely.
GOLD → Bullish trend. Pullback before growthFX:XAUUSD continues to gradually storm the 3375-3405 area, paving its way to strong resistance at 3410. The fundamental background is relatively positive, with a bullish trend.
Gold has retreated slightly from its two-week peak ($3400), but retains its growth potential against the backdrop of two key factors: Pressure on Fed Chair Lisa Cook is undermining confidence in the dollar and strengthening demand for defensive assets. New tariffs on China and India are reviving fears about global growth, which is beneficial for safe havens.
But there are also restraining factors: A strong dollar could limit gold's growth. It is also worth paying attention to Friday's US inflation data (PCE), which will determine the further trend. Soft data will reinforce expectations of a Fed rate cut and push gold higher.
Resistance levels: 3386.5, 3393.5
Support levels: 3373.7, 3369.6
Movements up to 3410 may be zigzagging due to the fairly heavy zone of 3375 - 3410 (this can be seen in the volume profile). Focus on local but strong support: 3373 - 3369, the market may test this area before storming resistance 3386 - 3393 for growth to 3405 - 3410.
Best regards, R. Linda!

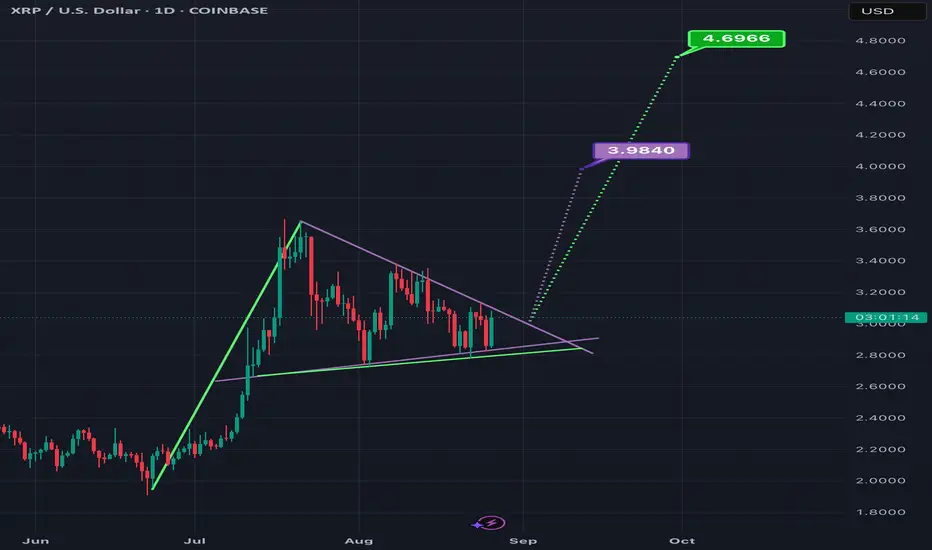
Symmetrical Triangle/ Bull Pennant on XRPUSD Nearing its ApexThe bottom trendline of this triangle definitely seems to have finally been narrowed down to this purple line and green line with multiple touch points to back that up. *not financial advice*
GOLD → Correction before continuing distribution to 3400FX:XAUUSD entered a correction phase at the start of the session after Friday's rally, triggered by positive fundamentals...
Gold is falling after Friday's rise, triggered by Powell's unexpectedly dovish comments in Jackson Hole. He confirmed the Fed's readiness to cut rates in September amid risks to employment and economic growth. The probability of a September rate cut has risen to 88%.
Gold is correcting after a sharp jump, but the downside potential is limited. Market attention is focused on PCE inflation data this week
Technically, the decline in gold prices may be temporary as the market continues to reassess the prospects for the Fed's dovish policy. The key factor will be Friday's PCE data, which will confirm or adjust expectations for an aggressive rate cut.
Support levels: 3358, 3350, 3340
Resistance levels: 3375, 3405
The 3358-3350 area acts as a strong support zone, and it is also worth paying attention to the previously broken downward consolidation resistance. The market may test the support zone before rising, and a false breakdown and consolidation above the support level could have a bullish impact on the market...
Best regards, R. Linda!

GOLD → Consolidation and news. What are the chances for growth?FX:XAUUSD is consolidating in a symmetrical triangle pattern. Market uncertainty remains high. The global trend is bullish, while the local trend is neutral. What can we expect from gold?
Gold is falling ahead of Powell's speech in Jackson Hole. The dollar is strengthening on strong US economic data (housing sales and PMI growth), which reduces the likelihood of an early easing of Fed policy.
Key factors:
Powell may confirm a cautious approach to rate cuts. The probability of a rate cut in September has fallen to 75%. The rise of the dollar as a “safe haven” is putting pressure on gold
Scenarios after the speech:
Hawkish tone from Powell → dollar rises → gold falls below $3300.
Soft signal → dollar correction → gold recovery
Technically , the gold casino continues and it is difficult to determine in advance which way the symmetrical triangle will break, but if we bet on a bullish trend and the likelihood of an imminent interest rate cut, the most likely scenario is a rebound from the support zone followed by a breakout of resistance and a rise to local levels
Resistance levels: 3350, 3358, 3370
Support levels: 3323, 3320, 3315
A false breakout of the key support level, which is being defended quite aggressively by the bulls, could trigger an active recovery phase. However, it is important to keep an eye on Powell's speech, as well as Trump's, who will also be commenting this afternoon.
Best regards, R. Linda!

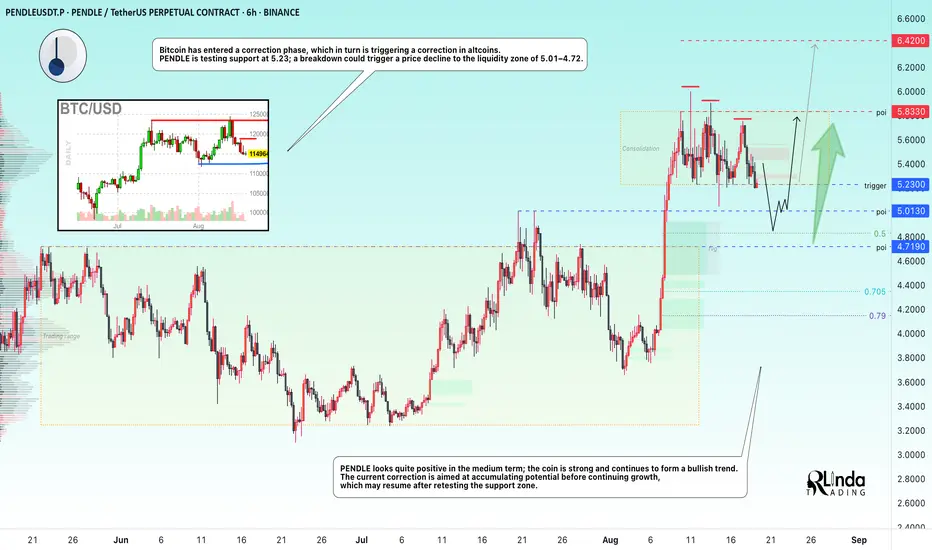
PENDLEUSDT → Retest of the 5.0 liquidity zone before rising to 7BINANCE:PENDLEUSDT is still consolidating, but is preparing to enter a correction phase, which could be triggered by a breakdown the 5.23 support level. Correction is a vital stage for further growth.
Bitcoin has entered a correction phase, which in turn is triggering a correction in altcoins. PENDLE is testing support at 5.23, and a break of this support level, which is already being tested for the sixth time, could trigger a price decline to the liquidity zone of 5.01 - 4.72
PENDLE looks quite positive in the medium term, the coin is strong and continues to form a bullish trend. The current correction is aimed at accumulating potential before continuing growth, which may resume after retesting the support zone.
Resistance levels: 5.833, 6.42
Support levels: 5.23, 5.013, 4.719
On the weekly chart, PENDLE is consolidating above the strong support level of 5.013. As part of the correction, the market may confirm this support and continue its growth towards the ATH from the mirror level.
Best regards, R. Linda!
GOLD → Breakthrough of downward resistance, news ahead...FX:XAUUSD is recovering after a fairly prolonged decline, and there are signs of bullish sentiment on the chart, but caution is advised as important news is ahead...
Gold is in a holding pattern. Its short-term fate depends on today's US economic data and, to a greater extent, on tomorrow's speech by Powell, which will set the tone for the future. The price is recovering slightly after a recent decline, but is trading cautiously.
The market is awaiting the release of S&P Global's business activity indices (PMI), which will assess the strength of the US economy and influence Fed rate forecasts. Another key event of the week is the Fed chair's speech in Jackson Hole on Friday. His comments on future interest rates will determine the further movement of gold and the dollar.
Technically, we are seeing a rebound from the support of a global symmetrical triangle, with bulls still in the market but waiting for further signals. Locally, we are seeing positive dynamics — a breakout of downward resistance and consolidation in the buying zone...
Resistance levels: 3350, 3370
Support levels: 3331, 3315
The conditions for further growth should be a positive fundamental background and the bulls holding the price above key support. A retest of the trading range boundary (0.5f) is possible before growth.
Best regards, R. Linda!

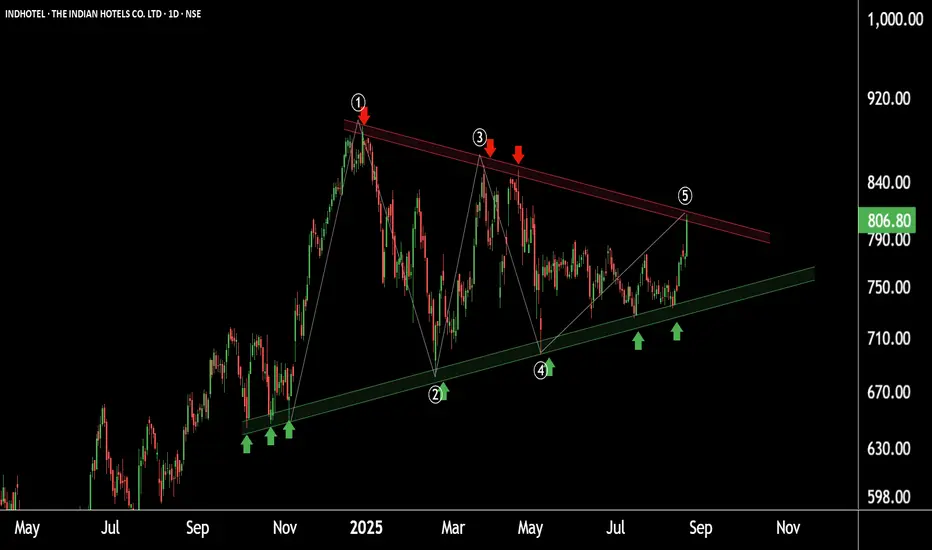
Indian Hotels: Pattern Discovery Signals Potential RallyIndian Hotels is currently forming a Symmetrical Triangle Pattern with:
Support: near ₹730
Resistance Zone: ₹800–810
As the wave structure is now complete, a breakout from this pattern is highly possible.
📈 If the breakout occurs, we may witness new highs in the stock.
THANK YOU !!
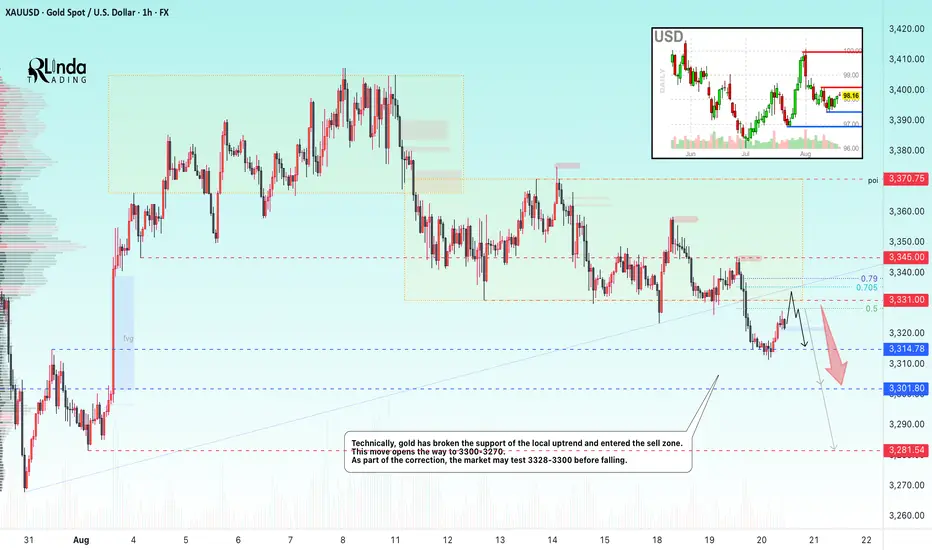
GOLD → Correction and retest of a previously broken level...FX:XAUUSD breaks through the support of the local consolidation “symmetrical triangle” and falls to a minimum of 3311...
Gold remained at a three-week low of around $3,300 in Asian trading on Wednesday as markets awaited the Fed minutes and Powell's speech in Jackson Hole. The dollar is strengthening on expectations that the Fed chair will reject the idea of aggressive rate cuts despite weak labor market and inflation data. The probability of a rate cut in September is estimated at 85%. Strong housing market data and news about negotiations on Ukraine provided additional support to the dollar. Powell's comments on Friday remain the key factor for gold, while current movements are mainly technical in nature.
Resistance levels: 3328, 3331, 3345
Support levels: 3314, 3300, 3328
Technically, a correction is forming after a bearish rally. As part of the correction, the price may test the zone of interest, which is represented by local resistance levels. Distribution could bring the price to 3300-3270.
Best regards, R. Linda!
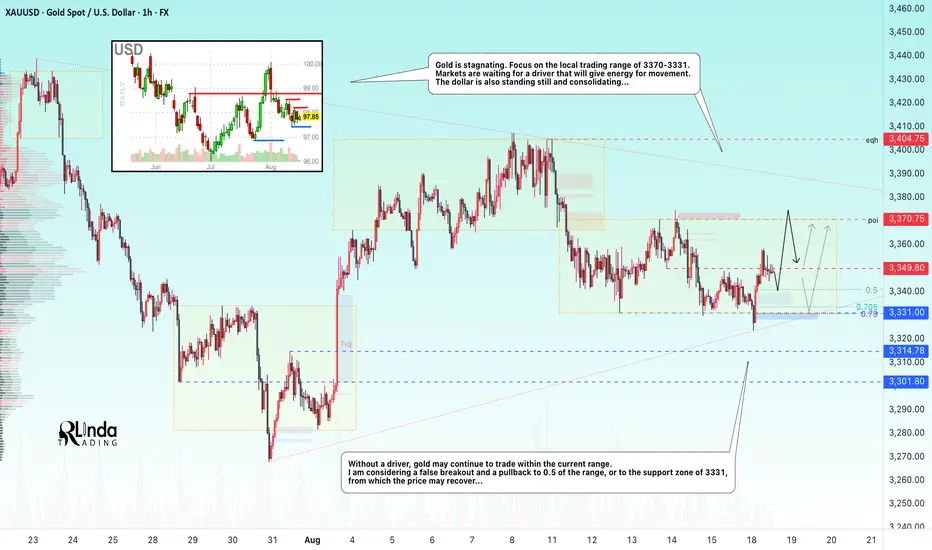
GOLD → The market is waiting for a kick (driver). ConsolidationFX:XAUUSD is in a stalemate. A “casino” pattern is forming in the form of a symmetrical triangle. The odds are 50/50, and everything depends on the fundamental background and the emergence of a driver.
Gold is stuck in a symmetrical triangle - consolidation.
Gold is trading around $3330 on Tuesday, remaining in a range with a downward bias amid caution among traders ahead of the Fed minutes.
Technically, it is possible to trade the breakout from consolidation with the price consolidating above a certain level, i.e., post-factum.
Optimism after the meeting between Trump and Zelensky, who promised to end the conflict, is reducing demand for safe assets, but expectations of a Fed rate cut this year are supporting the metal. An additional factor is the confirmation of the US rating by S&P. Powell's speech on Friday will be a key driver, while the dollar has partially recovered after its recent decline.
Resistance levels: 3349.8, 3370.7
Support levels: 3331, 3315, 3301
Volatility has been very low over the past few days, with the market waiting for someone to kick-start movement. Fundamental factors are contradictory, and technically, gold looks uncertainly weak. Based on this, I expect that a retest of the nearest resistance could end with a downward breakdown from consolidation.
Sincerely, R. Linda!

ICICI Bank on the move! A strong buy opportunity spotted.There are two charts of ICICI Bank—one on the 1-hour timeframe and the other on the 4-hour timeframe.
On the 4-hour chart, ICICI Bank is trading within a well-defined parallel channel, with strong support in the 1400–1410 zone.
“On the 1-hour chart, ICICI Bank is forming a Symmetrical Triangle pattern with support near 1424. The weekly pivot level at 1423 may also act as strong support, while the monthly pivot at 1450 is acting as resistance. The pattern breakout indicates a potential target of 1465.
If this support level holds, the stock may witness higher price levels.
Thank You !!

GOLD → Attempt to break through 3350 for a retest of 3370FX:XAUUSD is stagnating in a range, awaiting a driver. The price is consolidating, with boundaries narrowing and forming a symmetrical triangle...
Gold is trying to consolidate above $3,350 after falling to an 11-day low of $3,325 amid geopolitical uncertainty. Markets are awaiting Trump's talks with Zelensky, which will be joined by European leaders, hoping for a quick peace agreement on Ukraine. However, general optimism is limiting demand for “safe assets.” Expectations of a dovish Fed policy and the possible lifting of sanctions against Russia are adding to the positive sentiment. At the same time, gold risks a correction if the dollar strengthens amid profit-taking ahead of the Fed minutes and Jerome Powell's speech in Jackson Hole.
Technically, if gold can break through the 3350 level, the market may test the 3370 resistance in the short term, but then return to support due to uncertainty.
Resistance levels: 3350, 3370, 3400
Support levels: 3331, 3315, 3301
At the moment, since the price is in a range, it is worth considering an intrarange trading strategy: false breakouts or rebounds from strong levels. I think that until a strong driver appears, gold will remain within the specified range.
Best regards, R. Linda!
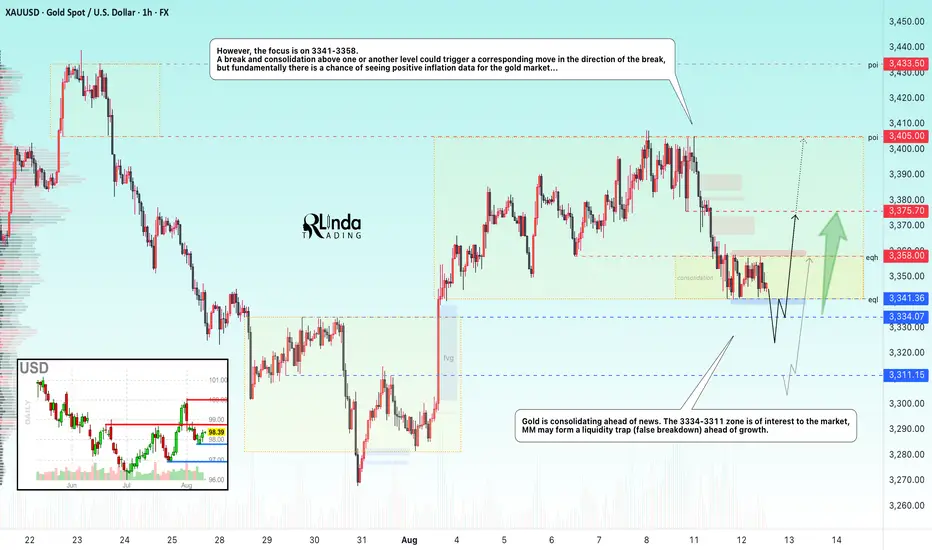
GOLD → Consolidation ahead of CPI data...FX:XAUUSD is consolidating ahead of news. Inflation is on the horizon, and further developments for the dollar and gold will depend on the data. Globally, gold is in a bullish trend, but locally we are seeing a correction...
Gold is rebounding slightly from $3,341 ahead of US CPI data for July and against the backdrop of the extension of the US-China trade truce until November. Investors are assessing the prospects for a Fed rate cut, expecting inflation to remain within 2.8% (core inflation is 3%). Weaker-than-expected data could cause the dollar to fall and support gold, while stronger data could resume the downward trend.
Technically, on D1-H4, gold is consolidating in a symmetrical triangle pattern and the price is in the support zone. There is a possibility that Trump may not make a mistake with inflation data, as he did with employment data...
Support levels: 3341, 3334, 3311
Resistance levels: 3358, 3375, 3405
The 3335-3310 zone attracts MM with an open FVG, which the market may partially close, forming a liquidity trap before continuing growth. However, it is also worth watching the boundaries of the current local consolidation, as a breakout of one or the other boundary could trigger a strong impulse.
Best regards, R. Linda!
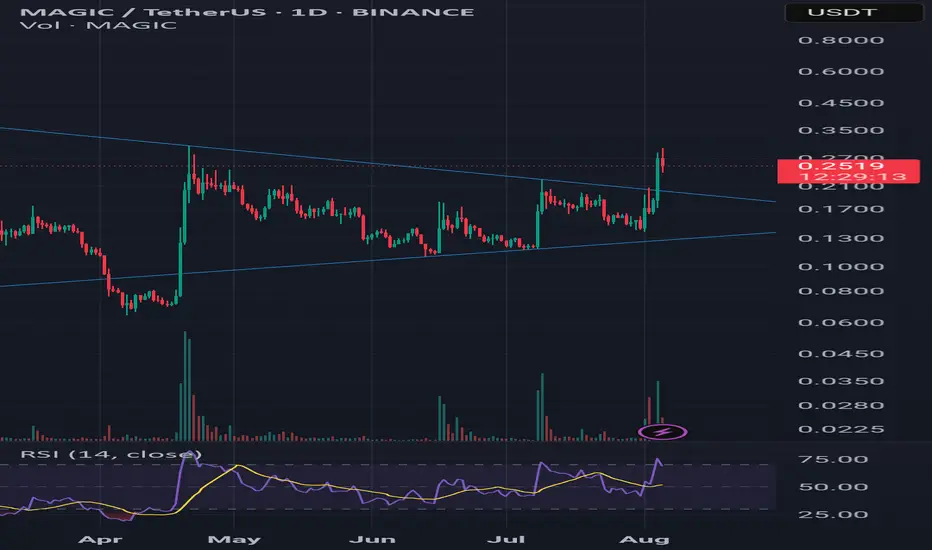
MAGIC / USDT – Symmetrical Triangle Breakout | Pullback OpportunMAGIC has recently broken out of a symmetrical triangle pattern that had been forming for several months. The breakout occurred with strong bullish volume and was accompanied by an RSI breakout above its MA, suggesting solid momentum behind the move.
📏 Technical Notes:
A descending dynamic resistance has been finally broken.
The price has clearly exited the symmetrical triangle, which often leads to explosive moves.
According to the height of the triangle’s base (~0.22), a technical target of around 0.45–0.47 can be projected.
📉 Possible Pullback:
A retest of the breakout zone around 0.20–0.21 is likely before continuation. This area also aligns with the upper triangle boundary, now turned into support.
---
🎯 Bullish Targets (Based on Triangle Breakout):
TP1: 0.30
TP2: 0.42
TP3: 0.47 (Full triangle target)
---
🛑 Stop Loss Suggestion:
Below 0.19, if the breakout fails and the price falls back into the triangle.
---
📊 Indicators:
RSI above 70 with bullish crossover.
Volume spike during breakout confirms institutional or whale interest.
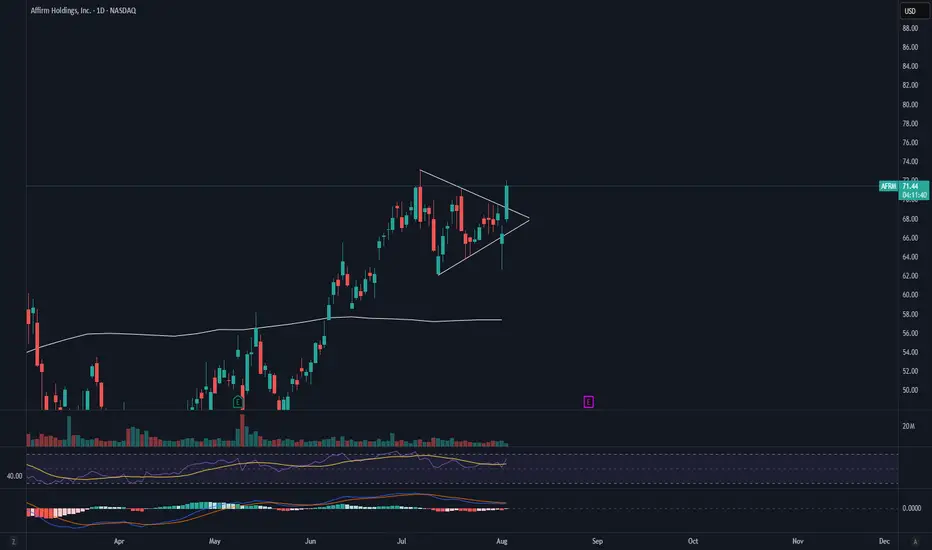
AFRM Pre Earnings Triangle BreakAFRM has broken the symmetrical triangle to the upside. If this holds we could see a strong rally into earnings. I would want to see strong volume added to this equation for the move up to be confirmed.
My STOP on this position would be a daily candle close back under the trendline with confirming volume. A retest of the triangle would be my spot to add to the position.
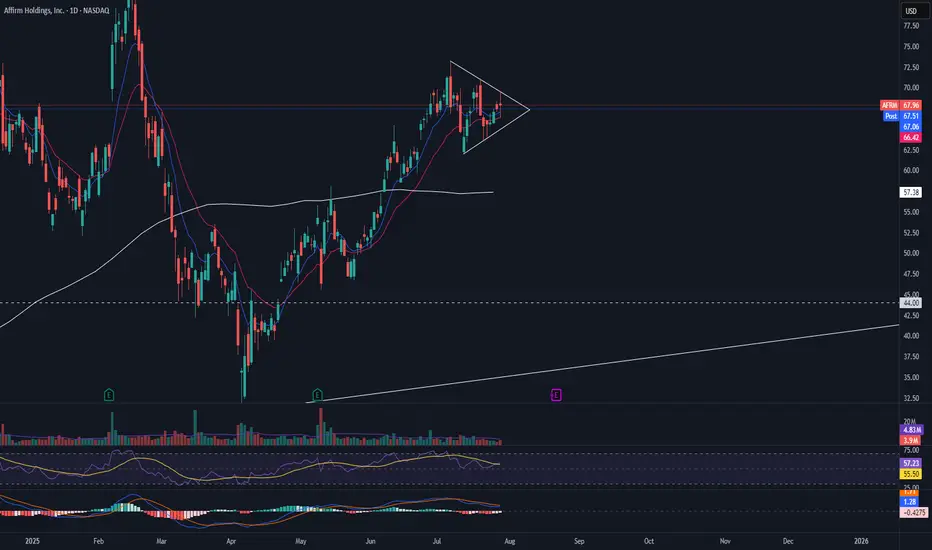
AFRM pre earnings triangleAFRM is currently in a symmetrical triangle with RSI and MACD beginning to show the pattern may come to an end. I would want to see this triangle break with volume before entering a long position.
Bitcoin Correction Maturing – Long Setup Brewing!Bitcoin ( BINANCE:BTCUSDT ) has fallen by more than -4% over the past day.
Let's take a look at the reasons for the decline.
One of the key reasons behind Bitcoin’s decline in the past 24 hours ( July 25 ) could be the reduced likelihood of Jerome Powell being replaced as Chair of the Federal Reserve.
In recent days, market participants were speculating that Donald Trump might replace Powell — a scenario that was considered bullish for risk assets like Bitcoin. However, recent reports of a meeting between Trump and Powell, and signs that Powell might not be dismissed, have weakened this fundamental narrative.
This meeting may signal a truce or reduced tension between Trump’s team and Powell , which could imply a continuation of current Fed policies. That’s bad news for Bitcoin, as it removes a potential psychological tailwind from the market and dampens speculative sentiment.
As a result:
Over $500 million in liquidations(Long Positions) occurred
Weak inflows into Bitcoin ETFs
A stronger U.S. Dollar Index ( TVC:DXY )
And declining Gold( OANDA:XAUUSD ) prices over the past two days
all added additional selling pressure on BTC. Now let's take a look at Bitcoin's conditions on the 4-hour time frame .
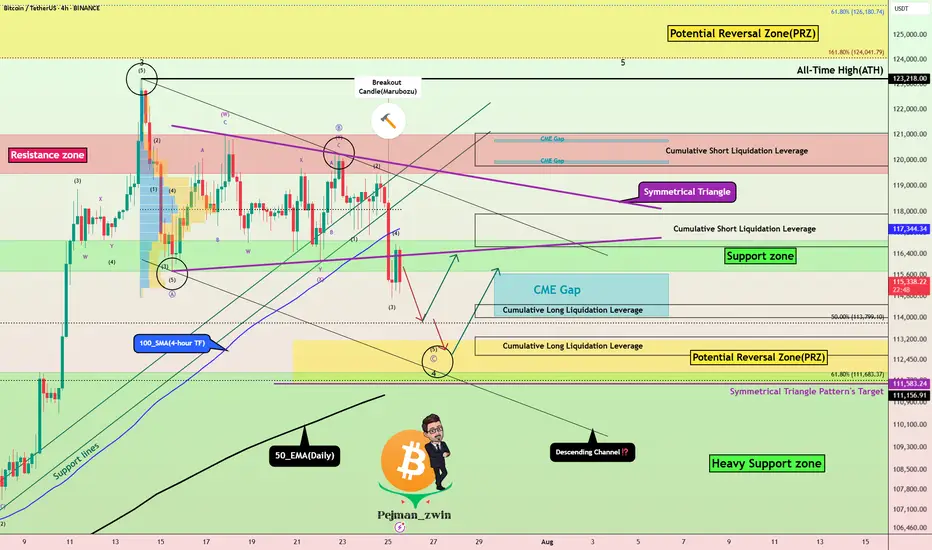
Bitcoin currently appears to have broken the Support zone($116,900-$115,730) , Support lines , 100_SMA(4-hour TF) , and the lower line of the Symmetrical Triangle Pattern with a bearish Marubozu candle .
Note : In general, trading was difficult when Bitcoin was inside a symmetrical triangle (about 10 days).
It also seems that the pullback to these zones has ended and Bitcoin is waiting for the next decline .
In terms of Elliott Wave theory , Bitcoin appears to be completing microwave 5 of microwave C of major wave 4 . There is a possibility that main wave 4 will create a descending channel and complete at the bottom of the descending channel (at Potential Reversal Zone(PRZ) ).
I expect Bitcoin to start rising again after completing the CME Gap($115,060-$114,947) from Cumulative Long Liquidation Leverage($114,480-$114,000) or Cumulative Long Liquidation Leverage($113,284-$112,603) near the PRZ and Heavy Support zone($111,980-$105,820) .
Cumulative Short Liquidation Leverage: $117,904-$116,665
Cumulative Short Liquidation Leverage: $121,046-$119,761
Do you think Bitcoin has entered a major correction, or does it still have a chance to create a new ATH?
Please respect each other's ideas and express them politely if you agree or disagree.
Bitcoin Analyze (BTCUSDT), 4-hour time frame.
Be sure to follow the updated ideas.
Do not forget to put a Stop loss for your positions (For every position you want to open).
Please follow your strategy and updates; this is just my Idea, and I will gladly see your ideas in this post.
Please do not forget the ✅' like '✅ button 🙏😊 & Share it with your friends; thanks, and Trade safe.