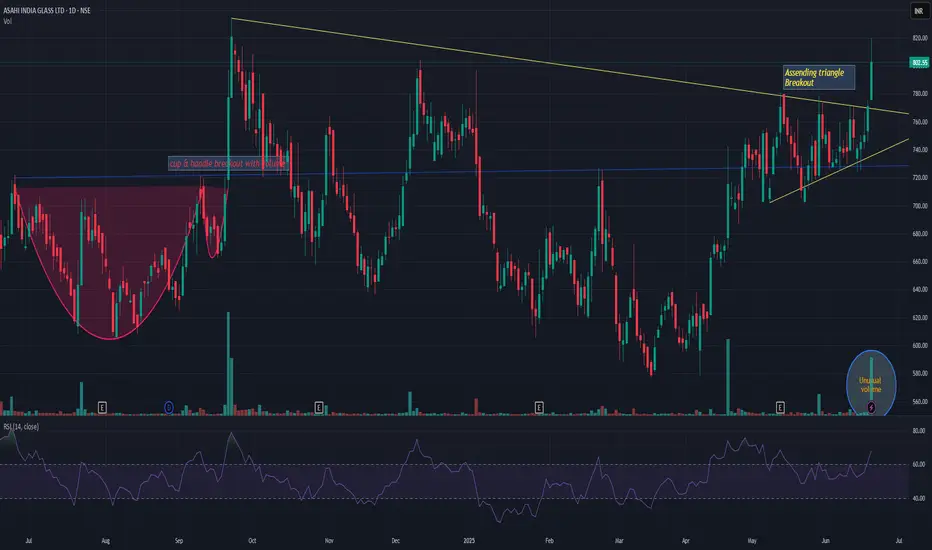
ASAHIINDIAASAHIINDIA has given symmetrical triangle breakout with unusual volume. Already took a momentum. Now as long as it is above upper channel line, i believe the momentum will continue till 980-1000 levels. Keep it on radar.
Symmetrical Triangle
At monthly supportSymmetrical triangle at a monthly support. Breakout is coming soon, could be either way but I think is most likely to go to the upside following the previous two continuation patterns. Price is just over the lower vertex of the triangle, so we have a tight SL, it triggers if a weekly candles breaks down the triangle. I have calls that expire 3 months from now strike 200. Buying the stock is much safer. Good luck.

SYRUP consolidates for rallySYRUP - is testing ATH while the crypto market is in correction. We can conclude that this coin is stronger than the whole market and can continue its rally after accumulating the right potential.
Focus on the mirror support level 0.4600 - the round number gives strength to this level. After a false breakdown, the coin is consolidating in the buying zone. A break of the downside resistance will trigger a rally
Scenario: If the consolidation above 0.4600 continues and the coin breaks the downside resistance, a breakout and consolidation above 0.49450 will attract new buyers, which will only strengthen the rally.

GOLD → Geopolitical risks are driving gold prices up. To ATH?FX:XAUUSD is updating its interim highs as it retests resistance at 3435 amid escalating tensions in the Middle East. Economic risks are on the rise...
Gold rose 1.5% on Friday in Asian trading as investors sought refuge from escalating tensions between Israel and Iran. The price approached 7-week highs and could reach $3,500 if the conflict intensifies. The US and Israel have warned of serious consequences, while Iran has promised to respond. Geopolitics has overshadowed economic news, and markets are pricing in the possibility of a Fed rate cut in September.
Technically, the price is emerging from a local consolidation and testing a fairly important resistance level, forming a false breakout and correction. But this does not mean that the price will fall...
Resistance levels: 3425, 3435, 3461
Support levels: 3408, 3400, 3377
If gold consolidates above 3425 and continues to storm the resistance, growth may continue, and at the moment, there is a fairly high probability of a retest of the ATH. However, the ideal scenario would be a retest of the zone of interest 3408 - 3400 and the capture of liquidity before continuing growth.
Best regards, R. Linda!

GOLD → Strengthening and return to range. Focus on 3340FX:XAUUSD is forming a fairly strong support zone (a cascade within an upward line). The price is returning to the range, with bulls storming 3330-3340.
Markets are awaiting US inflation data (CPI), which may affect expectations for a Fed rate cut in September (chances are about 52%). Optimism following progress in US-China trade talks is supporting sentiment, but uncertainty remains due to a court ruling allowing Trump to maintain tariffs. This is holding back the dollar and helping gold. CPI forecast: 0.2% growth, core inflation 0.3%. Lower inflation, on the other hand, will support expectations of lower rates and strengthen demand for gold as a safe-haven asset.
Technically, gold is stuck between the boundaries of a symmetrical triangle. Overall, this situation is reflected in all markets. Consolidation is forming and the price could break out in either direction...
Support levels: 3301, 3330, 3340
Resistance levels: 3349, 3361, 3375
Focus on the boundaries of the previous range - 3330 - 3340. If the bulls, after the assault, manage to hold their ground above this zone, the market may take the initiative due to support and continue its growth towards areas of interest.
Best regards, R. Linda!

ETH/BTC : Ready to Lead the Altcoin Season?Hey Traders!
If you’re finding value in this analysis, smash that 👍 and hit Follow for high-accuracy trade setups that actually deliver!
Ethereum just broke out of a multi-week symmetrical triangle against Bitcoin — a classic continuation pattern! After consolidating for over a month, this breakout could signal a major shift in market dynamics.
Pattern: Symmetrical Triangle
Measured Move Target: +38.7% from the breakout
Timeframe: 12H
Current Ratio: 0.02517 BTC
🔍 Why ETH/BTC Matters for Altcoins:
When ETH/BTC rises, it often marks the beginning of an altcoin rally. Here's why:
✅ ETH leads altcoins — It’s the largest alt by market cap, and capital often rotates from BTC → ETH → mid/small caps.
✅ Rising ETH/BTC = Bitcoin dominance weakening, giving altcoins room to breathe.
✅ Confidence returns to the broader alt market when ETH outperforms BTC.
If this breakout sustains, we may be entering a strong altcoin season. Keep an eye on ETH strength and look for high-potential setups across the altcoin board!
What are your top altcoin picks for this potential rally? Drop them below 👇

RAIN INDUSTRIES at Good Support.This is 4 hour chart of RAIN INDUSTRIES.
Stock is forming a Symmetrical Triangle Pattern.pattern lower boundary expected to act as a strong support level 142-145.
IF this level is sustain , then we may see higher prices in Rain industries.
Thank You !!

NESCO at Resistance zone !!This is the Daily Chart of NESCO.
Nesco having good law of polarity at 1050 range.
NESCO is forming a pattern near its L.O.P, characterized by the development of an Ascending Broadening Wedge. The resistance zone for this formation is positioned between 1050 and 1060 levels
if this level is sustain, then we may see lower prices in NESCO.
THANK YOU !!

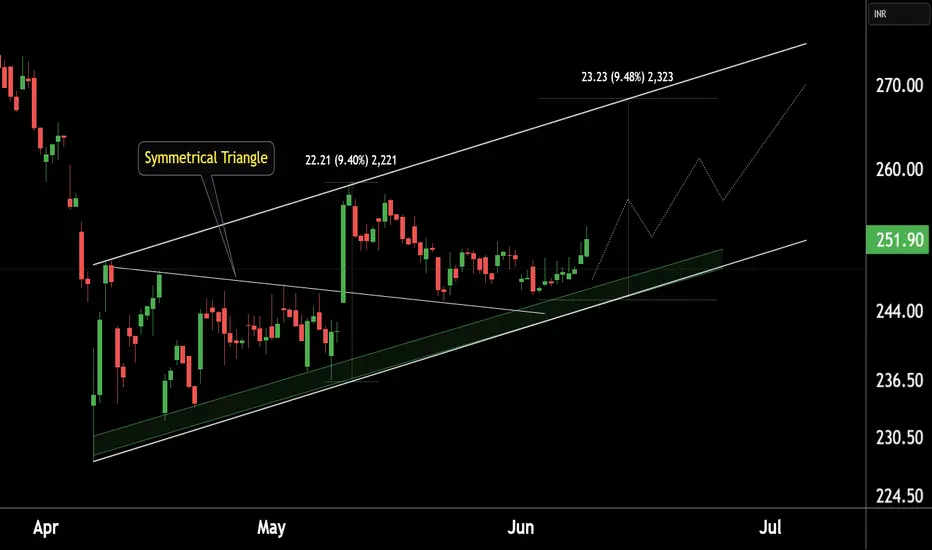
WIPRO at Best Support !!This is the 4 hour chart of Wipro ltd.
WIPRO has a strong support zone in the 245–248 range.
WIPRO is forming a symmetrical triangle pattern, with a potential target of 268, which also aligns with the channel's resistance zone at 268-270."
If this level is sustain , we may see higher prices in Wipro !!
Thank You
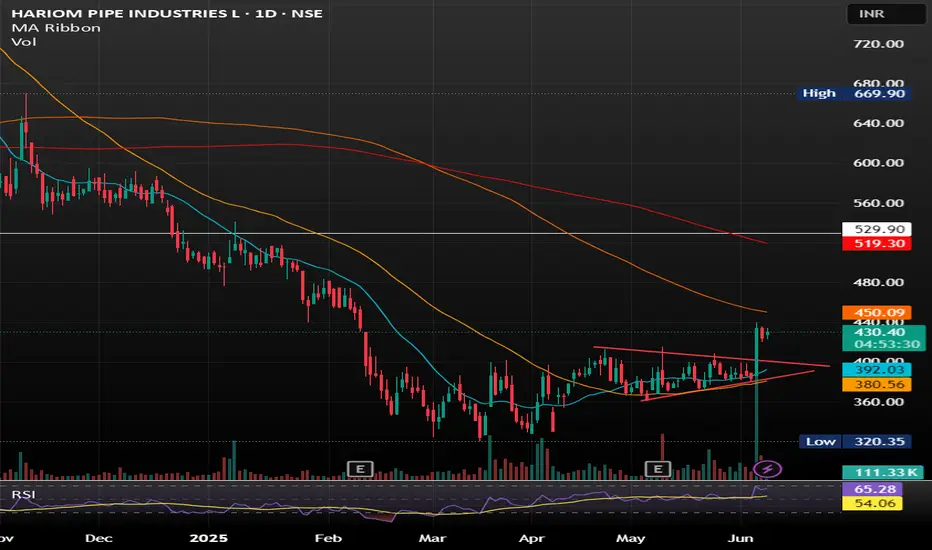
Hariom Pipes Industries Ltd Hariom Pipes Industries Ltd is a leading manufacturer of high-quality steel products, including HR Pipes, GI Pipes, GP Pipes, MS Pipes, HR Coils, and Billets. The company was established in 2007 and has grown into a major player in the iron and steel industry in India.
SYMETRIC TRIANGLE BREAKOUT WITH GOOD VOLUME SHOWING GOOD UPWARD MOMENTUM .
BUY IN ANY PULLBACK SUGGESTS.
SHREE DIGVIJAY CEMENET AT LONG TERM SUPPORT ZONEThis is the Weekly chart of SHREDIGCEM.
SHREDIGCEM is trading near it's long term support zone at 60-70 range.
stock has been moving within a long-term parallel channel, with a well-established support zone in the range of ₹65–₹70.
Currently, the stock is forming a broadening pattern near its support zone, with the pattern support range between ₹70–₹75.
If this level is sustain then,we may see higher prices in SHREDIGCEM.

DONEAR AT SUPPORT ZONE.This is the Weekly chart of DONEAR.
Donear is currently trading near its support zone in the ₹95–₹100 range.
The stock is trading within a larger pattern structure (broadening pattern) and is currently moving inside a smaller formation—an ascending channel (in DAILY timeframe) support at 103-105 range.
if this level is sustain ,then we may see higher price on ascending channel resistance at 130-135 range and long term resistance of the broadening pattern .........
Thank you !!!!

BIOCON LIMITED KEY ZONE !!This is the Daily chart of BIOCON LIMITED.
Biocon is currently trading near its pattern resistance zone around the 340 range.
BIOCON has a strong support zone near the 300 range.
Thank You !!

GOLD → Correction to liquidity before growthFX:XAUUSD is in the realization phase after exiting the “symmetrical triangle” consolidation. The price is supported by the trend and a complex fundamental background.
Gold is retreating from its peak, remaining below risk support. The price of gold is falling moderately from $3,392, awaiting data on JOLTS job openings in the US.
Gold is supported by trade and geopolitical risks: Trump doubled tariffs on metals, increasing pressure on the dollar. The conflict with China has escalated due to allegations of violations of agreements.
Focus on US employment: Strong data could support the dollar and limit gold's gains, but the technical picture remains bullish.
Resistance levels: 3365, 3391, 3409
Support levels: 3345, 3323
Against the backdrop of a rising dollar, gold may test deeper liquidity zones, such as 3345 and 3330. However, if trading forms between 3365 and 3345, followed by a retest of resistance and consolidation above 3365, this could trigger an early rise to 3391-3409.
Best regards, R. Linda!

Hello Symmetrical triangleThe appearance of this symmetrical triangle marks the end of the decline in this cycle, in which the price is stabilizing in order to continue its upward movement. 109 is the next level.

GOLD → Correction after distribution. Bullish trendFX:XAUUSD is testing the liquidity zone at 3350 and forming a false breakout of resistance within the uptrend. A correction is possible before growth continues.
The fundamental background is quite controversial in the market. In the current situation, the focus is on relations between Russia and Ukraine, especially after the escalation that took place over the weekend. Everyone is watching the ongoing negotiations in Turkey. In addition, we should not forget about the situation with tariffs, which is still quite tense.
Gold has been rallying since the opening of the session and has reached the order block. A false breakout of resistance is forming, which could trigger a correction to the zone of interest. The dollar is hitting support, which could form a local correction before continuing its movement. This could also affect the price of gold, which remains bullish in the market.
Resistance levels: 3350, 3365, 3409
Support levels: 3303, 3264
The price has broken out of consolidation, with resistance tested and liquidity above 3350 realized. Relative to the current level, a correction is possible with the aim of retesting support before continuing to rise.
Best regards, R. Linda!

SIGN/USDT – Bullish Breakout Alert!🚀 SIGN Breakout Alert – 80% Potential Incoming?! 👀🔥
Hey Traders! If you're all about high-conviction plays and real alpha, smash that 👍 and tap Follow for more setups that actually deliver! 💹💯
SIGN has just broken out from a symmetrical triangle after consolidating tightly for weeks. The breakout is supported by strong volume and a solid bounce from the base of the structure.
Entry: $0.082 - $0.085 (post-breakout zone)
Targets:
• $0.095
• $0.112
• $0.134
• $0.159
Stop-loss: Below $0.076
Risk-Reward: Over 6:1 — Excellent setup for trend traders.
This move could mark the beginning of a strong upside wave. Keep it on your radar and manage your risk accordingly!
Let me know your thoughts or if you're riding this one too!

GOLD - BULLISH MOVEHello Traders !
The Gold price formed a symmetrical triangle pattern.
The resistance line is broken !
So, I expect a bullish move🚀
_______________
TARGET: 3414🎯

Inverse H&S + Triangle = Gold’s Perfect Setup for a BreakoutAs I expected in my previous idea , Gold ( OANDA:XAUUSD ) started to rise after a correction and made another attack on the Resistance zone($3,280-$3,245) .
Gold is currently moving near the Resistance zone($3,280-$3,245) and Yearly Resistance (2) .
If we look at the Gold chart from a Classic Technical Analysis perspective, two Classic Patterns are clearly visible.
1- Inverse Head and Shoulders pattern , which is a good sign for a Resistance zone($3,280-$3,245) breakout.
2- Symmetrical Triangle Pattern is also a sign of a continuation of the recent bullish trend
In terms of Elliott Wave theory , Gold seems to have completed the corrective waves , and we can expect the start of an impulsive wave . Breaking the Resistance zone($3,280-$3,245 ) can be a good sign for the start of an impulsive wave and a gold pump .
I expect Gold to trend higher in this week , and the first sign could be a break of the Resistance zone($3,280-$3,245) . The targets are clear on the chart.
Note: If Gold touches $3,179 , we should expect a drop.
Gold Analyze ( XAUUSD ), 1-hour time frame.
Be sure to follow the updated ideas.
Do not forget to put a Stop loss for your positions (For every position you want to open).
Please follow your strategy; this is just my idea, and I will gladly see your ideas in this post.
Please do not forget the ✅' like '✅ button 🙏😊 & Share it with your friends; thanks, and Trade safe.

GOLD → Short squeeze before a drop to 3150?FX:XAUUSD is consolidating. The market needs a driver, but due to the unstable fundamental background, traders have switched to a wait-and-see mode. Consolidation could turn into strong movement at any moment. But in which direction?
Gold under pressure: the market is waiting for signals from the Fed and negotiations. The dollar is putting pressure on the market amid expectations of trade negotiations with India, South Korea, and Japan, as well as statements from the Fed.Earlier, the metal was supported by the weak dollar after Moody's downgraded the US credit rating, but growing interest in risky assets and hopes for peace between Russia and Ukraine reduced demand for gold. Key factors — negotiations and comments from the Fed — will continue to influence the dynamics of the dollar and gold.
Technically, the price is in a downtrend and within consolidation. A breakout from consolidation could be accompanied by strong momentum, but I believe that there will be no countertrend movement and that a retest of resistance could end in a decline...
Resistance levels: 3265.5, channel resistance
Support levels: 3206, 3153
The most likely scenario within the bearish trend is a short squeeze and a downward breakdown from the triangle (the fundamental background and economic risks are slowly but surely declining, and gold may lose value). A false breakout of 3250-3265 could trigger a continuation of the trend towards 3150-3120.
Best regards, R. Linda!

BITCOIN → Consolidation in a triangle amid a BULLISH TRENDBINANCE:BTCUSDT is consolidating. A symmetrical triangle is forming against the backdrop of a bullish trend. Given the current technical nuances, we can bet that this consolidation is forming with the aim of continuing growth...
Fundamental nuances have gradually improved over the past few weeks, and the cryptocurrency market has revived slightly. Technically, I like the market structure on D1. After strong growth, the price is not going to fall, consolidation is forming. The market is bullish, after 2-3 weeks of consolidation, a bullish distribution is forming. The cycle has repeated itself twice. On D1, you can see how long tails are forming downward within the consolidation, indicating that whales are buying up all attempts to fall, keeping the market away from risk zones. Accordingly, at the moment, I would say that consolidation may continue for some time, and I do not rule out an attempt to retest the triangle support before growth, or entry into a deeper zone to retest the distant liquidity zones of 101400 and 100700 before continuing growth.
Resistance levels: 103.6, 104.4, 105.0
Support levels: 102.5, 101.4, 100.6
A decline can be considered if the price breaks the triangle support and sticks to 101400, forming a pre-breakdown consolidation (if there is no upward rebound).
However, at the moment, intraday trading can be considered, i.e., from the consolidation boundaries. A signal to exit the consolidation upwards and continue growth will be consolidation between 103.5 and 105.0 and compression towards the upper boundary.
Best regards, R. Linda!

GUN/USDT – Breakout Retest in Play!🚀 GUN Breakout Alert – 100% Potential Incoming?! 👀🔥
Hey Traders! If you're all about high-conviction plays and real alpha, smash that 👍 and tap Follow for more setups that actually deliver! 💹💯
GUN just completed a clean breakout from a long-term symmetrical triangle and is now retesting the breakout zone — a classic bullish continuation signal! 🔁
✅ Strong breakout followed by healthy pullback
✅ Retesting previous resistance turned support
✅ Perfect technical structure for a potential explosive move ahead 💥
📍 Entry: CMP and add more around $0.051
🎯 Target: $0.107
🛑 SL: Close below $0.047
📊 Leverage: Use low leverage (Max 5x) for safety
Momentum looks primed for another 100%+ rally if support holds.
Let’s ride this wave! 🌊
What do you think about this? Share your views in the comments section.

MAGIC Breaking Out – Next 100% Move on the Horizon?🚀 MAGIC Breakout Alert – 100% Potential Incoming?! 👀🔥
Hey Traders! If you're all about high-conviction plays and real alpha, smash that 👍 and tap Follow for more setups that actually deliver! 💹💯
MAGIC has finally broken out from a long-standing symmetrical triangle on the 4H chart — a classic bullish reversal pattern. After consolidating tightly, it's now flashing signs of a strong upward impulse! ⚡
📌 Entry: CMP ($0.200) and add more on dips up to $0.195
🎯 Targets: $0.25 / $0.29 / $0.33 / $0.39
🛑 Stoploss: Close below $0.176
⚙️ Leverage: 5x (Max)
✨ Previous breakout delivered over 100% gains — this one could be next!
Chart structure + volume looks perfect. If BTC stays calm, we might witness another explosive move in MAGIC.
💬 What are your thoughts on this setup? Drop your opinions below and don't forget to like & follow for more high-conviction trade setups! 💥
