ETH / USDT 1HChart - Targets And StopLossHello everyone, let's take a look at the 1H ETH to USDT chart as you can see the price is moving below the local downtrend line.
Let's start by setting goals for the near future that we can consider:
T1 - $ 1700
T2 - $ 1706
T3 - $ 1,712
T4 - $ 1722
and
T5 - $ 1732
Now let's move on to the stop loss in case of further market declines:
SL1 - $ 1,696
SL2 - $ 1,689
SL3 - $ 1,683
SL4 - $ 1,677
SL5 - $ 1,669
and
SL6 - $ 1,660
Looking at the CHOP indicator, we can see that in the 1H range the energy starts to rise, while the MACD indicator shows a local upward trend.
Targets

Short-term ADA / USDT analysis on the 1H intervalHello everyone, let's take a look at the 1H ADA to USDT chart as you can see the price is moving in the local downtrend channel.
Let's start by setting goals for the near future that we can consider:
T1 - $ 0.5378
T2 - $ 0.5421
T3 - $ 0.5456
T4 - $ 0.5490
and
T5 - $ 0.5540
Now let's move on to the stop loss in case of further market declines:
SL1 - $ 0.5319
SL2 - $ 0.5240
SL3 - $ 0.5178
SL4 - $ 0.5117
and
SL5 - $ 0.5027
Looking at the CHOP indicator, we can see that the energy has been consumed in the 1H range, while the MACD indicator shows that the blue line is approaching the intersection of the red line from the bottom, which would confirm the local uptrend.

BTC / USDT 15M SHORTHello everyone, let's take a look at the BTC to USDT chart over the 15 minute timeframe. As you can see, the price is moving below the local uptrend line.
Let's start with the designation of the support line and as you can see the first support in the near future is $ 24,325, if the support breaks down, the next support is $ 24,203 and $ 24,091.
Now let's move from the resistance line as you can see the first resistance is $ 24,412, if you can break it the next resistance will be $ 24,464, $ 24,511 and $ 24,554.
Looking at the CHOP indicator, we can see that we have a lot of energy in the 15-minute interval, while the MACD indicator shows a local downward trend.

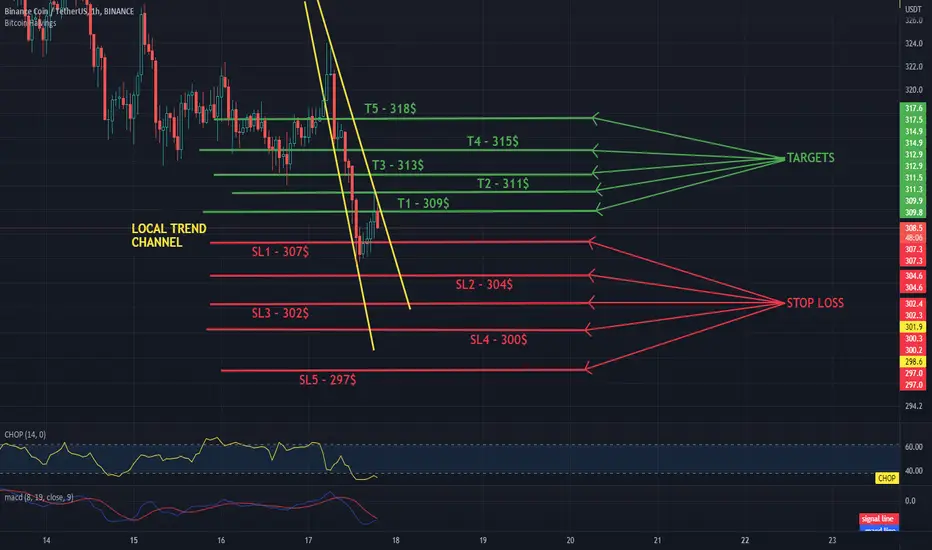
Daily short review of BNB interval 1HHello everyone, let's take a look at the 1H BNB to USDT chart as you can see the price is moving in the local downtrend channel.
Let's start by setting goals for the near future that we can consider:
T1 - $ 309
T2 - $ 311
T3 - $ 313
T4 - $ 315
and
T5 - $ 318
Now let's move on to the stop loss in case of further market declines:
SL1 - $ 307
SL2 - $ 304
SL3 - $ 302
SL4 - $ 300
and
SL5 - $ 297
Looking at the CHOP indicator, we can see that energy has been consumed in the 1H range, while the MACD indicator shows that the blue line is approaching the intersection of the red line from the bottom, which would confirm the local upward trend.
ETHUSDT Short Term Analysis - Targets and StoplossHello everyone, let's take a look at the 1H ETH to USDT chart as you can see the price is moving in the local downtrend channel.
Let's start by setting goals for the near future that we can consider:
T1 - $ 1,858
T2 - $ 1,870
T3 - $ 1,882
T4 - $ 1,898
and
T5 - $ 1,921
Now let's move on to the stop loss in case of further market declines:
SL1 - $ 1,836
SL2 - $ 1,816
SL3 - $ 1798
SL4 - $ 1783
and
SL5 - $ 1,759
Looking at the CHOP indicator, we can see that in the 1H range, energy has been used, while the MACD indicator shows that the blue line is approaching the intersection of the red line from the bottom, which would confirm the local upward trend.

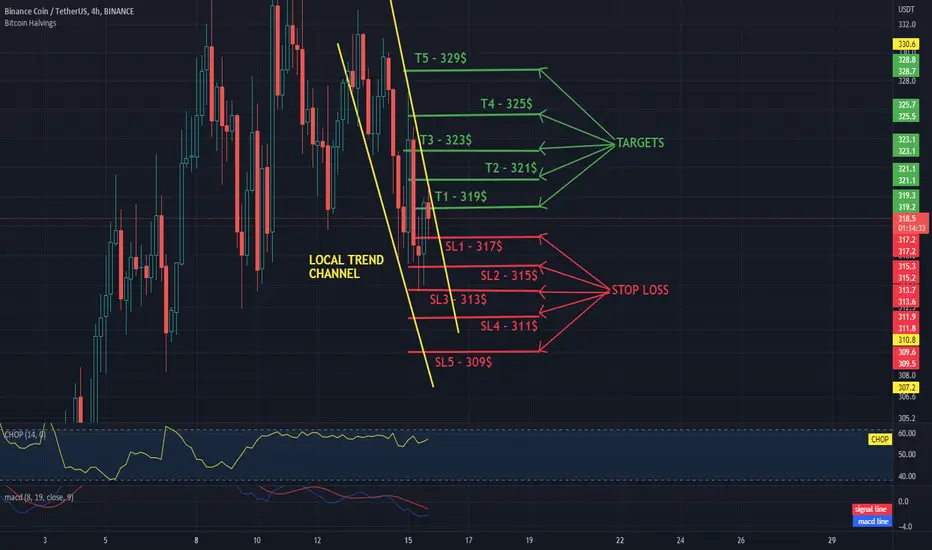
Daily review of BNB interval 4HHello everyone, let's take a look at the 4H BNB to USDT chart as you can see the price is moving in the local downtrend channel.
Let's start by setting goals for the near future that we can consider:
T1 - $ 319
T2 - $ 321
T3 - $ 323
T4 - $ 325
and
T5 - $ 329
Now let's move on to the stop loss in case of further market declines:
SL1 - $ 317
SL2 - $ 315
SL3 - $ 313
SL4 - $ 311
and
SL5 - $ 309
Looking at the CHOP indicator, we can see that there is a lot of energy in the 4H range and the MACD indicator confirms the local downward trend.
Daily review of ETH interval 4HHello everyone, let's take a look at the 4H ETH to USDT chart as you can see the price is moving below the local downtrend line.
Let's start by setting goals for the near future that we can consider:
T1 - $ 1,897
T2 - $ 1,913
T3 - $ 1,926
T4 - $ 1,939
and
T5 - $ 1,957
Now let's move on to the stop loss in case of further market declines:
SL1 - $ 1,880
SL2 - $ 1,864
SL3 - $ 1,847
SL4 - $ 1,823
and
SL5 - $ 1793
Looking at the CHOP indicator, we can see that in the 4H range we have a lot of energy and the MACD indicator shows a local downward trend.

#Btcst#Btcst
Buy zone : 24~23
Targes : 26 / 28 /30 /32 / 34 /38 / 40
Don't risk more than 3% of capital.

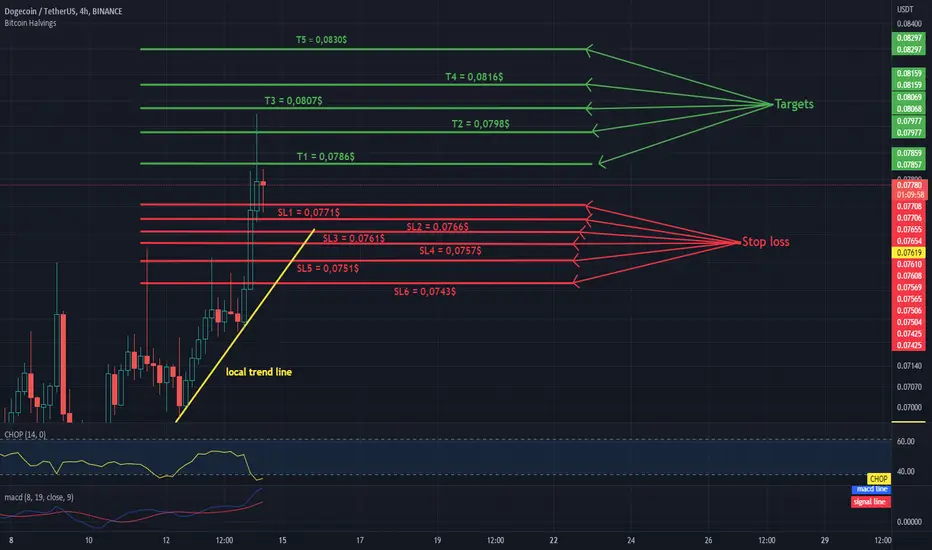
DOGEUSDT - review of the chart on the 4H intervalHello everyone, let's take a look at the 4H DOGE to USDT chart as you can see the price is moving above the local uptrend line.
Let's start by setting goals for the near future that we can consider:
T1 = $ 0.0786
T2 = $ 0.0798
T3 = $ 0.0807
T4 = $ 0.0816
and
T5 = $ 0.0830
Now let's move on to the stop loss in case of further market declines:
SL1 = $ 0.0771
SL2 = $ 0.0766
SL3 = $ 0.0761
SL4 = $ 0.0757
SL5 = $ 0.0751
and
SL6 = $ 0.0743
Looking at the CHOP indicator, we can see that in the 4H range the energy was used and the MACD indicator confirms the local upward trend.
CRO / USDT Short on 1H IntervalHello everyone, let's take a look at the 1H CRO to USDT chart as you can see the price is moving below the local uptrend channel.
Let's start by setting goals for the near future that we can consider:
T1 = $ 0.1548
T2 = $ 0.1555
T3 = $ 0.1560
T4 = $ 0.1566
and
T5 = $ 0.1573
Now let's move on to the stop loss in case of further market declines:
SL1 = $ 0.1541
SL2 = $ 0.1533
SL3 = $ 0.1525
SL4 = $ 0.1521
and
SL5 = $ 0.1516
Looking at the CHOP indicator, we can see that in the 1H range we have very little energy and the MACD indicator shows a local downward trend.

BNB / BTC on 1H Interval - Targets and StoplossHello everyone, let's take a look at the 1H BNB to BTC chart as you can see the price is moving below the local downtrend line.
Let's start by setting goals for the near future that we can consider:
T1 - 0.013315
T2 - 0.013371
T3 - 0.013422
T4 - 0.013469
T5 - 0.013538
and
T6 - 0.013627
Now let's move on to the stop loss in case of further market declines:
SL1 - 0.013237
SL2 - 0.013177
SL3 - 0.013135
SL4 - 0.013087
and
SL5 - 0.013021
Looking at the CHOP indicator, we can see that in the 1H range we have a lot of energy and the MACD indicator shows a local upward trend.

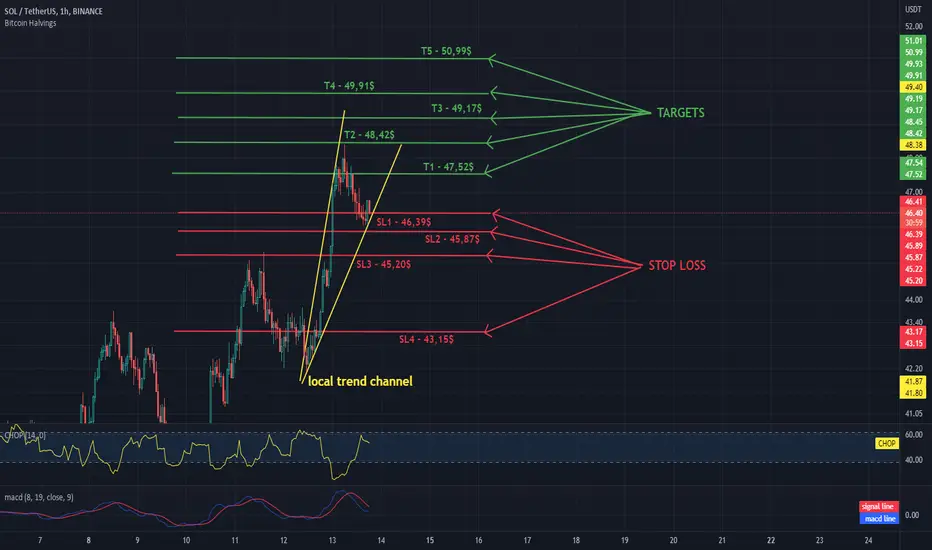
SOL - USDT 1HChart, targets and stoplossHello everyone, let's take a look at the 1H SOL to USDT chart as you can see the price is moving in the channel denoted by the yellow lines.
Let's start by setting goals for the near future that we can consider:
T1 - $ 47.52
T2 - $ 48.42
T3 - $ 49.17
T4 - $ 49.91
and
T5 - $ 50.99
Now let's move on to the stop loss in case of further market declines:
SL1 - $ 46.39
SL2 - $ 45.87
SL3 - $ 45.20
and
SL4 - $ 43.15
Looking at the CHOP indicator, we can see that in the 1H range we still have a lot of energy for further moves, and the MACD indicator shows a local downward trend.
ETH on 1H Interval - Targets and StoplossHello everyone, let's take a look at the 1H ETH vs. USDT chart as you can see that the price has dropped below the local uptrend line and is going up again after a slight correction.
Let's start by setting goals for the near future that we can consider:
T1 - $ 2002
T2 - $ 2027
T3 - $ 2,047
T4 - $ 2,067
and
T5 - $ 2,095
Now let's move on to the stop loss in case of further market declines:
SL1 - $ 1985
SL2 - $ 1,976
SL3 - $ 1,964
SL4 - $ 1,949
and
SL5 - $ 1,929
Looking at the CHOP indicator, we can see that in the 1H range we still have a lot of energy for further moves and the MACD indicator shows that the blue line is getting closer to the red cross from the bottom, which would confirm the local upward trend.

FTM / USDT 1H IntervalHello everyone, let's take a look at the 1H FTM to USDT chart as you can see the price has come up from the local downtrend channel.
Let's start by setting goals for the near future that we can consider:
T1 - $ 0.3997
T2 - $ 0.4092
T3 - $ 0.4169
T4 - $ 0.4248
and
T5 - $ 0.4361
Now let's move on to the stop loss in case of further market declines:
SL1 - $ 0.3947
SL2 - $ 0.3898
SL3 - $ 0.3860
SL4 - $ 0.3821
and
SL5 - $ 0.3766
Looking at the CHOP indicator, we can see that in the 1H interval, we have a lot of energy for the next move, and the MACD indicator indicates a shift to an upward trend.

SOL - USDT 1HChart, targets and stoplossHello everyone, let's take a look at the 1H SOL to USDT chart as you can see the price has come sideways from the uptrend channel.
Let's start by setting goals for the near future that we can consider:
T1 - $ 44.85
T2 - $ 45.73
T3 - $ 46.47
T4 - $ 47.2
and
T5 - $ 48.23
Now let's move on to the stop loss in case of further market declines:
SL1 - $ 43.56
SL2 - $ 43.02
SL3 - $ 42.48
SL4 - $ 41.68
and
SL5 - $ 40.72
Looking at the CHOP indicator, we can see that in the 1H range we have more and more energy and the MACD indicator shows a local downward trend.

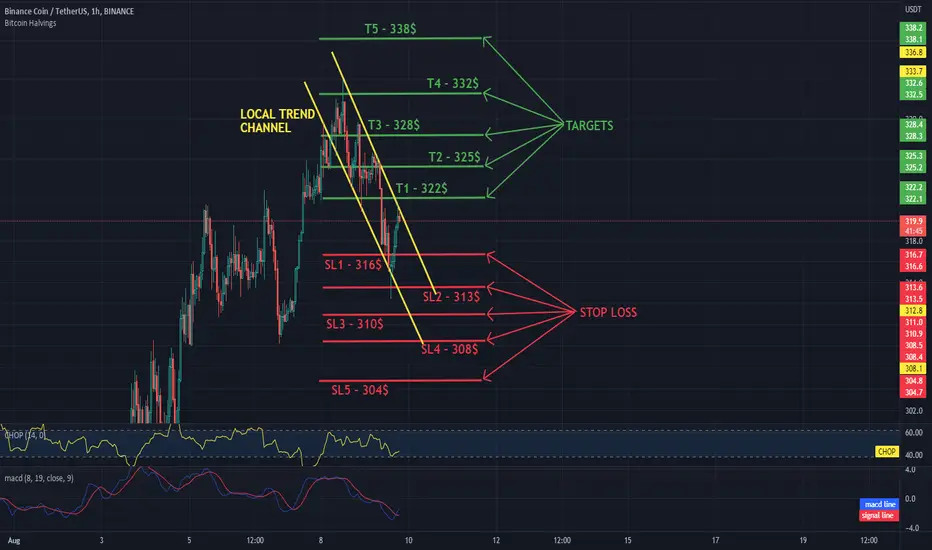
Daily BNB SHORT review 1HHello everyone, let's take a look at the 1H BNB to USDT chart as you can see the price is trying to come out of the local downtrend channel.
Let's start by setting goals for the near future that we can consider:
T1 - $ 322
T2 - $ 325
T3 - $ 328
T4 - $ 332
and
T5 - $ 338
Now let's move on to the stop loss in case of further market declines:
SL1 - $ 316
SL2 - $ 313
SL3 - $ 310
SL4 - $ 308
and
SL5 - $ 304
Looking at the CHOP indicator, we can see that in the 1H range the energy slowly starts to rise, while the MACD indicator shows a local upward trend.
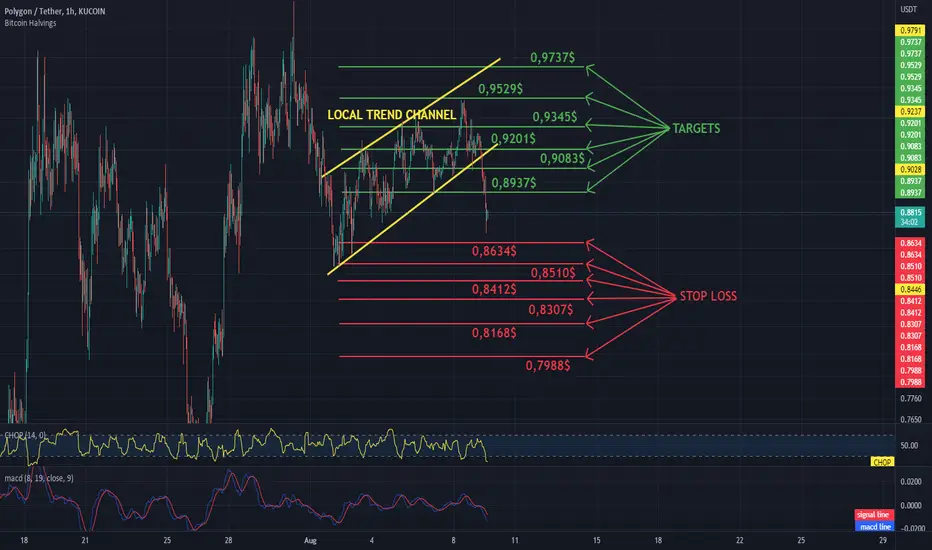
MATIC/USDT - Targets and StoplossHello everyone, let's take a look at the 1H MATIC to USDT chart as you can see the price has dropped below the local uptrend channel.
Let's start by setting goals for the near future that we can consider:
T1 = $ 0.8937
T2 = $ 0.9083
T3 = $ 0.9201
T4 = $ 0.9345
T5 = $ 0.9529
and
T6 = $ 0.9737
Now let's move on to the stop loss in case of further market declines:
SL1 = $ 0.8634
SL2 = $ 0.8510
SL3 = $ 0.8412
SL4 = $ 0.8307
SL5 = $ 0.8168
and
SL6 = $ 0.7988
Looking at the CHOP indicator, we can see that in the 1H band the energy has been used for the current price decline, and the MACD indicator confirms the local downward trend.
BTCEUR - Head & shoulder?Possible head & shoulder pattern on BTCEUR on the Daily.
Green line = neckline. Measured distance from head to necline is shown and copied to indicate the target to the downside.
Fib-levels (0.382 up to 0.786) are displayed on the chart for possible targets in case of a short.
First target (based on the H&S), around EU20.500 is in between the 0.500 and the 0.618 Fib.
On the 4H there's a bullish orderblock in that same area.
The 50DMA is also around this level.
Lower targets (possible wicks) are around the 0.786Fib (EU19.000 - EU19500) and the 0.886Fib (Eu18.000 - 18.500)

DOGE / USDT 1D IntervalHello everyone, let's take a look at the 1D DOGE to USDT chart as you can see the price is moving above the local uptrend line.
Let's start by setting goals for the near future that we can consider:
T1 = $ 0.06989
T2 = $ 0.07095
T3 = $ 0.07269
and
T4 = $ 0.07477
Now let's move on to the stop loss in case of further market declines:
SL1 = $ 0.06891
SL2 = $ 0.06819
SL3 = $ 0.06747
SL4 = $ 0.06633
SL5 = $ 0.06507
and
SL6 = $ 0.06117
Looking at the CHOP indicator, we can see that in the 1-day range we have a lot of energy and the MACD indicator shows a local upward trend.

Btc will break soon massive movment coming Be caution this triangle could break in eather directions targets are there in green
Entry after breaking the resistance 23350

EUR/JPY potential targetsEUR/JPY mark up for potential targets using Fib tools....will see how it plays out.

SHORT ETH / USDT - 30M INTERVALHello everyone, let's take a look at the 30M ETH to USDT chart as you can see the price is moving below the local downtrend line.
Let's start by setting goals for the near future that we can consider:
T1 - $ 1,650
T2 - $ 1,676
T3 - $ 1,696
T4 - $ 1716
and
T5 - $ 1,747
Now let's move on to the stop loss in case of further market declines:
SL1 - $ 1608
SL2 - $ 1,599
SL3 - $ 1,582
and
SL4 - $ 1568
Looking at the CHOP indicator, we can see that in the 30-minute interval most of the energy has been used, and the MACD indicator shows that we are in the local downtrend.

ETH - USDT, 15M interval SHORTHello everyone, let's take a look at the 15M ETH to USDT chart as you can see the price is moving above the local uptrend line.
Let's start by setting goals for the near future that we can consider:
T1 - $ 1,757
T2 - $ 1,785
and
T3 - $ 1,865
Now let's move on to the stop loss in case of further market declines:
SL1 - $ 1731
SL2 - $ 1717
SL3 - $ 1704
SL4 - $ 1,693
and
SL5 - $ 1,676
Looking at the CHOP indicator, we can see that the energy has been used on the 15-minute interval, and the MACD indicator shows a local upward trend.

DOT SHORT 15M Hello everyone, let's take a look at the 15M DOT to USDT chart as you can see the price is moving below the local downtrend line.
Let's start by setting goals for the near future that we can consider:
T1 - $ 8.64
T2 = $ 8.67
T3 = $ 8.70
T4 = $ 8.73
and
T5 = $ 8.76
Now let's move on to the stop loss in case of further market declines:
SL1 = $ 8.57
and
SL2 = $ 8.51
Looking at the CHOP indicator, we can see that there is a lot of energy in the 15M range, while the MACD indicator shows a local downward trend.
