BTC Long Term And Short Term AnalysisBTC LONG TERM - On the 1D there is a red spot but now it is at support and could bounce back up to the topside of the range. There is a green spot on the 4H so if it close's above 19900 on the 4H I can see it testing 20500.
BTC SHORT TERM - On the 1H it has closed above the 21 ema for the first time since 4 days ago. What we don't want to see is rejection at this point because that will make another lower high, if it does that then it could come further down. On the 15M it could have a little pull back down towards 19700 and put in a higher low.
BTC OVERALL - Overall I think Bitcoin will bounce soon as long as it close's above 19900 on the 4H
Let me know your thughts in the comments and like my idea!!
Targets

XRP / USDT SHORT 4HHello everyone, let's take a look at the 4H XRP to USDT chart as you can see the price is moving below the local downtrend line.
Let's start by setting goals for the near future that we can consider:
T1 - $ 0.3199
T2 - $ 0.3275
T3 - $ 0.3335
T4 - $ 0.3393
and
T5 - $ 0.3481
Now let's move on to the stop loss in case of further market declines:
SL1 - $ 0.3079
SL2 - $ 0.3039
SL3 - $ 0.2976
and
SL4 - $ 0.2912
Looking at the CHOP indicator, we can see that in the 4H range the energy is slowly rising, while the MACD indicator shows a local downward trend, however the blue line is approaching the red line, if it crosses it from the bottom, it may confirm the upward trend change.

DOGE in the local downtrend. Lots of energy on 1D.Hello everyone, let's take a look at the 1D DOGE to USDT chart as you can see the price has dropped below the local uptrend line.
Let's start by setting goals for the near future that we can consider:
T1 = $ 0.06843
T2 = $ 0.07035
T3 = $ 0.07241
T4 = $ 0.07513
and
T5 = $ 0.07849
Now let's move on to the stop loss in case of further market declines:
SL1 = $ 0.06040
SL2 = $ 0.05544
and
SL3 = $ 0.04919
Looking at the CHOP indicator, we can see that in the 1D range we have a lot of energy and the MACD indicator shows that we have entered a local downward trend.

Monster Run Starts 7/11Updated details from my post on Friday 7/8. That was done in a hurry with the primary message being "seize the opportunity and Buy while its still in the 700s"... Here are my expectations after running a full analysis - I should note that the method I am using to calculate targets is my own, the Elliot Wave shown is just a supplemental check I use to confirm the move I am seeing coming using my method is plausible with respect to the larger structure:
- Pre-earnings target = 917.61, with the most explosive part of the move coming next week (7/11/2022 - 7/15/2022). There might be some resistance around 822-853, but I think it has the setup to squeeze right past it with consecutive big green days.
- After testing low 900s as a sign of strength, it might pullback/consolidate going into earnings. Post-ER target range is 955-984, and in the right environment it can even test the major resistance around 1150. I'll re-eval from there when the time comes.
Markup was activated with a break above 747.90, and then close above deep purple trendline Friday 7/8. We already got a taste of TSLAs strength above the 747 after hours 7/8 when if got to as high as 777 after Elon withdrew from the Twitter deal. He knows what he's doing.
Regards,
Grimes
we are from the dimension that exists in Your future, translated in Our past via R.E.M. within the dimension that exists in Your present... or did

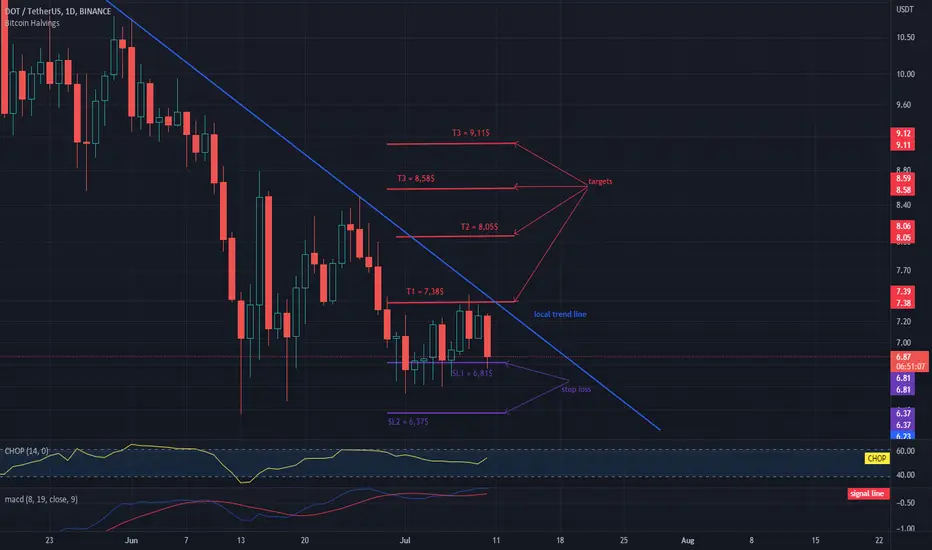
DOT / USDT 1DAY CHARTHello everyone, let's take a look at the 1D DOT to USDT chart as you can see the price is moving below the local downtrend line.
Let's start by setting goals for the near future that we can consider:
T1 = $ 7.38
T2 = $ 8.05
T3 = $ 8.58
and
T3 = $ 9.11
Now let's move on to the stop loss in case of further market declines:
SL1 = $ 6.81
and
SL2 = $ 6.37
Looking at the CHOP indicator, we can see that in the 1D range we are gaining more and more energy, and the MACD indicator shows a local upward trend.
BNB / USDT 1D INTERVAL, STOPLOSS AND TARGETSHello everyone, let's take a look at the 1day BNB to USDT chart as you can see the price is moving above the local uptrend line.
Let's start by setting goals for the near future that we can consider:
T1 - $ 242 which price is currently struggling with,
T2 - $ 260,
T3 - $ 278,
T4 - $ 304,
and
T5 - $ 337.
Now let's move on to the stop loss in case of further market declines:
SL1 - $ 232,
SL2 - $ 223,
SL3 - $ 215,
SL4 - $ 208,
SL5 - $ 196,
and
SL6 - $ 183.
Looking at the CHOP indicator, we can see that we still have a lot of energy in the 1-day range, and the MACD indicator shows that we are in the local uptrend. Please remember that this is not an investment advice.

ETH IN A LOCAL DOWNTREND Hello everyone, let's take a look at the ETH to USDT chart over the 4 hour timeframe. As you can see, price is moving above the local uptrend line.
Let's start with the designation of the support line and as you can see the first support in the near future is $ 1211, if the support breaks down, the next support is $ 1170 and $ 1137.
Now let's move from the resistance line as you can see the first resistance is $ 1225, if you can break it the next resistance will be $ 1235, $ 1245, $ 1259 and $ 1277.
Looking at the CHOP indicator, we can see that in the 4-hour interval we are recovering energy, while the MACD indicator shows a local downward trend.

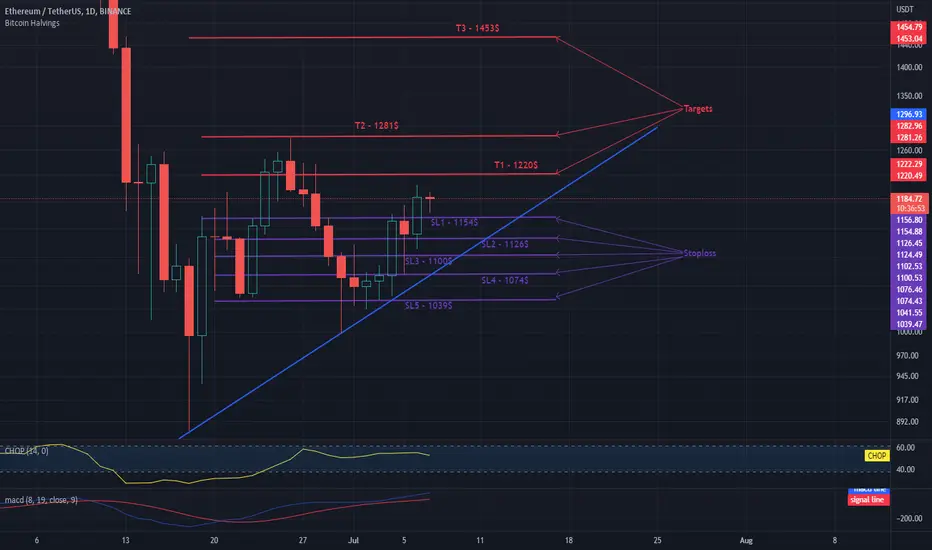
ETH 1DChart - Targets And StopLossHello everyone, let's take a look at the 1D ETH to USDT chart as you can see the price is moving below the local downtrend line.
Let's start by setting goals for the near future that we can consider:
T1 - $ 1,220
T2 - $ 1,281
and
T3 - $ 1,453
Now let's move on to the stop loss in case of further market declines:
SL1 - $ 1154
SL2 - $ 1126
SL3 - $ 1,100
SL4 - $ 1074
and
SL5 - $ 1039
Looking at the CHOP indicator, we can see that we have a lot of energy in the 1D interval and the MACD indicator shows a local upward trend.
MATIC / USDT 1D chartHello everyone, let's take a look at the 1D MATIC to USDT chart as you can see the price is moving above the local uptrend line.
Let's start by setting goals for the near future that we can consider:
T1 - $ 0.5245
T2 - $ 0.5490
T3 - $ 0.5853
and
T4 - $ 0.6616
Now let's move on to the stop loss in case of further market declines:
SL1 - $ 0.5103
SL2 - $ 0.4923
SL3 - $ 0.4773
SL4 - $ 0.4634
and
SL5 - $ 0.4436
Looking at the CHOP indicator, we can see that in the 1D range we have a lot of energy, and the MACD indicator indicates the beginning of a local uptrend.

XRP - USDT on 1H interval shortHello everyone, let's take a look at the 1H XRP to USDT chart as you can see the price is moving below the local downtrend line.
Let's start by setting goals for the near future that we can consider:
T1 - $ 0.3171
T2 - $ 0.3199
T3 - $ 0.3220
T4 - $ 0.3243
and
T5 - $ 0.3275
Now let's move on to the stop loss in case of further market declines:
SL1 - $ 0.3142
SL2 - $ 0.3097
and
SL3 - $ 0.3052
Looking at the CHOP indicator, we can see that in the 1H range, energy has been used, and the MACD indicator shows that the blue line is approaching the intersection of the red one from below, which would confirm a local uptrend.

BTC Long Term And Short Term AnalysisBTC LONG TERM - On the 1D it could get a 3rd strike of bullish divergence on the Crypto trend indicator which could maybe give it a little bounce upwards to 22900 then maybe come down further once the divergence has played out.
BTC SHORT TERM - On the 1H it looks like it wants to bounce a bit more, it has broke the 21 and 55 EMA with the stochastic crossing up and a green spot on the crypto trend.
Short term it could test upwards to 20400.
BTC OVERALL - I think BTC will continue this bounce up to at least 20400 with it looking bullish short term.
Let me know your thoughts in the comments and like my idea!!

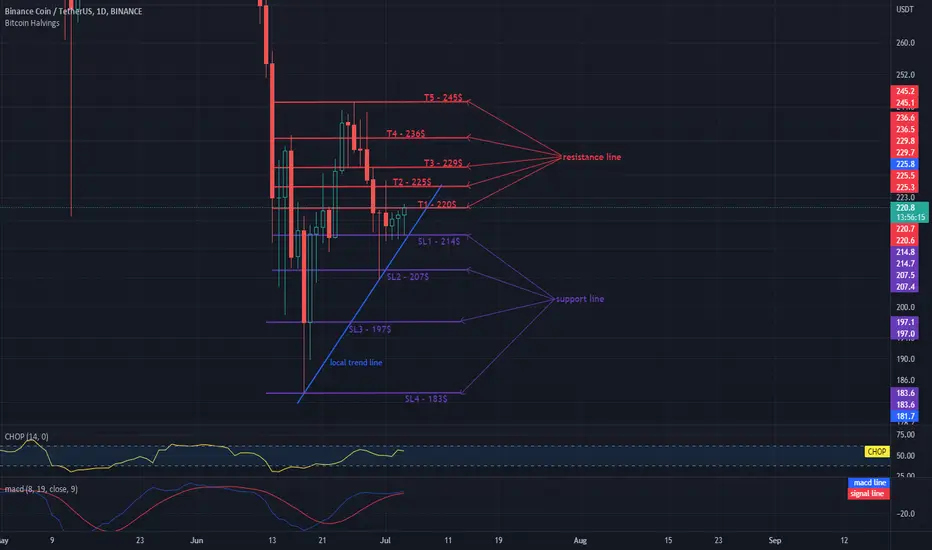
BNB / USDT 1DAYCHART TARGETS AND STOPLOSSHello everyone, let's take a look at the 1D BNB to USDT chart as you can see the price is moving above the local trendline.
Let's start by setting goals for the near future that we can consider:
T1 - $ 220
T2 - $ 225
T3 - $ 229
T4 - $ 236
and
T5 - $ 245
Now let's move on to the stop loss in case of further market declines:
SL1 - $ 214
SL2 - $ 207
SL3 - $ 197
and
SL4 - $ 183
Looking at the CHOP indicator, we can see that we have a lot of energy in the 1D range, while the MACD indicator shows a local upward trend.
DOGE/USDT TARGETS AND STOPLOSSHello everyone, let's take a look at the 4H DOGE to USDT chart as you can see the price is moving below the local uptrend line.
Let's start by setting goals for the near future that we can consider:
T1 = $ 0.06843
T2 = $ 0.07035
T3 = $ 0.07241
T4 = $ 0.07513
and
T5 = $ 0.07849
Now let's move on to the stop loss in case of further market declines:
SL1 = $ 0.06391
SL2 = $ 0.06040
SL3 = $ 0.05544
and
SL4 = $ 0.04919
Looking at the CHOP indicator, we can see that in the 4H range we have a lot of energy for the next move, while the MACD indicator shows a local upward trend.

SOL - USDT SHORT 1HHello everyone, let's take a look at the 4H SOL to USDT chart as you can see the price is moving below the local downtrend line.
Let's start by setting goals for the near future that we can consider:
T1 - $ 33.75
T2 - $ 35.49
T3 - $ 36.87
T4 - $ 38.27
and
T5 - $ 40.28
Now let's move on to the stop loss in case of further market declines:
SL1 - $ 32.71
SL2 - $ 31.01
and
SL3 - $ 28.25
Looking at the CHOP indicator, we can see that we have a lot of energy in the 4H range, and the MACD indicator shows the local upward trend.

SHIB/USDT SHORT 4HHello everyone, let's take a look at the 4H SHIB to USDT chart as you can see the price is moving below the local downtrend line.
Let's start by setting goals for the near future that we can consider:
T1 - $ 0.00001016
T2 - $ 0.00001055
T3 - $ 0.00001084
T4 - $ 0.00001116
and
T5 - $ 0.00001160
Now let's move on to the stop loss in case of further market declines:
SL1 - $ 0.00000987
SL2 - $ 0.00000964
SL3 - $ 0.00000925
SL4 - $ 0.00000904
and
SL5 - $ 0.00000820
Looking at the CHOP indicator, we can see that in the 4H range we have a lot of energy, and the MACD indicator shows a local upward trend, but the blue line is close to the red line, if it crosses it from the top, it can confirm the trend change.

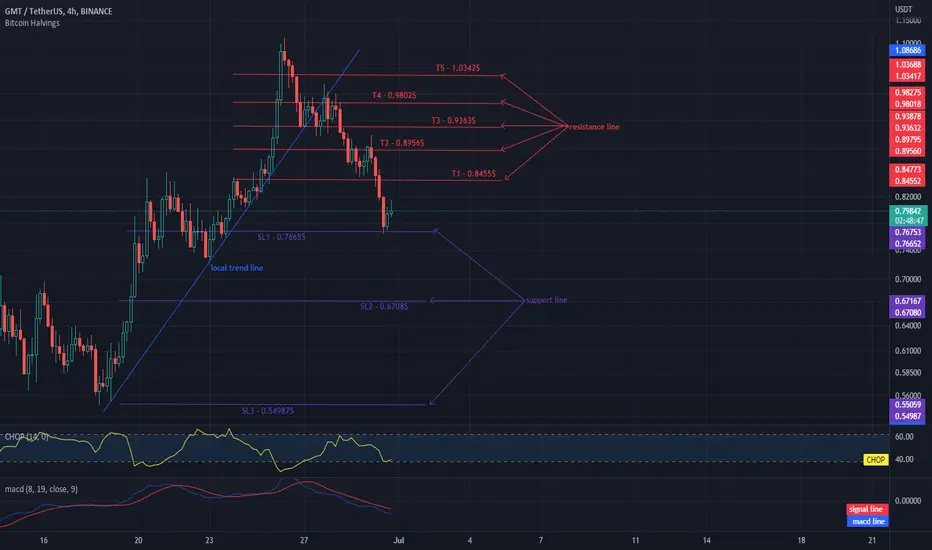
GMT - TARGETS AND STOPLOSS 4HHello everyone, let's take a look at the 4H GMT to USDT chart as you can see the price is moving below the local uptrend line.
Let's start by setting goals for the near future that we can consider:
T1 - $ 0.8455
T2 - $ 0.8956
T3 - $ 0.9363
T4 - $ 0.9802
and
T5 - $ 1.0342
Now let's move on to the stop loss in case of further market declines:
SL1 - $ 0.7665
SL2 - $ 0.6708
and
SL3 - $ 0.54987
Looking at the CHOP indicator, we can see that in the 4H range the energy is depleted and the MACD indicator shows a downward trend.
WILL BNB change its trend to an uptrend?Hello everyone, let's take a look at the 1H BNB to USDT chart as you can see the price is moving below the local uptrend line.
Let's start by setting goals for the near future that we can consider:
T1 - $ 221
T2 - $ 225
T3 - $ 228
and
T4 - $ 231
Now let's move on to the stop loss in case of further market declines:
SL1 - $ 218
and
SL2 - $ 211
Looking at the CHOP indicator, we can see that in the 1H range we have a lot of energy, and the MACD indicator shows that the trend is changing into an upward trend.

BNB - a local downward trend on the 1H intervalHello everyone, let's take a look at the 1H BNB to USDT chart as you can see the price is moving below the local uptrend line.
Let's start by setting goals for the near future that we can consider:
T1 - $ 236
T2 - $ 250
and
T3 - $ 268
Now let's move on to the stop loss in case of further market declines:
SL1 - $ 230
SL2 - $ 221
SL3 - $ 214
SL4 - $ 207
and
SL5 - $ 196
Looking at the CHOP indicator, we can see that the energy has been used in the 1H interval, and the MACD indicator shows a local downward trend.

FTM In a local downtrendHello everyone, let's take a look at the 1H FTM to USDT chart as you can see the price is on the border of the uptrend line.
Let's start by setting goals for the near future that we can consider:
T1 - $ 0.3734
T2 - $ 0.3460
and
T3 - $ 0.3872
Now let's move on to the stop loss in case of further market declines:
SL1 - $ 0.2884
SL2 - $ 0.2698
SL3 - $ 0.2549
SL4 - $ 0.2412
and
SL5 - $ 0.2198
Looking at the CHOP indicator, we can see that in the 1H range we have less and less energy and the MACD indicator shows a local downward trend.

DOT for 1 hour interval!Hello everyone, let's take a look at the 1H DOT to USDT chart as you can see the price is moving above the local downtrend line.
Let's start by setting goals for the near future that we can consider:
T1 = $ 8.29
T2 = $ 8.81
and
T3 = $ 9.47
Now let's move on to the stop loss in case of further market declines:
SL1 = $ 8.00
SL2 = $ 7.71
SL3 = $ 7.48
SL4 = $ 7.24
and
SL5 = $ 6.90
Looking at the CHOP indicator, we can see that in the 1 hour interval we have little energy and the MACD indicator shows a local downward trend.

TARGETS AND STOPLOSS FOR ADA/USDTHello everyone, let's take a look at the 4H ADA to USDT chart, As you can see, the price has moved sideways from the downtrend line and is now moving in the local uptrend channel marked by the yellow lines.
Let's start by setting goals for the near future that we can consider:
T1 - $ 0.5150
T2 - $ 0.5456
T3 - $ 0.5754
and
T4 - $ 0.6157
Now let's move on to the stop loss in case of further market declines:
SL1 - $ 0.4886
SL2 - $ 0.4755
SL3 - $ 0.4648
and
SL4 - $ 0.4548
Looking at the CHOP indicator, we can see that there is still some energy left in the 4H range, and the MACD indicator shows a local upward trend.

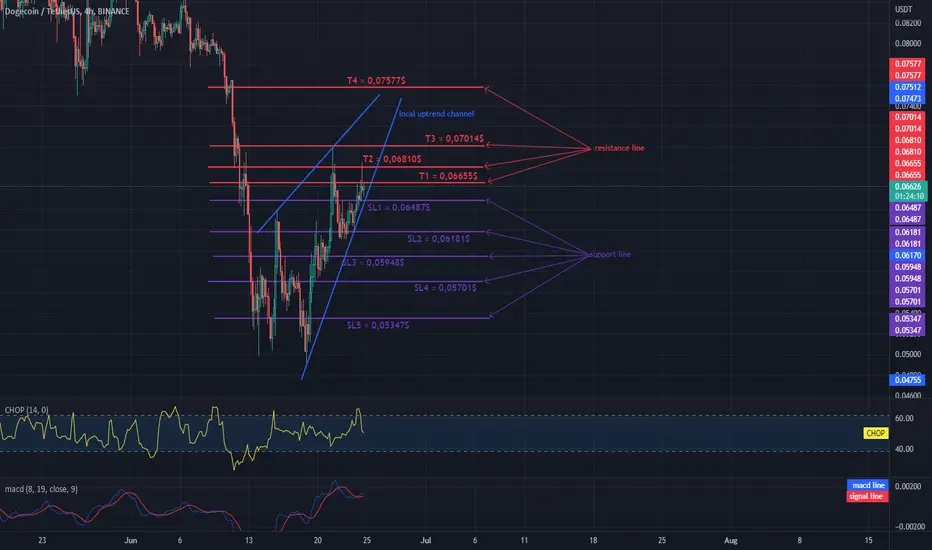
DOGE in the uptrend channelHello everyone, let's take a look at the 4H DOGE to USDT chart as you can see the price is moving in the uptrend channel.
Let's start by setting goals for the near future that we can consider:
T1 = $ 0.06655
T2 = $ 0.06810
T3 = $ 0.07014
and
T4 = $ 0.07577
Now let's move on to the stop loss in case of further market declines:
SL1 = $ 0.06487
SL2 = $ 0.06181
SL3 = $ 0.05948
SL4 = $ 0.05701
and
SL5 = $ 0.05347
Looking at the CHOP indicator, we can see that in the 4H range some energy was used, and the MACD indicator shows an upward trend.
ETH is back to around $ 1,200Hello everyone, let's take a look at the 4H ETH to USDT chart as you can see the price is moving above the local uptrend line.
Let's start by setting goals for the near future that we can consider:
T1 - $ 1,288
T2 - $ 1,437
T3 - $ 1,586
and
T4 - $ 1,684
Now let's move on to the stop loss in case of further market declines:
SL1 - $ 1145
SL2 - $ 1096
SL3 - $ 1,054
SL4 - $ 1010
and
SL5 - $ 951
Looking at the CHOP indicator, we can see that in the 4H range most of the energy was used, and the MACD indicator shows a local upward trend.
