DOGE/USDT 1D chart ReviewHello everyone, let's look at the 1D Doge chart to USDT, in this situation we can see how the price moves over the downward trend line, but fights to stay over it.
Going further, let's check the places of potential target for the price:
T1 = 0.175 $
T2 = 0.184 $
Т3 = 0.199 $
T4 = 0.223 $
Let's go to Stop-Loss now in case of further declines on the market:
SL1 = 0.167 $
SL2 = 0.156 $
SL3 = 0.143 $
Looking at the RSI indicator, we see
As we are approaching the center of the range again, but here the space for further continuation of growth is visible.
Targets

SOL/USD 4H ChartHi everyone, let's look at the 4H SOL to USD chart, in this situation we can see how the price broke out from the local uptrend line at the bottom.
Let's start by defining the targets for the near future that the price has to face:
T1 = 131 USD
T2 = 136 USD
Т3 = 145 USD
Т4 = 151 USD
Now let's move on to the stop-loss in case the market continues to fall:
SL1 = 122 USD
SL2 = 115 USD
SL3 = 107 USD
If we look at the RSI indicator we can see how the indicator has dynamically gone up despite the price not moving much, but here we can see that there is still room for a potential attempt to grow.

BTC/USD 1D chart reviewHello everyone, let's look at the 1D BTC chart to USD, in this situation we can see how the price moves in the downward trend channel, in which we turn back at the top edge of the channel. Going further, let's check the places of potential target for the price:
T1 = 87100 $
T2 = 89945 $
Т3 = 93556 $
Let's go to Stop-Loss now in case of further declines on the market:
SL1 = 81739 $
SL2 = 77307 $
SL3 = 74353 $
Looking at the RSI indicator, we see
As we came again to the center of the range at which we could again experience the price of price.

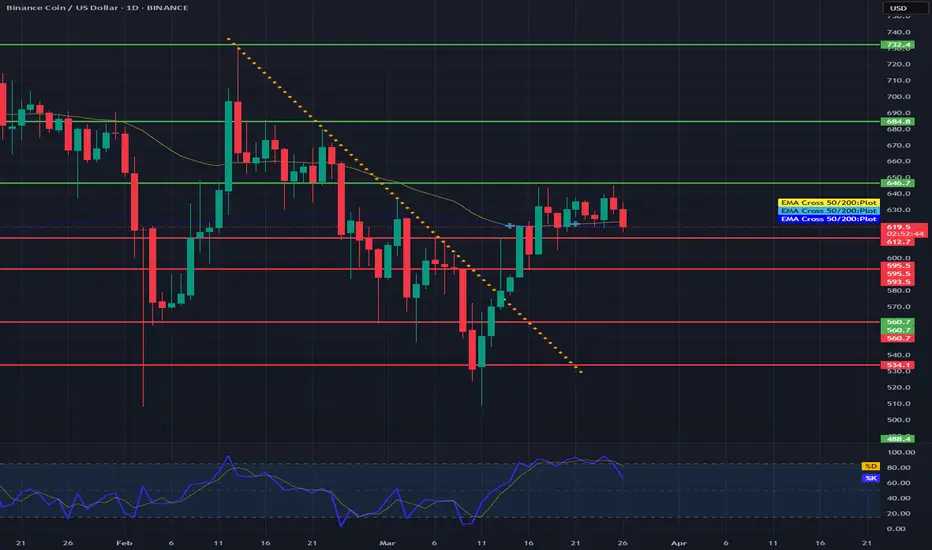
BNB before correction?Hello everyone, let's look at the 1D BNB to USD chart, in this situation we can see how the price came out of the downtrend line, however, here it is worth observing the EMA Cross 50 and 200 indicator, which shows a fight to maintain the uptrend. Please take into account the STOCH indicator, which shows a longer movement at the upper limit of the range, which may confirm the current rebound and give a deeper correction, however, here it is important for the price to stay above the level of the last low.
Let's start by defining the goals for the near future, which the price must face:
T1 = 646 USD
T2 = 684 USD
Т3 = 732 USD
Now let's move on to the stop-loss in case the market continues to fall:
SL1 = 612 USD
SL2 = 595 USD
SL3 = 560 USD
SL4 = 534 USD
SOL/USDT 4H Chart ReviewHello everyone, let's look at the 4H SOL to USDT chart, in this situation we can see how the price has moved sideways from the downtrend line, while currently we see movement in the triangle marked with blue lines, in which we are also approaching the exit, and therefore the price should take the direction of movement.
Let's start by defining the goals for the near future that the price must face:
T1 = 206 USD
T2 = 224 USD
Т3 = 239 USD
Т4 = 255 USD
Now let's move on to the stop-loss in case the market continues to fall:
SL1 = 192 USD
SL2 = 174 USD
SL3 = 160 USD
SL4 = 146 USD
When we look at the RSI indicator, we can see how energy is approaching the lower limit of the range and here we can see that we often had descents significantly below the lower range, but we are approaching the zone where we could previously observe price rebounds.

Potentially a good time for LONG MKR/USDHello everyone, let's look at the 1W MKR to USD chart, in this situation we can see how the price created a lower low with the last drop, what is important is that now it goes up creating a new higher local high. What's more, we can see how the ema cross 50 and 200 approached each other, but the price exiting upwards should maintain a long-term upward trend. We can also see how the whole thing is moving in a descending triangle, but an exit from the yellow downward trend line upwards can give a new strong upward movement.
Let's start by defining the goals for the near future that it has to deal with, and here you can see how the price bounced off the first target:
T1 = 1631 USD
T2 = 2159 USD
Т3 = 3015 USD
Т4 = 3607 USD
As for support or potential stop-loss when opening a long, we need to consider a strong support zone from $1028 to $542, with the level around $790 being key, as it is our last lower low in declines.
The RSI and STOCH indicators show an attempt to break out of the local downtrend lines upwards, which may also have a positive impact on the next price movement.

BTC/USD 1D Chart ReviewHello everyone, let's look at the 1D BTC to USD chart, in this situation we can see how the price is moving in the designated downward channel, in which the price started to grow again. What's more, we can see consolidations on the EMA Cross indicator and here it is worth watching the movement of the red line to see if it will again go up from the green line, which would confirm the return of the uptrend.
Let's start by defining the goals for the near future that the price must face:
T1 = 85808 USD
T2 = 88093 USD
Т3 = 91127 USD
Т4 = 95106 USD
Now let's move on to the stop-loss in case the market continues to fall:
SL1 = 82854 USD
SL2 = 79859 USD
SL3 = 75171 USD
If we look at the MACD indicator, we can see how it indicates an uptrend, but we still have to wait for a return to a strong main uptrend. The RSI shows rebounds near the middle of the range, which we are approaching again, and it is worth paying attention to how the price will behave now.

BNB/USDT 1D chart, target and stop-lossHello everyone, let's look at the 1D BNB chart to USDT, in this situation we can see how the price came out of the top of the ongoing downward trend.
Going further, let's check the places of potential target for the price:
T1 = $ 646
T2 = $ 683
Т3 = $ 732
Let's go to Stop-Loss now in case of further declines on the market:
SL1 = $ 592
SL2 = $ 558
SL3 = $ 535
SL4 = $ 505
Looking at the RSI indicator, we see
As we entered the upper part of the range again, however, there is still a place for the price to go higher, giving more targets.

XRP/USDT 4h chart review Hello everyone, let's look at the 4H XRP chart to USDT, in this situation we can see how the price moves over the upward trend line, or rather on the upward trend line and fights to stay above the line.
However, let's start by defining goals for the near future the price must face:
T1 = $ 2.41
T2 = $ 2.49
Т3 = 2.56 $.
T4 = $ 2.63
Let's go to Stop-Loss now in case of further declines on the market:
SL1 = 2.30 $
SL2 = $ 2.25
SL3 = $ 2.22
SL4 = $ 2.17
Looking at the RSI indicator, you can see how it stays in the upper part of the range, however, you can see how there was a place for potentially re -growth.

ETH/USDT 1h chart reviewHello everyone, let's look at the 1H ETH chart to USDT, in this situation we can see how the price moves in the triangle from which we have an attempt to go out.
However, let's start by defining goals for the near future the price must face:
T1 = 1951 $
T2 = 1986 $
Т3 = 2032 $.
Let's go to Stop-Loss now in case of further declines on the market:
SL1 = 1905 $
SL2 = 1871 $
SL3 = $ 1846
SL4 = $ 1817

BNB/USDT 1DHello everyone, let's look at the 1D BNB chart to USDT, in this situation we can see how the price moves in the local triangle in which we approach the moment we leave and try to take the direction of further movement.
However, let's start by defining goals for the near future the price must face:
T1 = $ 595
T2 = $ 649
Т3 = 690 $.
T4 = $ 738
Let's go to Stop-Loss now in case of further declines on the market:
SL1 = $ 562
SL2 = $ 527
SL3 = = $ 474
SL4 = 436 $
Looking at the MACD indicator, you can see the traffic in the downward trend, but here you can see an attempt to change the direction and after

ETH/USD 1D Chart ReviewHey everyone, let's look at the 1D ETH to USD chart, in this situation we can see how the price has reverted back to the long-standing uptrend, and here we can see a significant decline below the uptrend line.
In the event that the trend reverses and growth begins again, it is worth setting targets for the near future that the price must face:
T1 = 2246 USD
T2 = 2533 USD
Т3 = 2785 USD
Т4 = 3010 USD
Т5 = 3365 USD
However, here we can see how the current decline has been maintained by the support zone from $ 1904 to $ 1686, however, if the zone is broken further, we can see a decline to the level of $ 1338, and then again we can have the price go down to the area of $ 921
The RSI indicator shows a continuing downward trend, and here we can see a decline to the lower part of the range, but there is still room for the price to go lower to the lower limit.

ETC/USDT 1D chart reviewHello everyone, let's look at the 1D chart etc to USDT, in this situation we can see how the price moves in a slight side trend in which you can see the output sideways from the downward trend line.
However, let's start by defining goals for the near future the price must face:
T1 = 22.25 $
T2 = = $ 25.63
Т3 = 28.48 $
T4 = 31.06 $
Let's go to Stop-Loss now in case of further declines on the market:
SL1 = 19.04 $
However, you can still see a strong support zone that strongly maintains the price from a larger decline zone from $ 17.11 to $ 15.82.
Looking at the RSI indicator, you can see a return to the center of the range despite slight price movements on the chart, however, there is still room for a potential new growth movement.

Will SOL start growing now that Trump has announced the reserve?Hi everyone, let's look at the 1D SOL to USD chart, in this situation we can see how the price is moving in an ascending channel where it is currently struggling to stay in the lower part of the channel.
Let's start by defining the targets for the near future that the price has to face:
T1 = 172.96 USD
T2 = 202.57 USD
Т3 = 223.84 USD
Т4 = 250.58 USD
Now let's move on to the stop-loss in case the market continues to fall:
SL1 = 139.90 USD
SL2 = 114.89 USD
SL3 = 94.76 USD
SL4 = 74.35 USD
It is worth looking at the MACD indicator where we can see how low we have gone much lower than during the previous declines, which could potentially indicate that the price will try to go up if the ongoing bullish trend is maintained.

BTC/USDT 1D chart reviewHello everyone, let's look at the 1D BTC chart for USDT, in this situation we can see how the price moves in the local channel of the downward tendu in which we currently see a strong reflection and a quick return price around the upper border of the channel. However, let's start by defining goals for the near future the price must face:
T1 = 94020 $
T2 = 97698 $
Т3 = 102865 $
T4 = 109520 $
Let's go to Stop-Loss now in case of further declines on the market:
SL1 = 91130 $
SL2 = 88503 $
SL3 = 84723 $
SL4 = 81673 $
Looking at the MacD indicator, you can see that despite S

Will BTC end the current correction at -24%? 1D ChartHello everyone, let's look at the 1D BTC to USDT chart, in this situation we can see how the price came out of the downtrend channel to the top, which gave a dynamic price increase, and then a new channel was created, this time an uptrend from which we could see an exit from the bottom. In a situation where the exit from the channel confirmed the decrease by the height of the channel, we could see another price decrease.
Let's start by defining the targets for the near future that the price must face:
T1 = 90088 USD
T2 = 95448 USD
Т3 = 103291 USD
Т4 = zone from 109435 USD to 115187 USD
Now let's move on to the stop-loss in case the market continues to fall:
SL1 = 79108 USD
SL2 = 72179 USD
SL3 = 61983 USD
When we look at the RSI indicator and the STOCH indicator, we can see that the energy is very much depleted and we are at the lower limit of the range, where previously we could often see a change in the price direction after such a situation.

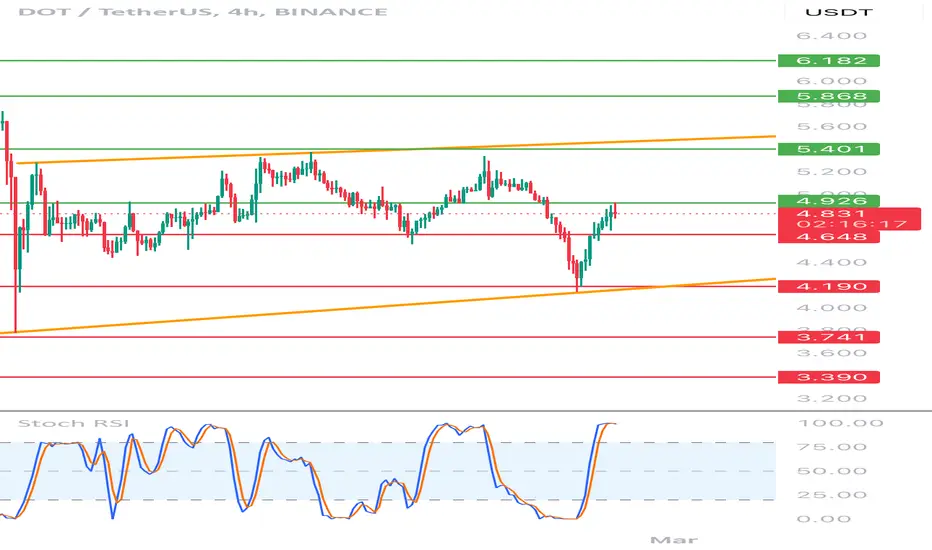
DOT/USDT 4H chart reviewHello everyone, let's look at the 4H Dot chart to USDT, in this situation we can see how the price moves in the local growth trend channel. However, let's start by defining goals for the near future the price must face:
T1 = $ 4.93
T2 = $ 5.40
Т3 = $ 5.87
T4 = $ 6.18
Let's go to Stop-Loss now in case of further declines on the market:
SL1 = 4.65 $
SL2 = 4.19 $
SL3 = $ 3,74
SL4 = $ 3.39
Looking at the RSI indicator, you can see the traffic above the upper limit of the range in the place where the price relief could be observed earlier.
BTC/USDT 1h chart reviewHello everyone, let's look at the 1H BTC chart to USDT, in this situation we can see how the price moves in the downward trend, the reflection from the downward trend line was currently visible. However, let's start by defining goals for the near future the price must face:
T1 = 94661 $
T2 = 95162 $
Т3 = 95521 $
T4 = 95969 $
T5 = 97241 $
Let's go to Stop-Loss now in case of further declines on the market:
SL1 = 93804 $
SL2 = 93279 $
SL3 = 92421 $
Looking at the RSI indicator, we see
How we stay below the lower range of the range, which may potentially indicate the end of the current relaxation.

LTC/USDTHello everyone, let's look at the 4H LTC chart to USDT, in this situation we can see how the price moves in the local high -ranking channel in which we quickly saw the return to the lower border of the channel. However, let's start by defining goals for the near future the price must face:
T1 = $ 129
T2 = $ 132
Т3 = $ 138
Let's go to Stop-Loss now in case of further declines on the market:
SL1 = $ 125
SL2 = $ 121
SL3 = $ 118
SL4 = $ 114
Looking at the RSI indicator, we see
As we entered the lower part of the range again, which may indicate a new growth movement, but here you can see the city so that any correction deepens.

XRP/USDT 1D chart reviewHello everyone, let's look at the 1D XRP chart to USDT, in this situation we can see how the price moves under the downward trend line, but we can see some price stabilization, which can affect the potential change of trend.
However, let's start by defining goals for the near future the price must face:
T1 = $ 2.57
T2 = $ 2.39
Т3 = 2.15 $
T4 = 1.76 $
Let's go to Stop-Loss now in case of further declines on the market:
SL1 = $ 2.77
SL2 = $ 3.07
SL3 = 3.40 $
The MacD indicator shows how we are still in the downward trend, but here you can see some stabilization, which may indicate an attempt to return to the upward trend.

LINK/USDT 1W chart ReviewHello everyone, let's look at the 1W link to USDT, in this situation we can see how the price moves under the downward trend line, but we can see some price stabilization, which can affect the potential change of trend. However, let's start by defining goals for the near future the price must face:
T1 = 19.20 $
T2 = = $ 21.67
Т3 = $ 25
T4 = $ 27.65
Let's go to Stop-Loss now in case of further declines on the market:
SL1 = $ 16.82
SL2 = $ 14.90
SL3 = 12.73 $
Looking at the RSI indicator, we see the descent below the lower limit of the range, which may also indicate

FTM/USD 8H possible correction?Hello everyone, let's look at the 8H FTM to USDT chart, in this situation we can see how the price has broken out of the local downtrend line, which it is currently moving above.
Let's start by defining the targets for the near future that the price must face:
T1 = $0.75
T2 = $0.86
Т3 = $1.02
Т4 = $1.19
Now let's move on to the stop-loss in case the market continues to fall:
SL1 = $0.60
SL2 = $0.49
SL3 = $0.42
SL4 = $0.32
It is worth looking at the RSI indicator, which shows how strongly we have broken out of the upper limit of the range, moreover, here we can see how we have touched the level of 81, at which price rebounds were previously visible.

BTC/USDT 1D Chart Reviev/Are we approaching a new upward moveme?Hello everyone, let's look at the 1D BTC to USDT chart, in this situation we can see how the price is locally below the downtrend line and currently following the downtrend we are approaching the main uptrend line which is a strong support for the price.
Let's start by defining the targets for the near future that the price has to face:
T1 = 98948USD
T2 = 101357USD
Т3 = 103727USD
Т4 = 107100USD
Now let's move on to the stop-loss in case the market continues to fall:
Currently we can see how the price is holding in a strong support zone from the level of $94450 to the level of $92683, however if we exit this zone below it it is worth considering a stoploss at these levels.
SL1 = 89791USD
SL2 = 85213USD
It is worth paying attention to the RSI indicator where we can see a break of the support line, which gives a strong reaction, and we can see how we are approaching the lower limit of the range, and what is more, we can see that currently we are lower on the indicator, but the price remains at a similar level or even slightly higher, which can positively affect the potential price rebound, giving a greater increase.

ETC/USDT 1H Chart ReviewHi everyone, let's look at the 1h ETC to USDT chart, in this situation we can see how the price has fallen below the uptrend line, and what's more we can see the first attempt to return above the trend line, however we can see the place that rejected the price.
Let's start by defining the targets for the near future that the price has to face:
T1 = 20.79 USD
T2 = 21.09 USD
Т3 = 21.60 USD
Т4 = 21.95 USD
Now let's move on to the stop-loss in case the market continues to fall:
SL1 = 20.19 USD
SL2 = 19.73 USD
SL3 = 19.26 USD
SL4 = 18.90 USD
On the Stoch RSI indicator we can see how the energy is decreasing and staying in the lower part of the range, keeping the price from a bigger drop for now.
