Bullish on All time frames.
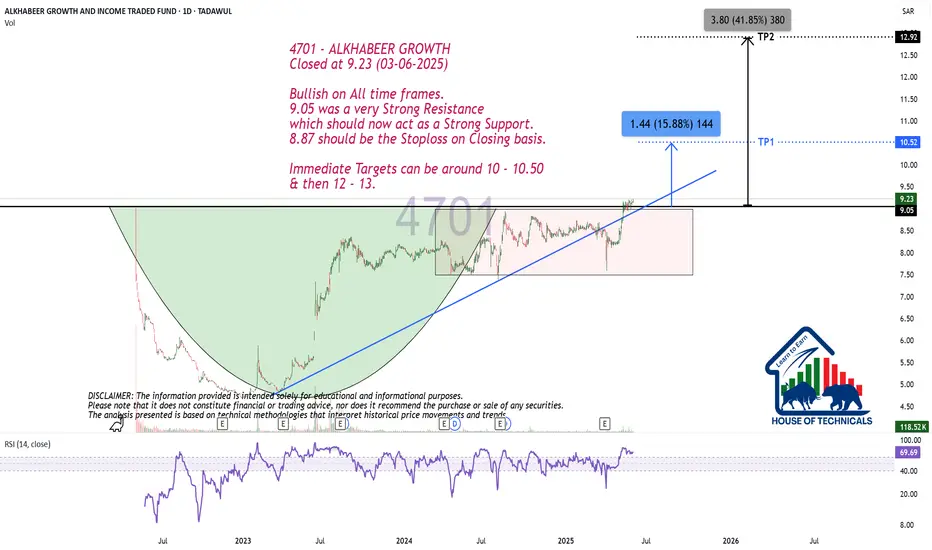
Closed at 9.23 (03-06-2025)
Bullish on All time frames.
9.05 was a very Strong Resistance
which should now act as a Strong Support.
8.87 should be the Stoploss on Closing basis.
Immediate Targets can be around 10 - 10.50
& then 12 - 13.
TASI
Al Rajhi Bank Weekly Technical Analysis: Bullish Setup in PlayTADAWUL:1120 (Al Rajhi Bank) — Weekly Technical Setup
Price is moving in ascending channel and currently reacting at the 0.786 retracement area. It is holding above the 55 Fibonacci EMA on the weekly timeframe, which has historically acted as dynamic support. Buy 2 is set near channel support and the rising trendline for a better average if price dips first.
RSI is fully in sync — no red flags there. Seasonality also leans bullish for December historically. The conservative stop is placed below major horizontal support that previously acted as resistance, while the aggressive stop sits below the trendline zone.
TP1 is aligned with recent major resistance. Further targets are based on the AB=CD harmonic projection and potential continuation if price eventually breaks the channel top. Fundamentally, this is one of the strongest banks in Saudi, showing steady earnings and solid financial performance over time.
Recommended Levels:
• Buy 1: 96.00 (CMP)
• Buy 2: 92.90
• Stop Loss: Closing below 88.00
• Take Profit 1: 108
• Take Profit 2: 116
• Take Profit 3: 124 / Ride the trend with a trailing stop
Potential remains strong as long as price sustains above the major horizontal zone.

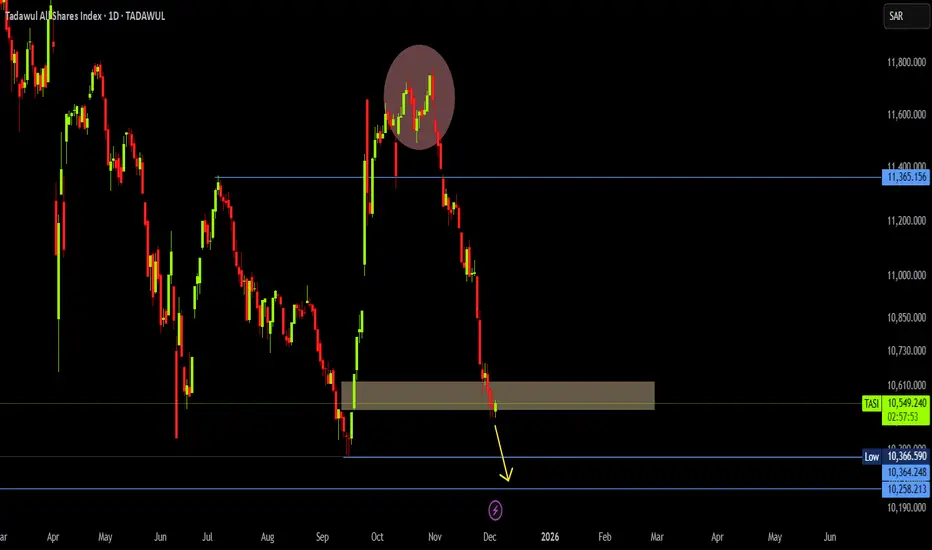
TASI IS STILL FALLING DOWNDear Saudi Traders,
Been a long time since I last posted about saudi market, now I'm back with the lates updates on the markets since I seen some people saying to buy some particular stocks.
First of all TASI is falling down, so there's nothing to do, and it will keep falling for the next following monts, we'll expect it to start rising in the 2nd Q of 2026. But for now there's nothing to make on the market, every position you take will end up in losses.
As you can see on the chart, the price will drop to 10,258.213 at least before reversing to come higher.
So for now hold your funds, and don't buy. Once I see something positive on the market I'll be the first to post about it.
Follow so you won't miss any updates!
East Pipes (1321) Potential Buying OpportunityBreak level 114.9, indicating a potential start of an uptrend.
entry: with FVG .
target:131.5
stop-loss: 117.1
Risk-to-Reward (RR) 2:1

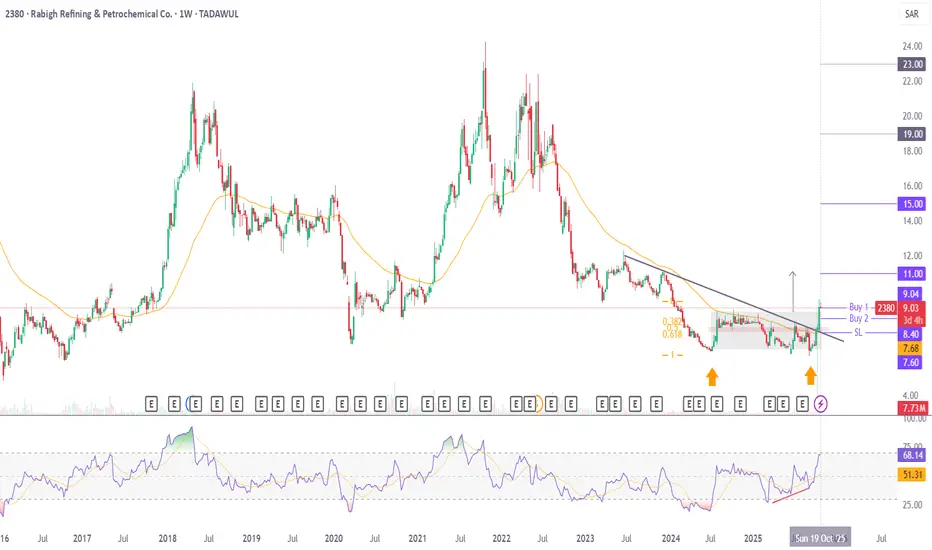
2380 Technical Analysis: Weekly Bullish Breakout in Play2380 (Rabigh Refining & Petrochemical Co.)
Price has broken out of a bullish rectangle pattern on the weekly timeframe, supported by bullish divergence and strong volume. On the monthly chart, it has formed a double bottom and hidden bullish divergence, while continuing to move within a long-term range between 26 and 6 since 2009.
Price is trading above the 55 Fibonacci EMA on the weekly chart — a level it has historically respected as dynamic support and resistance. It has also given a breakout from the daily trendline, further strengthening the bullish structure.
Buy 2 is positioned lower in case of a healthy pullback for a stronger average. TP1 aligns with the rectangle projection, while sustained momentum could open room for price to extend toward 15, 19 and 23.
Recommended Levels:
Buy 1: 9.04 (CMP)
Buy 2: 8.40
Stop Loss: Closing below 7.60
Take Profit 1: 11.00
Take Profit 2: 15.00
Take Profit 3: Ride the trend with a trailing stop
Financially, the stock isn’t too strong — only free cash flow from operating activities and overall FCF remain positive on a quarterly basis.
Potential remains strong technically as long as price sustains above the 55 EMA. Happy trading!
Bullish
Bullish Divergence on Daily tf.
Immediate resistance is around 83 - 83.50
Very important to cross & sustain 86 - 87
for further upside.
However, should not breakk 65.50 , otherwise
we may witness further selling pressure.

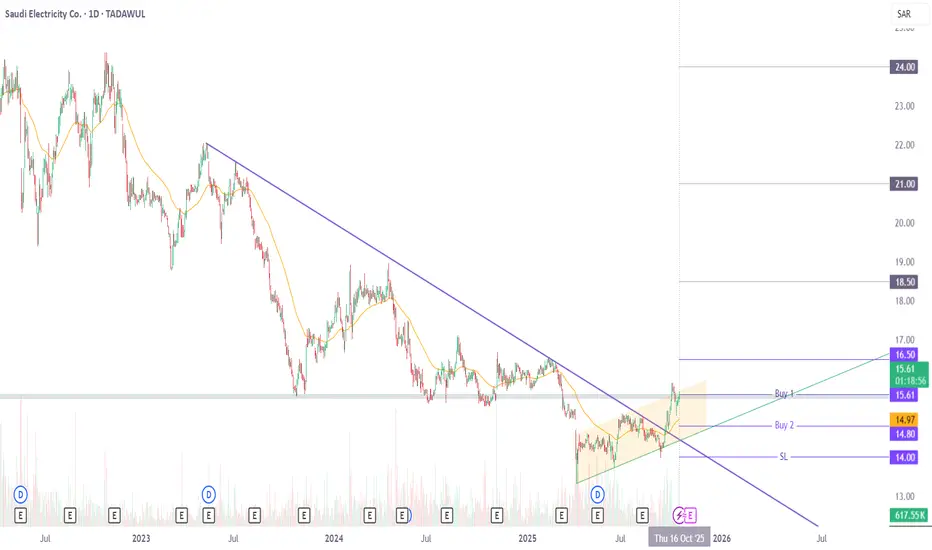
5110 Technical Analysis: Bullish Setup in Play5110 (Saudi Electricity Co.)
Price is trading above the 55 Fib EMA on the daily timeframe, a level it has historically respected as dynamic support and resistance. It is also trading above a rising trendline and has broken out from a long-term falling trendline, moving now within an ascending channel. Recently, price gave a strong close above a key horizontal support zone, reinforcing the bullish structure. RSI is also in sync with the setup.
On the fundamental side, the stock has shown positive growth in revenue, gross profit, operating income, net income, and EPS over past quarters, supporting the bullish technical outlook.
Buy 2 is positioned lower in case of a healthy pullback for a stronger average. TP1 and TP2 are aligned with near-term resistances, while sustained momentum beyond TP1 opens room for price to extend toward 18.5, 21, and 24. Stop loss is set below 14.00 on a closing basis to define risk.
Recommended Levels:
Buy 1: 15.61 (CMP)
Buy 2: 14.80
Stop Loss: Closing below 14.00
Take Profit 1: 16.50
Take Profit 2: 18.50
Take Profit 3: Ride the trend with a trailing stop
Potential upside remains as long as price sustains above the rising trendline, and 55 Fib EMA. Happy trading!
Al-Jouf (6070) Buying OpportunityBreak level: 45.20, indicating a potential start of an uptrend.
Entry: with FVG at 46.86.
Target: 49.38
Stop-loss: 45.60
Risk-to-Reward (RR): ~2:1

#TASI TASI TASI Confirmation: It’s important to wait for confirmation today after the breakout. A strong close above the resistance level with increased volume can help confirm that the breakout is genuine, rather than a false breakout.
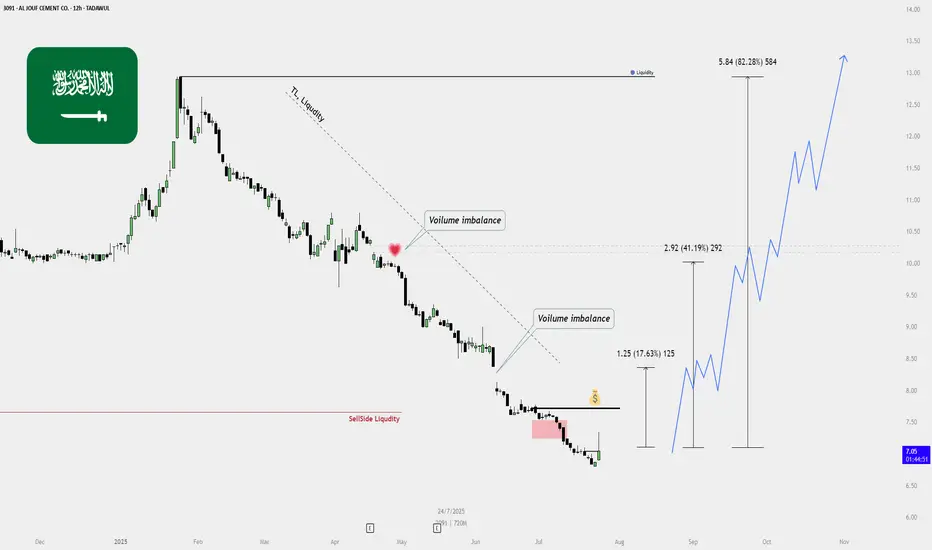
AL JOUF CEMENT – BUY PLAN (TADAWUL: 3091)📈 AL JOUF CEMENT – BUY PLAN (TADAWUL: 3091)
✅ Current Status:
Price: 7.09 SAR
Action: Initial entry taken — some shares added to My portfolio.
🔍 Technical Overview:
Sell-side Liquidity Cleared:
Previous lows taken out, triggering liquidity sweep.
Strong reversal suggests potential shift in market sentiment.
Volume Imbalances (Voids):
Bullish targets marked based on unfilled volume gaps:
📍 Target 1: 8.34 SAR (➕17.63%)
📍 Target 2: 10.01 SAR (➕41.19%)
📍 Target 3: 12.93 SAR (➕82.28%)
Trendline Liquidity Above:
Long-term descending trendline can act as a magnet for price, drawing it upward.
Bullish Confirmation:
Price has reacted from a bearish fair value gap.
Clean bullish engulfing and strong volume — suggests start of reversal.
🎯 Buy Strategy Breakdown:
Step Action
✅ Partial buy/entry completed (accumulation started)
📉 Wait for small pullback or bullish continuation to add more
🛡️ Stop Loss: Below recent swing low (around 6.50 SAR)
🚀 Targets: TP1 – 8.34, TP2 – 10.01, TP3 – 12.93
🔁 Re-evaluate plan if price closes below 6.70 with volume
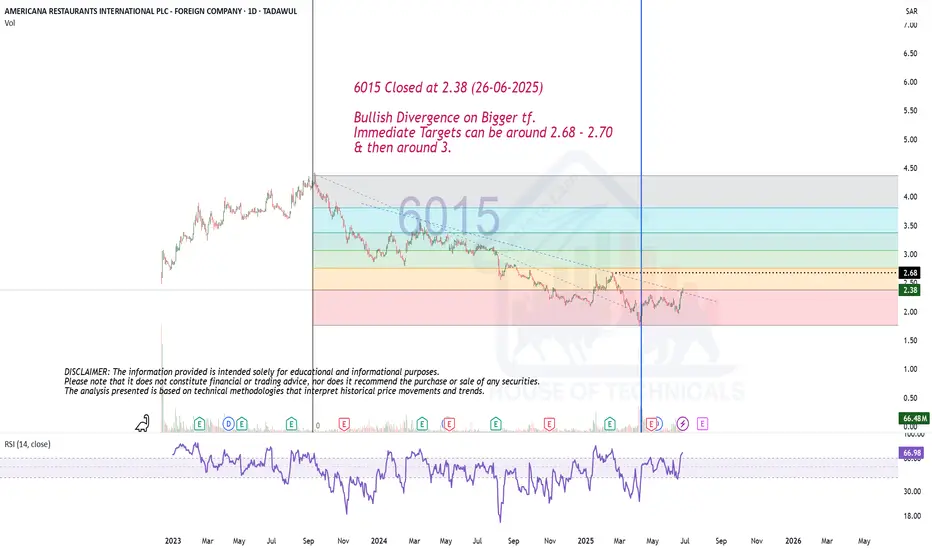
Bullish Divergence on Bigger tf.6015 Closed at 2.38 (26-06-2025)
Bullish Divergence on Bigger tf.
Immediate Targets can be around 2.68 - 2.70
& then around 3.
Bullish Divergence on Monthly TF.Bullish Divergence on Monthly TF.
Weekly Support seems to be around 30.
& Important Resistance is around 32-33.
Though a re-testing of breakout done. but
Important to Sustain 24.90
As of now, Stock is in sideways movement;
& it will be Bullish once it will cross 36.
A positive point is that there are multiple
bullish / hidden bullish divergences on
different time frames.

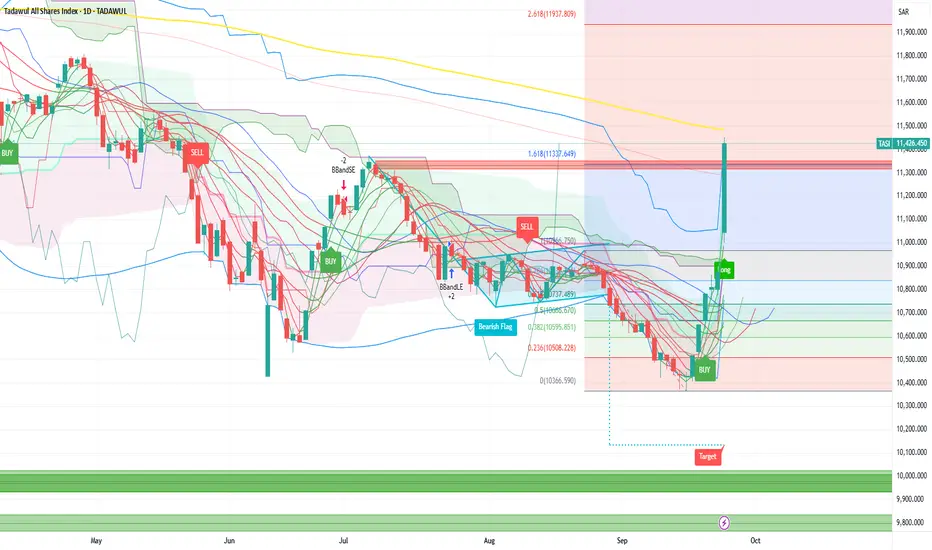
BUY TASIAnd yes, here is the opportunity y'all been waiting for, you can buy TASI now and set your levels as set on my chart!
This is one of the 7 trades I shared to my cients, you can follow so whenever I drop the others you can take them!

TASI Weekly Outlook – Bullish Play in Progress!📈 TASI Weekly Outlook – Bullish Play in Progress! 💥
After forming a solid base around the Monthly Type 2 Zone, TASI is showing bullish signs of accumulation. We're now watching a potential explosive move toward the Context Target at 12,895.754 🚀.
The current structure suggests a short-term pullback before continuation—ideal for bulls waiting for a clean entry. Eyes on the prize as we aim for higher highs. 🔥
🧠 By: Asif Brain Wave

SAUDI ARAMCO BASE OIL - Daily Chart (TADAWUL)SAUDI ARAMCO BASE OIL - Daily Chart (TADAWUL)
"After a long bearish phase, the market finally pauses to breathe. If the next bullish leg confirms, it will unlock the roadmap to higher targets. With strong conviction, I believe the 2025 low is already in place. Eyes on 107.4 first, then 111.8. Let price reveal the story.

4081 Naifat Finance (TADAWUL)📊 Trade Idea Overview – Weekly Timeframe
✅ Key Technical Levels:
Demand Zone: Clearly marked between 12.00 – 13.00, showing strong historical buyer interest.
Current Price: 13.38
Fibonacci Retracement Levels: Price is reacting near the 0.705 - 0.79 zone, which often acts as a bullish reversal area.
Target Price: 18.40 — Identified as Buy-Side Liquidity Zone (BSL) and a previous significant high.
Resistance Zone: Around 18.40, where liquidity is likely to get captured by smart money.
📌 Narrative & Market Context:
Price has shown a bullish reaction from the Demand Zone, indicating accumulation or potential bottom formation.
Fibonacci confluence with demand strengthens the bullish setup.
Once price breaks above 14.00, a bullish market structure shift will be confirmed.
The chart also visualizes a projected path toward 18.40, indicating a strong bullish impulse wave ahead.
📈 Expected Price Path (as shown in chart):
Minor pullback toward 13.00 area (retest demand / Fibonacci zone).
Breakout above 14.00 – a key structural shift.
Bullish continuation toward 18.40 Buy-Side Liquidity.
📍 Trading Plan Suggestion:
Entry Zone: Between 13.00 – 13.20 (ideal demand re-entry).
Stop Loss: Below 12.00 (invalidate demand structure).
Take Profit: 18.40
Risk-Reward Ratio: Excellent (Potentially 1:3+ R:R)

TASI IS PREPARING AN ENTRYAfter that TASI has taken the liquidity at 11,553, it just gave us an indication that it will start going bullish, no clean entry for now, but we'll keep waiting.
Meanwhile, my clients and I have taken other trades on 3 other stocks that are still in a safe zone, waiting for them to go higher so I can share them to the public.
As soon as I catch the entry and share it to my clients, I will share it to the public.
If you really care about taking clean entries, you must wait for the confirmation of the up movement then you can have a safe entry.
Follow for more!


@ Important Support LevelDouble Bottom Formation on Daily TF.
45.50 if Sustained on Weekly basis,
Next Targets can be around 47 initially.
It may test 41.90 - 42 again, prints a
double bottom on Shorter TF & then bounce.
However, 41.50 should not be broken.

TASI IS PREPARING A BULLISH MOVEMENTCouple days ago, I posted that TASI will come lower to 11,535.390, and here it is now on the level in which it will probably create us an entry to take to target higher levels.
Follow so you don't miss the future updates!

Bullish on 2382 ADES TASI Fake breakout on 1H and close daily above Monthly level (orange line)
Wait for retest and target 17.18 price level

Wait for retrace on 7020 MOBILY TASI Wait for retrace to test old high + Weekly FVG
Then looking for entry

Different Time FramesMonthly View:
Monthly Support is around 11200 - 11500
Important Resistance is around 12500 -12700
Weekly View:
Weekly Closing above 12000 is Important for
touching the Resistance of 12500 - 12700.
Daily View:
Hidden Bullish Divergence has appeared which
is a positive sign.
If the Selling Pressure continues, we may expect a
bounce back from 11500 - 11600. Otherwise
today's Closing above 11820 can be a Positive Sign.
