National Gas & Industrial Company - GASCO (2080)National Gas & Industrial Company, listed with ticker number 2080, is currently making waves in the Utilities sector as a Gas Distributor. With a current market price of 87.7 SAR and a robust market capitalization of 6.58B SAR, it stands out as a significant player in the market. The company’s financial indicators are promising, with a 9% growth in EPS and a 10% increase in sales quarter over quarter. Additionally, the stock enjoys a high degree of liquidity, with 82.42% of its shares available for trading.
From a technical analysis standpoint, the stock is forming a Volatility Contraction Pattern (VCP), which often signals a potential for price movement. The RSI is at 65.93, edging closer to the overbought threshold, while the MACD at 3.06 suggests a bullish momentum. The CCI at 117.87 further supports the overbought condition, indicating that while the stock has potential, traders should proceed with caution.
In light of the current market trends and the stock’s performance, the entry price is set at 88.5 SAR. To safeguard investments, a stop loss should be placed below the recent swing low or at a level that aligns with individual risk tolerance. The stock has shown a positive trend with a 28.97% increase since the start of the year, bolstered by solid financial performance and strategic agreements that could propel further growth.
In conclusion, National Gas & Industrial Company presents an intriguing opportunity for traders. The combination of financial stability, growth, and bullish technical indicators makes it a stock to watch. However, given the nearing overbought conditions, vigilance is advised. Traders should conduct their own research, stay updated on market trends, and employ risk management strategies to ensure the protection of their investments.
TASI

📈 TASI Share Technical Analysis 📉📈 TASI Share Technical Analysis 📉
🐂 Bullish Momentum:
The Tadawul All Share Index (TASI) is currently displaying signs of a potential bull run on the daily timeframe. The market sentiment appears to be favoring the bulls as the price action demonstrates a series of higher highs and higher lows, suggesting a sustained uptrend. 📈🐂
📊 Moving Averages:
Two important moving averages, the 50-day and the 200-day, play a significant role in assessing the market's direction. When the 50-day moving average crosses above the 200-day moving average (referred to as a Golden Cross), it's akin to a magical turning point in the market, indicating a robust bullish trend. This crossover reinforces the bullish case for TASI. 🪄📅
🌟 Choch Stands Alert:
The Choch (Stochastic Oscillator) is sending a rocket ship 🚀 signal, highlighting the potential for overbought conditions. However, it's essential to remember that in a strong bull market, overbought conditions can persist, and such signals may indicate the market's resilience rather than an impending reversal. 📈🚀
🤖 RSI in Play:
The Relative Strength Index (RSI) serves as a robotic 🤖 tool to gauge whether the market is overbought or oversold. At present, it hovers in the overbought territory, reinforcing the idea that buyers are in control. Nevertheless, it's important to acknowledge that during strong bullish trends, RSI can remain elevated for extended periods. 📈🤖
📅 Keep an Eye on News:
While technical analysis provides valuable insights, market movements are also influenced by external factors. Staying informed about 📰 news, economic events, and geopolitical developments is crucial. These fundamentals can either complement or challenge the technical signals. 📊🌐
📈 Final Thoughts:
While the TASI appears to be in the early stages of a bull run, it's paramount to exercise prudence and risk management. Technical analysis is a valuable tool, but market behavior can be unpredictable. Diversification and risk management are essential components of any investment strategy. 🧐🌟💼
Investors should be aware that all investments carry inherent risks, and it's wise to seek guidance from a qualified financial advisor for personalized advice and tailored strategies. 🤝💰📈 #InvestWisely

Tasi Daily Analysis Here the Tasi daily analysis we have good area for buying opportunity the trend is bullish and the targets are clear to see , Enjoy


AMRICANA RESTURANTHey traders, here is the analysi.
If you guys like my analysis please hit like👍 and follow.
Thanks.
DISCLAIMER- This is not financial advice.
SMART MONEY CONCEPT

🚀 TASI surge 24% in 2023: Decoding the next move in 2024.Tadawul All Share Index (TADAWUL:TASI)
1) In the day chart we noticed that the Tadawul All Share Index has formed a head and shoulder pattern from April 2023 - September 2023 and a obvious neckline breakout marks the end of the H&S pattern.
2) At the end of H&S pattern we noticed a big red candle closed at 50% into the body of the previous green candle. This is a trend reversal sign known as Dark Cloud candles.
3) Since the August 2023 a sharp down trend consist with mostly the red candles. It signifies strong bearish momentum. TASI had fallen from 11933 to 10262, nearly 14% correction in a span of just 12 weeks.
4) We noticed the bullish flag pattern started forming since mid Nov 2023, where two parallel trendlines preceded by a flag pole which clearly indicates strong bull's presence in the index.
5) Dec 2023 onwards TASI started moving straight upward after flag pattern breakout and again forming a bullish flag pattern. Such back to back flag breakouts give prominent signal of long bullish run to be continue.
Happy Trading!
Cheers to this bull run!

SAUDI REINSURANCE CO. 8200 - Bearish SignsShow some week signs:
1- Monthly resistance at 20.36 which was near a target in previous trade.
2- wait to see in 20 - 20.36 if bearish candle appear.
price will back to these targets
TP1: 18.98
TP2: 200 moving average
if 200ma not hold will not surprise if price to back to 17 or 15

HALWANI BROS. CO. 6001 - Bullish Pullback to 200 Daily MAbullish pullback opportunity towards the 200-day moving average. Several strong indicators support this potential upward movement:
RSI Value Near 50: The Relative Strength Index (RSI) is hovering close to the neutral 50 level, suggesting a balanced market sentiment and potential for upward momentum.
Support Holding at 48.5 Level: The stock has demonstrated resilience by holding a crucial support level at 48.5, indicating buyer interest and a potential bounce.
As the price retraces, there's an opportunity for a second entry around the 48.5 level.
Target Levels:
Take Profit 1 (TP1): 53.2 level or 200 moving average

TASI to target 13930Weekly chart, the Saudi TASI index has formed a chart pattern W and V, then the target is 13930
Expected time frame 3rd Q 2024
Technical indicator MACD is positive; RSI is near over-bought zone.
For the long term, monthly chart, there is a probable target at 18100
Good Luck for the Saudi Market :)

Tasi - Bullish Signs Show some good signs:
1- 200 moving average breakout
2- level 11159.5 break
If price continue up move
target will be:
TP1: 11933 level

2382ADES is ready to archives the target 23.36 in to several days
it's importins don't trade below the 18.32

Tasi - FINANCIAL SERVICES INDEX - Bearish SignsShow some weak signs:
1- Resisstence level at 6590
2- 200 Moving average resistance
if price can't break resistance
target will be:
TP1: 6200 level

Tasi - CONSUMER SVC INDEX - Bearish Signs Show some weak signs:
1- Double top
2- Traingle after strong down move
There is no sign yet for price to go up RSI under 50 and RSI MA, if price continue down
target will be:
TP1: 200 MA
TP2: 4257 level

Tasi - Correction Signs Show some weak signs:
1- Break VAWAP
2- Bearish Divergence
back to retest 200 Ma or deep correction to 10504
target will be:
TP1: 11159
TP2: Daily 200MA

ABDULMOHSEN ALHOKAIR 1820 - Bullish Signs Show some good signs:
1- First 200 MA retest
2- 2.07 support turn to resistance with good bullish candle
If price continue up
target will be:
TP1: 2.19 level
TP2: Daily 200 MA

HALWANI BROS. CO. 6001 - Bullish Signs Show some good signs:
1- Bullish H&S
2- Retest VAWAP
If price continue up move
target will be:
TP1: 52 level
TP2: Daily 200 MA
TP3: Weekly 200 MA (pink line)

long for long time, TASI. The main stock market index in Saudi Arabia (TASI) increased 604 points or 5.76% since the beginning of 2023, according to trading on a contract for difference (CFD) that tracks this benchmark index from Saudi Arabia.

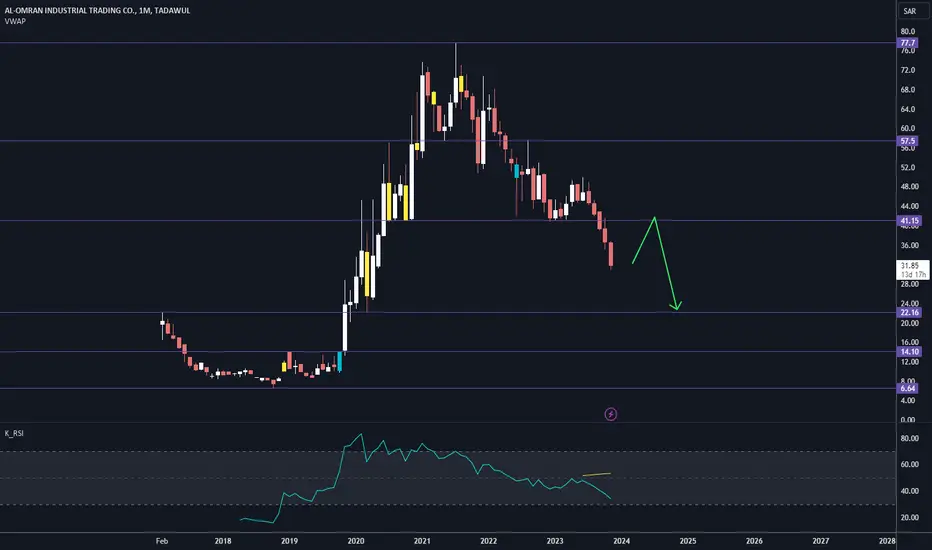
AL-OMRAN INDUSTRIAL TRADING CO. - Bearish Signs Show some weak signs:
1- Strong down move
2- Break strong support
If support turn to resistance
target will be:
TP1: 22 level
4013: Watchout for trendline Breakout4013 has been in correction after making ATH.
A significant support (Ascending trendline) was broken in recent past for the first time.
After completion of Harmonic Pattern, Double Bottom formation, a short upside move is observed (formation of HH, HL).
However, ascending trendline will be acting as resistance now.
Although, breakout of trendline was observed during the recent bullish trend, but couldn't sustain.
Wathout for breakout of ascending trendline resistance for long entry.
Trade with SL

7203_Breakout (Bullish)7203 has been in bearish trend (correction) for a while after making All Time High.
Formation of LL, LH respecting a descending trendline resistance (Triangle Top)
Recently has made a double Bottom confluenced with Golden Pocket, Good Support Level.
Breakout of Descending Trendline is observed for first time in a while.
After retest, trendline is respected (acting as support).
Long position above horizontal resistance line can be taken (confirmation after formation of HH)
Bullish trend will be confirmed after formation of HL
Trade with SL

TASI_ Wait for Support BreakoutTASI has been in correction for a while
A trendline breakout is observed recently (with Formation of HH) which gave a short positive upside movement.
Formation of HL in progress
11,000 is a significant resistance line
Bulls need to break the resistance line for upside movement.
Watch for individual stocks for proper entry


TASI has a promising opportunity Dear supporters
I got a lot of request to analyze the Saudi Index TASI, here we are.
most of the stocks now at the accumulations phase and I see a very good investments and trading opportunity.
good luck every one
