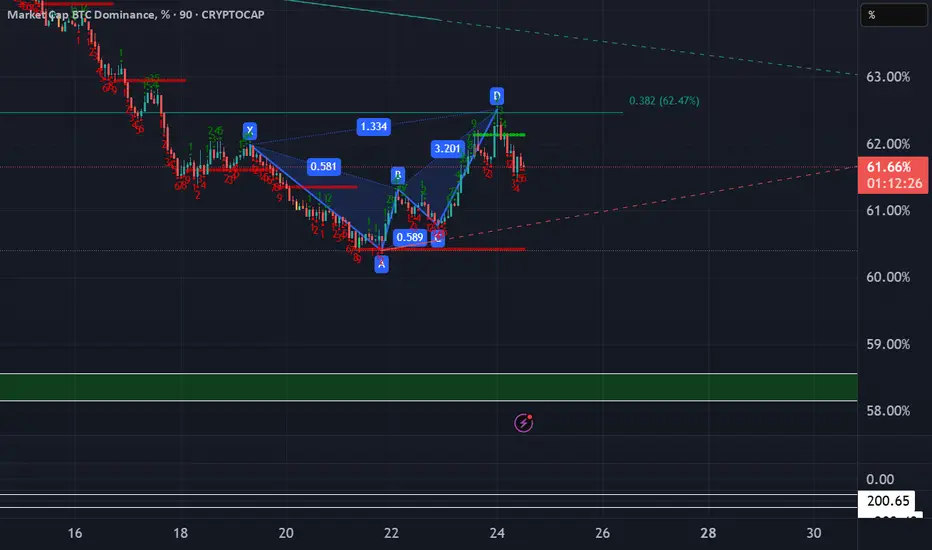
BTC Dominance continues downward Despite the recent aggressive fall in BTC Dominance, we still see a path down towards 58%. This ratio, which is determined by dividing the total value of the cryptocurrency market by the market value of Bitcoin, can help us understand where the market will go.
Tdsequential
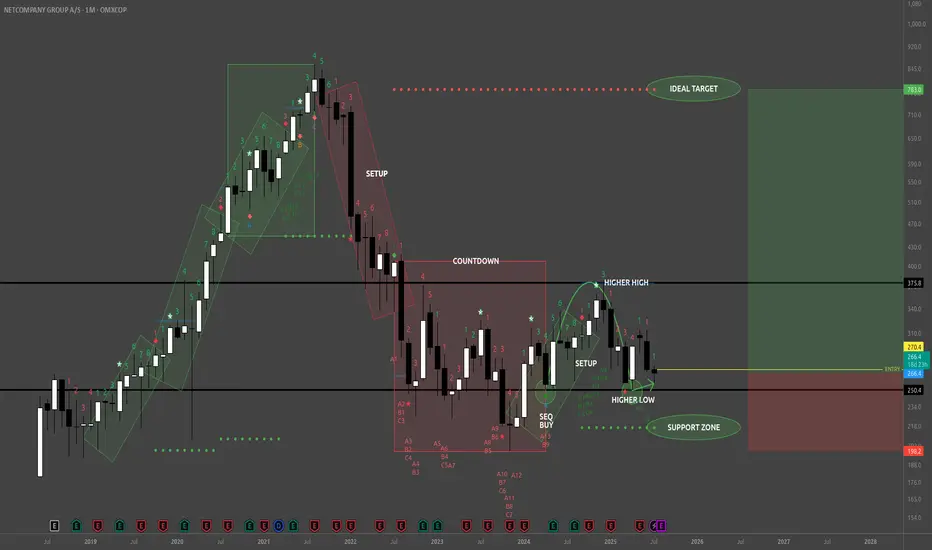
NETC - BuyReading the NETC Monthly chart from the left to right look at that remarkably strong bullish trend (green rotated rectangles) which spanned 3 consecutive TD 1-9 Setups. That's 9 strong months of uptrend culminating in the beginning of the bearish trend with a TD Sequential 13 Sell signal at the apex, a Bearish Engulfing Pattern, and a large Doji immediately preceding the TD 1-9 Setup (red rotated rectangle) which exhausted the downward momentum, and dissipated the downward momentum with the TD Sequential 13 Buy signal (first green circle).
From the TD 13 Buy signal (first green circle) buyers created a higher high, followed by 4 consecutive red TD counts, whose bearish implications were disrupted by the strong Bull Sash pattern. I really like this spot for opening a long position. One caveat is that the Weekly TD Buy Setup is on 7/9 so the next two weeks could bring the price lower, potentially even tapping the TDST support zone, but whether that happens or not look left on the chart everywhere from my entry price and below. This is all wholesale pricing territory!
TDST up at 783 is a nice upside target just shy of the ATH traders will be gunning for.
Now on fundamentals here's where things are really nice. NETC just bought themselves the Danish IT banking company SDC (for 1 Billion DKK) which serves about 100 Nordic banks. That's going to be bringing in sticky, recurring revenues in a critical financial sector. NETC revenues are also not materially tied to the U.S., and doesn't rely on American consumer sentiment, regulatory policy, or supply chains.
Whether price falls from here or not I'm holding on to my shares until this pays off big. Maybe this is a trade for your trading temperament too.
Combined US Indexes - Time to make a Lower HighFrom the last time, the Combined US equity indexes did keep into the Extension Zone (EZ) as marked out. This Zone is defined from the lowest point of the TD Setup and the range is determined by the range of the candle that has the lowest point, this case being Candle 9 (4 March).
So after the expected two week in the EZ, we see an indication of the week ahead to continue the Sell Setup and break out of the EZ for the week, at least from mid-week where it would be candle 9.
According to TD rules, this Sell setup is NOT bullish, and can be expected to turn further down from resistance (Orange Line). This orange line is determined from the weekly chart where there is an ongoing TD Buy Setup (bearish) that needs to be kept intact for the trend to continue.
So, based on the techincals, the combined US equities may be seeing a last week of bullishness which goes through the yellow ellipse, then face strong resistance and continue the main Bearish trend (as depicted by the prevailing Buy Setup (20Feb to 4Mar). Noted that the main trend changed to Bear once the TDST was broken down on 3Mar.
Here are very good live examples for those keen on (Thomas) Demark indicators; watch and wait for it to develop...

IOTA’s 3-Year Downtrend Nearing Exhaustion – 20x+ Incoming?IOTA has been in a brutal downtrend since January 2022, but the TD Sequential is about to print a Red 13 on the monthly chart, suggesting this 3-year cycle is nearing exhaustion.
Price action has already broken above the long-term trendline (since April 2021), retraced, and now looks to be bouncing off it—textbook confirmation that the macro structure is shifting.
Let’s not forget that crypto tends to go parabolic in election years. If history repeats, IOTA could be one of the biggest gainers, targeting at least 20x—if not much more.
What I’m Watching to Enter:
✔️ Feb candle closes below $0.27 → Confirms TD13 prints, and
✔️ Confirmation of a bounce, which could come from:
Feb closing around $0.25 (above the 21 EMA), or
A weekly close above $0.26 (above the 21, 50 & 100 EMA), or
Breaking the 3-month downward trendline (since Dec), confirmed by price action above $0.27 in March (and no sooner).
Could IOTA be one of the biggest comeback stories of this cycle?
P.S.I’d also like to see fundamental justification for growth beyond the technicals. Can anyone speak to IOTA’s fundamentals?
Is the tech still relevant and competitive?
Is it being applied in real life?
Any recent partnerships suggesting IOTA has a place in the future?
P.P.S. Dash is also looking to print a TD13 in the coming months, but it looks like IOTA will move first. Dash chart incoming.

SPX500USD M15 Not Perfected SetupSpoken about the not Perfected Setup… where the highest of the sixth and seventh candle It’s not superseded by the highest of the eighth or ninth candle.
So you can expect that in the next 3 to 5 candles, the Setup high (Also, the highest of the sixth or seventh candle) should be superseded before retracement proper.
They noted in this chart that the purple box should be broken into and above.
Let’s watch the demonstration…

S&P 500 Attempt to Test Previous HighThe Monthly S&P is overbought and at a 9 TD Sequential Sell signal, that is why the market pulled back. The Daily after the pullback has found buyers at previous breakout resistance turned support (Change of Polarity). The Weekly has relieved the overbought condition and I believe this is the point where bulls will see if they can continue the bull market. On the Daily chart I show something like a 5-8% profit potential to the next Falling
Window resistance area and high. The Daily TD Sequential has a green 2>1 allowing for a new long position. This is happening on a breakout of the Falling Window resistance. The 39 minute chart (10 Daily candles on U.S. stock market) shows a close above EMA 200 followed by the previous candle closing above the Window resistance. You can use this to open a new long position with a stop loss below the low of the window.

CCCS - BuyI used TradingView's stock screener to find assets with ADX (14) crossing up 15 on Weekly charts and came upon this CCCS. All of this analysis is based on a Weekly chart. First and foremost this is the first time that ADX is crossing up 15 in the chart's history. Secondly, TD Sequential is on 8/9 of a Buy signal. Third, it's at the bottom of the Bollinger Band. Fourthly, it's at Fibonacci Pivots S2. Lastly, this exact spot is a convergence of several Fibonacci support levels. This looks like the bottom of a coming up trend.
38.20% pullback into Monthly Fibonacci Pivots S2:
38.20% pullback:
127.20% extension support:
Uptrend neared 2.618% extension:
ADX crossing up 15 first time in stock's history:
Bollinger Band lower band:

End of Microsoft Bull Run ReachedFrom Left to Right:
1. Horizontal Resistance off of Doji High.
2. Price falls to 200 EMA.
3. Trend-Based Fib Extension is drawn from Bullish Engulfing Pattern Low at 200 EMA to Doji High (confirming previous Doji resistance), and finally down to Bullish Engulfing Pattern.
4. Price broke out of the $340 horizontal resistance and hit Yearly Fibonacci Pivots targets R1 & R2.
5. Trend-Based Fib Extension targets 0.786 & 0.886 reached.
6. Monthly Fib Pivots targets R1 & R2 reached.
7. TD Sequential 9 Sell Signal.

LINK Potential IH&S, High Confluence, $26 Target 1, $32 Target 2🎯 TL;DR Potential IH&S + W3 Target: $26; W3 Target 2: $32; High Confluence
📈 With the recent dip to $15.3, BITGET:LINKUSDT might be forming an Inverted Head & Shoulders (IH&S) pattern with a $26 target.
The 50VWMA is acting as support in this area, and TD Sequential printed a Perfect Buy Setup (red M9) yesterday, offering additional confluence.
This retracement is also 61.8% of the previous leg up, setting a potential Wave 3 Target 1 also at $26, and a potential Wave 3 Target 2 at $32.
✅ Confirmation would be a daily close above the neckline at $19.3.
For a safer entry, wait for a daily close above $20, which is a previous resistance, a High Volume Node (HVN) and a key psychological level.
Keep an eye on $22.9 as it previously triggered a rejection.
❌ Invalidation would be a daily close below $15.3, and it would likely lead back to trading in a rectangle between $12.8 and $19.2.
If you have any questions about the TA, feel free to ask. I am always more than happy to share and discuss charts.
Not Financial Advice

NASDAQ - Bounce and Lower Low incoming this weekJust a quick demonstration...
Accouding to the TD Setup rules, a normally perfected TD Buy Setup would see the lowest point of the 8th and 9th candle be lower than the lowest point of the 6th and 7th candle. This to say, if it is normally projectable, then there would be a Lower Low point less than 17113 over the next three days, if not another three days after that (likely, this week).
So, the red box should be pierced through.
Watch for it...

4 hour 9 and trendline resistance As long as Btc etf outflow remains negative we are now in a down trend. I wouldn't be suprised if doge crashed to 6 cents again...

Doge 12hIf doge can still appreciate in value then anything is truely possible. 9 on the 12h and stoch at high. Also a sell the news event is very close.

CFX - 🚩 Flying High: Unveiling the Bullish Flag Formation 📈🚀On the weekly chart, CFX displays a promising bull flag formation. In the long term, it resembles a head and shoulders pattern around 0.09, with a favorable risk-reward profile. There are two resistance ladders on KDJ and Fisher indicators that need to be surpassed. The projected path is shown in black. The bull flag setup remains intact, even potentially retracing to the 0.07c area.
PS Notice the green highlights on indicators.

Conspiracy or Real Move for BTC )?Quick Market outlook.
Here is another my idea about bright Future of BTC.
Covering it up from correlation with VIX, TD sequential Indicator and finally with Monthly pivots.

$KWEB beautiful Demark signalsI love how beautiful and elegant the TD Sequential has been working on $KWEB. I am looking for a 9 buy to add to my $KWEB positions and some Vietnamese stocks as well.

BITCOIN: $236.193 Month MA 3/12 Dead Cross:
TD SEQUENTIAL Buy Setup projected January 01 2024. Target TDST Support: $236.19
61.80% Fibonacci retracement from Bitcoin at $0.00 to ATH altings exactly with TDST support:
So what’s the plan? Play the short game all of 2023, and get in now before the action starts!

DK: 200ema supportDK (Delek US holdings)
Nice risk reward here on $DK for a swing long. A few reasons I like it:
-with T D sequential reversal 9 daily ,
- support of 200ema,
-and RSI at the lows.
I will wait until the end of the trading session today and see where it goes before entering a small swing.
Trade safe.

Nasdaq Weekly & Monthly downtrend exhaustingTLDLR: Weekly and monthly sellers likely exhausted. I am holding or opening longs.
The TD sequential is a nifty indicator that helps you know when a sell off has gone on long enough for a particular time frame. Getting a bearish 9 is a fair sign of exhaustion. The Nasdaq having a weekly and monthly 9 flashing currently is a sign I take very seriously that thinks are going to be moving to the upside for US equities and select "OG" crypto currencies.
The S&P chart likewise shows how very rare 9s are on the weekly or monthly time frame. I am sympathetic to the idea that people are concerned that we might have a "dot com" type bust but I don't see that in the cards yet. I think we are more likely to see QQQ double top or set a higher high than a bull trap.
I could be wrong. Risk management is still a thing. But I remain convinced the highest probability move is bitcion has a 2014-15 style consolidation and then a massive bull run and many alts will be blowing off their tops in 3-4 years.
My linked ideas show why I am bullish with a bit more detail.

Here is the deal with the USD...UP... within the next three weeks.
First, it has completed the Cup & Handle pattern, a very reliable pattern. Now on the breakout and the projection is mapped (dotted aroow line).
Second, technical indicators of the MACD are bullish, and continue to support an uptrend. There is no bearish divergence observed.
Third, the other set of technical indicators for money flow, and volume are also supporting the continued upside, with no indication of bearish divergence.
Finally, the weekly TD Sequential Sell Setup just completed (green box with black background), with a small kink... that the 8th and 9th candle highs are not higher than the 7th candle high. According to TD Sequential rules, we can expect that at some point in the next three candles (or so), the 7th candle high would be taken out and exceeded in an attempt to Perfect the TD Sequential Sell Setup.
So... expect the USD to end up in the range around the white ellipse.
Perhaps then we might see some real signs of the USD abating its bull run?
Note that with a massive bull run on the USD, markets are being affected badly, and money flow is unusually into the USD (exiting most other markets). Furthermore, the longer this stretches, the worse the unwinding becomes with commodities when the USD retraces. It is like an overstretched rubber band, and its dicey before we know who would release it first... the tension followed by the release of that tension. Oof...

Bitcoin Monthly bottom pattern Bitcoin its about to print a buy signal using Tdsequential in the monthly heikin-ashi chart
Not financial Advice

Glove’s Index volume info graphic comprised of 4kings. 3/Oct/22This chart shown the average price ( index) of 4 major gloves manufacturers in the world which are Topglove, Hartalega, Kossan and Supermx where they “contribute “ almost half of the world’s gloves market. As said trend is our friends but without “volume” in stock market there is no trend. The “shifting” polarity of bull trend to bear trend all cause by “panic” buying ( climax)/ selling Climax probably due to FOMO ( fear of missing out) in uptrend and “fear of losing” ..due “borrowed money” which cause “margin call” in downtrend..

SPY can't get it up...Just a quick pre-weekend analysis and update about the SPY.
Previously, it looked like the SPY was about to do a technial bounce, but the week panned out to be more fear overwhelming than anything else. The MACD is not divergent, so any bounce can be expected to be shallow; just like Wednesday's bounce, and not following through the next day. It appears a little oversold, and at support cross-roads. With the bearish Buy Setup in force indicating a bearish primary trend, a bounce of some sort is still in the cards. So we play the bull and bear case scenario again.
(Slight) Bull case sees a mild rally to about 380 (most likely, as it meets a set of resistances) or perhaps stretch to 390, where should start to stall and turn down again. The TD Seq Sell Setup should start with a TD Flip, then proceed to build but not likely to change the primary trend by exceeding 403. In fact, it might even truncate. If this scenario happens, it would take us to almost mid-October, and the rest of October might be pretty bearish to reach the projected downside target(s), 305 and 330, which have been readjusted for time.
The bear case here is a consolidation around 370 and then most of October fall off the cliff type of bear market to 350, then to 330.
The slight bull case appears more probable at this point with a favourable 70/30 skew. But whichever way, it is in the middle of a bear trend and it is not quite over.
For now, I'd be watching the next week or two to see how this pans out...
PS. So far, the projected lines (based on the symmetrical HH and LL pattern) is still robust and uncanny, which was posted on Aug 3.

