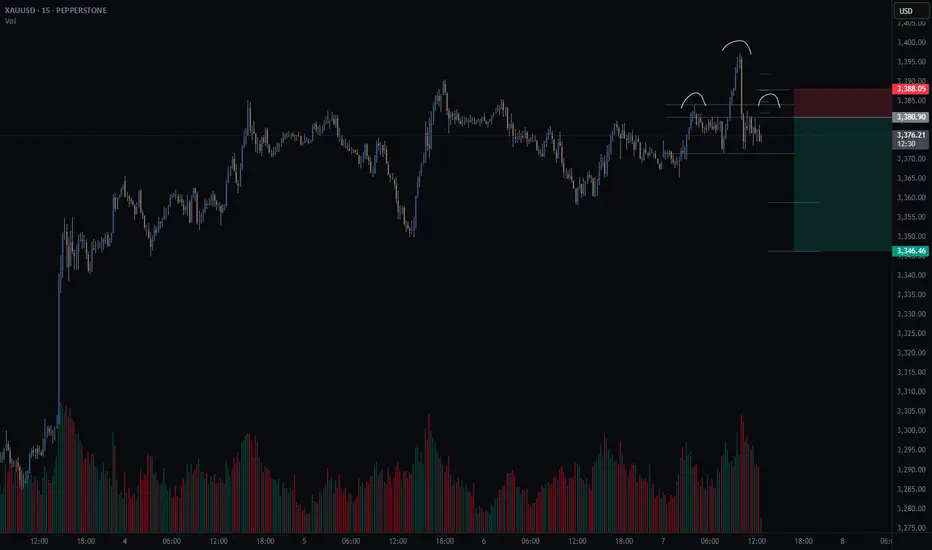
Gold short – Head and Shoulders Setting Up on 15min?There’s a potential head and shoulders pattern forming on the 15-minute chart.
📌 What I’m watching for:
A 15min candle close back inside the neckline range
Lower volume on the right shoulder vs. the left (to confirm weakening momentum)
🧠 Trade Idea (Short bias)
🎯 Entry: 3380.9
❌ Stop Loss: 3388.0
✅ Take Profit 1 (50%): 3358.9
✅ Take Profit 2 (50%): 3346.3
⚖️ Risk/Reward: 3.8R
This setup lines up with my trading method that focuses on structure, volume, and clean risk/reward.
🤔 What are your thoughts on gold today?
Are we about to roll over — or will bulls push through resistance?
Techincalanalysis
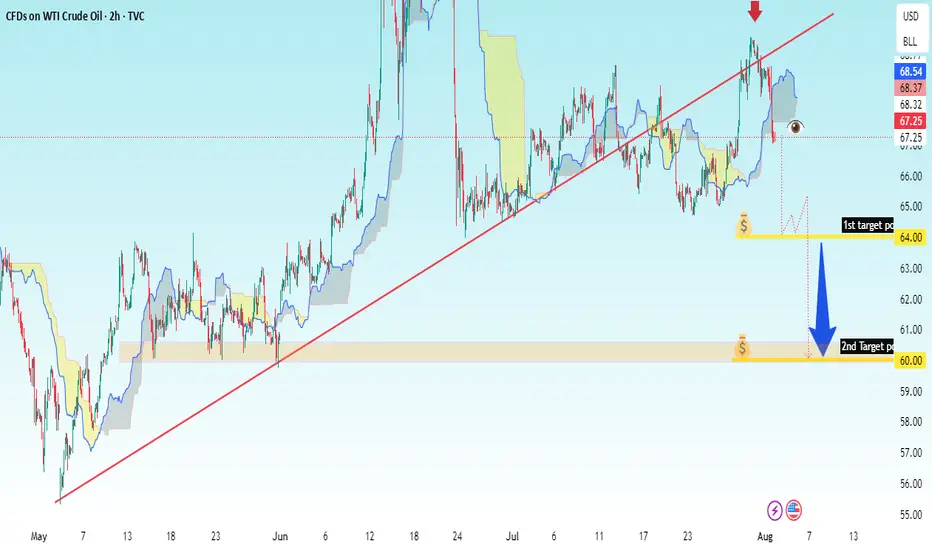
USOIL 2H – Trendline Break Sell Setup✅ Key Observations:
1. Chart Type: Candlestick chart (2h interval).
2. Trend Line: An uptrend line (red) is drawn, now broken to the downside.
3. Ichimoku Cloud: Price has broken below the Ichimoku cloud, signaling potential bearish momentum.
4. Red Arrow: Indicates a potential short entry point where price broke below the trendline.
5. Downside Targets:
1st Target Point: $64.00
2nd Target Point: $60.00
6. Bearish Projection: A large blue arrow pointing downward from the breakdown level implies a strong sell setup.
---
🎯 Your Trade Setup (based on chart):
Entry (Sell): Around $67.25–$67.50
Stop Loss: Above recent high or Ichimoku resistance, approx $68.70
Target 1: $64.00
Target 2: $60.00
Risk-Reward Ratio: Favorable, around 1:2.5 or better depending on entry
GBPUSD LONGCheck comment for the proper multi-timeframe layout due to TradingViews publishing restriction
MT5 screenshot also attached.
Still moving in line with the bullish bias I shared in Monday’s post.
Things may shift eventually, but for now — we ride it.
4H supply in control, aligned with weekly demand. 5M demand held strong.
Waited for price to return to the mapped zone, dropped to 15s for execution.
Tapped out after 3RR achieved — not more, not less.
Same system. Same pair. Different day.

AUD eyes yield advantage over USD UBS strategists view the Australian dollar as a compelling long opportunity at current levels, supported by expectations that the Reserve Bank of Australia will ease policy more gradually than the U.S. Federal Reserve.
The bank forecasts 75 basis points of rate cuts from the RBA through Q1 2026, compared to 100 basis points from the Fed—helping to preserve a relative yield advantage for the Aussie.
On the daily chart, AUD/USD remains within a well-defined ascending channel that began in late 2024. The pair recently bounced off the lower boundary of the channel near 0.6450, with long lower wicks potentially indicating dip-buying interest.
Immediate resistance could sit at 0.6600, followed by a major zone near 0.6670. A break above these levels could confirm bullish continuation.

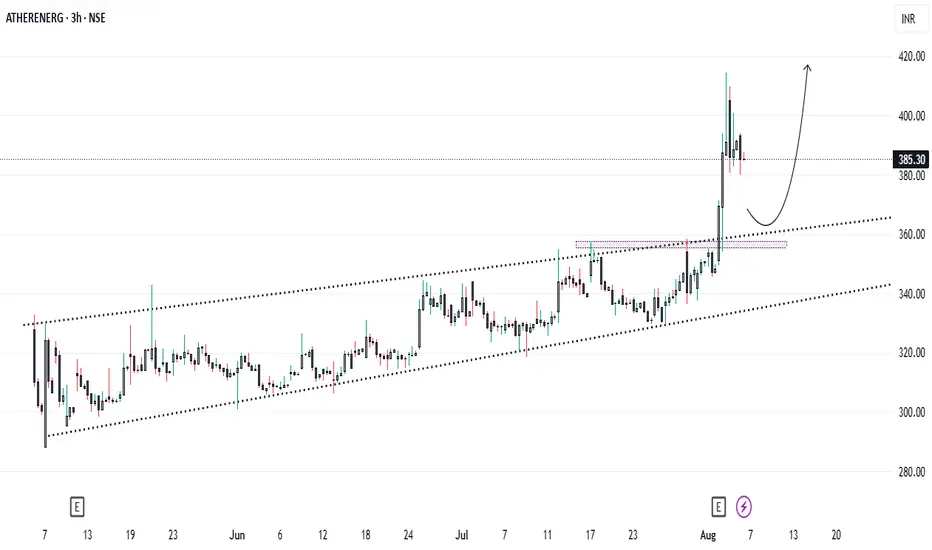
Ather Energy Breaks Out! What's Fueling the 13% Surge..?Since its stock market debut, Ather Energy had been gliding within a smooth upward channel until something major shifted this week. On the back of stellar Q1 FY26 results, the stock did something bold:
✅ Broke the channel
✅ Shot up 13% in a single day
✅ Hit a fresh 52-week high near ₹394
So, what’s driving this electric rally? And more importantly, what’s the next smart move for investors ?
🔍 Q1 Results: Narrower Loss, Explosive Growth
On August 4, 2025, Ather Energy dropped its first earnings report post-listing, and the numbers turned heads:
* 📉 Net loss trimmed to ₹178.2 crore (vs. ₹182.9 crore YoY)
* 🚀 Revenue surged 79% YoY to ₹645 crore
* 🔋 Vehicle sales jumped 97% YoY to 46,078 units
* 🛵 Family scooter “Rizta” became a hit, now 60% of total sales!
Management also highlighted better cost control, improved operating efficiency, and a margin boost of nearly 1,700 basis points YoY — a sign the business is scaling fast without burning as much cash.
📈 Chart Talk: Breakout Confirmed, Entry at ₹357 ?
Technically speaking, Ather had been moving in a classic ascending channel since its listing. But the Q1 numbers triggered a powerful breakout:
* ✅ Channel resistance broken
* ✅ Huge bullish volume
* ✅ Momentum carried the stock to ₹394 intraday
Now, for those waiting on the sidelines, the ideal entry opportunity could come around ₹357, where:
* The previous resistance could act as new support
* It aligns with 38–50% Fibonacci retracement
* A healthy pullback may offer a low-risk, high-reward setup
📊 Analyst View & Expansion Strategy
* 🏬 **95 new experience centers opened in Q1
* 🌍 Market share expanded to 14% pan-India, 22% in South India
* 🏦 HSBC initiated coverage with a ‘Buy’ rating and ₹450 target
Even amidst tough EV competition (Ola Electric, TVS, Bajaj), Ather is building a tech-driven moat with strong brand equity, energy-efficient performance, and now promising financials.
⚠️ What to Watch Out For
* 🔧 A temporary rare-earth supply disruption due to China’s export policy — management says risk is under control.
* 🧾 Still **not profitable, so long-term earnings trajectory needs close tracking.
* 🔋 EV sector competition remains fierce; execution will be key.
📌 Final Word: Wait for the Dip ?
Ather’s breakout is backed by both strong fundamentals and a bullish technical setup. If the stock pulls back to the ₹357 zone, it could present an excellent opportunity for those who missed the initial run.
📍Plan:
* ✅ Add to watchlist
* 🔁 Wait for pullback
* 🛑 Stop-loss below ₹340 (if entering at ₹357)
* 🎯 Short-term targets: ₹394 (previous high), ₹420+, ₹450 (HSBC target)
Ather is charging ahead. Are you ready to plug in ?⚡
NZD/JPY BEARS ARE STRONG HERE|SHORT
Hello, Friends!
Previous week’s green candle means that for us the NZD/JPY pair is in the uptrend. And the current movement leg was also up but the resistance line will be hit soon and upper BB band proximity will signal an overbought condition so we will go for a counter-trend short trade with the target being at 88.302.
Disclosure: I am part of Trade Nation's Influencer program and receive a monthly fee for using their TradingView charts in my analysis.
✅LIKE AND COMMENT MY IDEAS✅

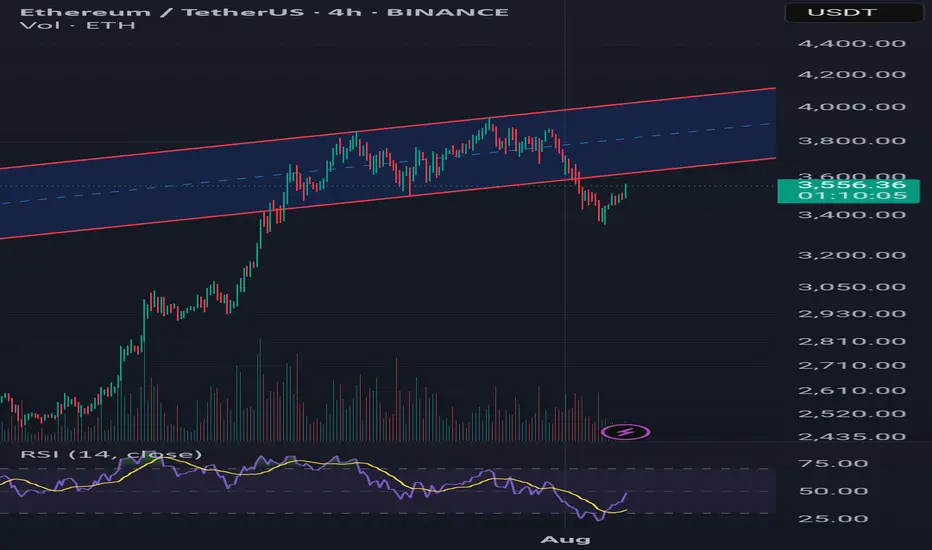
Ethereum at Critical Retest – Pullback or Breakout?Ethereum saw a sharp rally followed by a steady climb inside a rising channel. Recently, price broke below the channel’s lower boundary, signaling potential weakness. Now, ETH is retesting the broken trendline, which could be a classic pullback scenario.
Scenario 1 – Bearish Continuation:
If ETH fails to reclaim the channel and rejects around $3,600–$3,650, selling pressure may return.
Potential targets: $3,400 → $3,250 and, in extension, $3,050.
RSI is recovering from oversold levels but still below midline, hinting at possible limited upside before another drop.
Scenario 2 – Bullish Reclaim:
A daily close above $3,650 with strong volume would invalidate the breakdown and suggest a false break.
In that case, ETH could re-enter the channel and aim for $3,850 and the upper boundary near $4,050.
Risk Management:
Bearish entry: Wait for rejection candle on retest → SL above $3,700.
Bullish entry: Wait for confirmed breakout above $3,650 with volume → SL below $3,550.
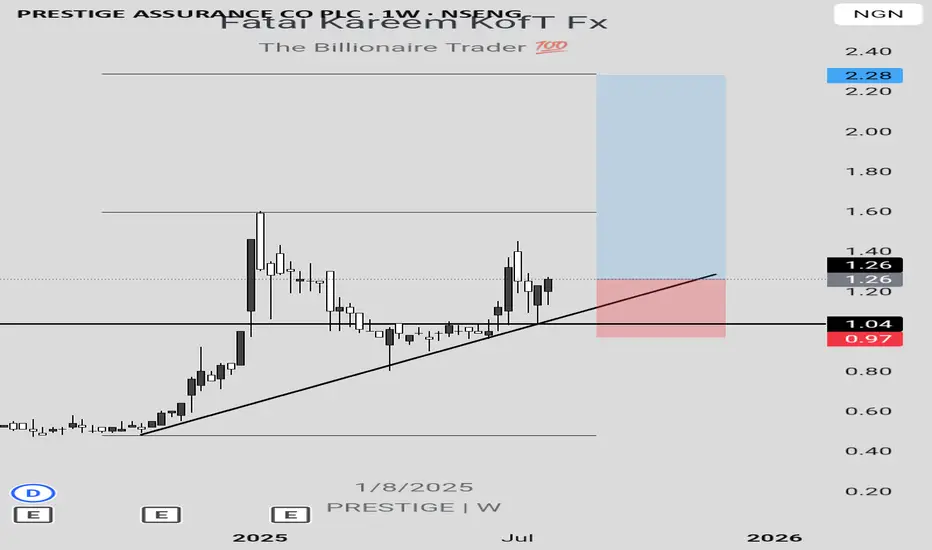
PRESTIGE LONG IDEA PRESTIGE stock has presented a long opportunity after coming from a support level and trendline. The 2 bullish weekly candles are strong indications that buyers are willing to push price higher. To take advantage of this long opportunity, one can buy at the current market price. The first target is N1.59 (26.19%) while the final target is N2.28 (80.95%) based on 1.618 Fibonacci level. The stop can be at N0.97 below the support level and trendline.
Confluences for the long idea:
1. Strongly buying momentum
2. Support level
3. Trendline
4. Bullish market structure
Disclaimer: This is not a financial advice. The outcome maybe different from the projection. Don't take the signal if you're not willing to accept the risk.
GBP/USD 4H Chart – Head and Shoulders Breakdown with Bearish Currency Pair: GBP/USD (British Pound vs US Dollar)
Timeframe: 4-Hour (4H)
Platform: TradingView
---
🔍 Pattern Identified:
Head and Shoulders Pattern
Left Shoulder, Head, and Right Shoulder are marked.
The neckline is broken, confirming a bearish trend reversal.
The trendline from March to June was also broken, supporting a downtrend.
---
📍 Current Price (at screenshot time):
Around 1.32778
---
🎯 Sell Setup – Target Levels:
🔻 First Target:
Price: 1.30072
Labelled: "1st TARGET POINT"
This is a near-term support level or conservative projection of the Head and Shoulders move.
🔻 Second Target:
Price: 1.28023
Labelled: "2nd TARGET POINT"
This is a deeper target, likely the full measured move of the pattern.
---
📈 Entry & Risk Management:
Suggested Sell Entry Zone: Around 1.32778
Stop-Loss (SL): Consider placing above the Right Shoulder area (around 1.3350–1.3380)
Take-Profit (TP):
TP1: 1.30072
TP2: 1.2802

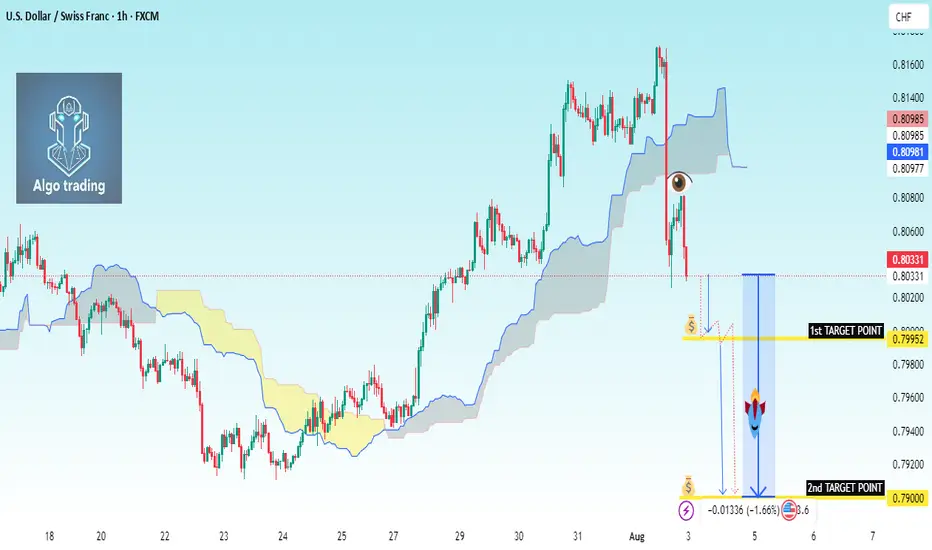
Sell Setup – USD/CHF (1H Timeframe)Chart Summary (1H – USD/CHF)
The pair was bullish, then got sharply rejected near 0.8100.
Price is now inside the Ichimoku Cloud, which means indecision.
Bearish signs:
Price failing to push back above cloud
Chikou Span (lagging line) is heading below candles
Flat Kijun-sen + bearish twist forming in the cloud
---
🔻 Sell Setup (Only Sell Focus)
📍 Sell Entry
Entry price: 0.7990
Reason: Break below Ichimoku cloud base and recent structure support
Confirmation of bearish move starting
🛑 Stop Loss
SL: 0.8055
Above the Kijun-sen and recent minor high
Protects against false breakdowns
🎯 Take Profit
TP1: 0.7950 – First nearby support
TP2: 0.7900 – Strong previous support area
---
📊 Trade Plan Summary
Component Price
Sell Entry 0.7990
Stop Loss 0.8055
Take Profit 1 0.7950
Take Profit 2 0.7900
---
✅ Entry Confirmation Checklist
Before entering the trade, confirm these:
❗ 1H candle closes below 0.7990
📉 Bearish candle shape (strong body, not a doji)
🟡 Chikou Span below price
☁ Cloud is red (future kumo bearish twisd
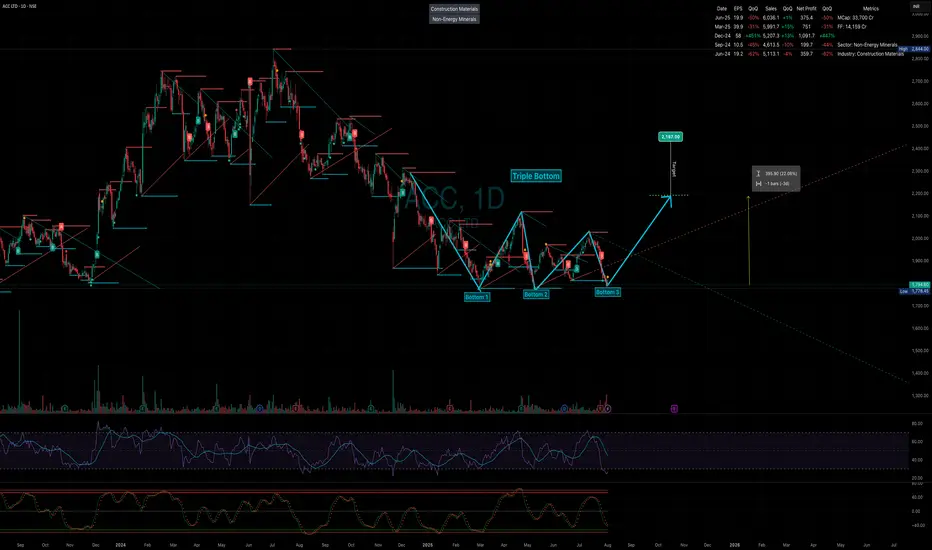
ACC Ltd. – Triple Bottom Pattern | Swing Trade Setup
ACC Ltd. is currently showing a Triple Bottom formation on the weekly chart, indicating strong support around the ₹1810 - ₹1793 level . This pattern suggests that bearish pressure is weakening and a potential reversal is on the cards.
🔍 Key Technical Highlights:
Triple Bottom: The stock has tested the same support zone three times without breaking down, which is a classic bullish reversal signal.
Price Action: Current price is near the support base, offering a favorable risk-reward entry zone.
RSI: Weekly RSI shows signs of reverse sell divergence, hinting at a potential shift in momentum.
📈 Strategy:
This is a swing trading idea based on weekly chart structure. Entry is planned near the current level with a stop-loss slightly below the support zone. I plan to use pyramiding to add positions if momentum continues after breakout above neckline resistance.
⚠️ Disclaimer:
This analysis is for educational and informational purposes only. It is not intended as investment advice or a recommendation to buy or sell any securities. I am not a SEBI-registered advisor. Please do your own research and consult with a registered financial advisor before making any investment decisions. Trading and investing involve significant risk.
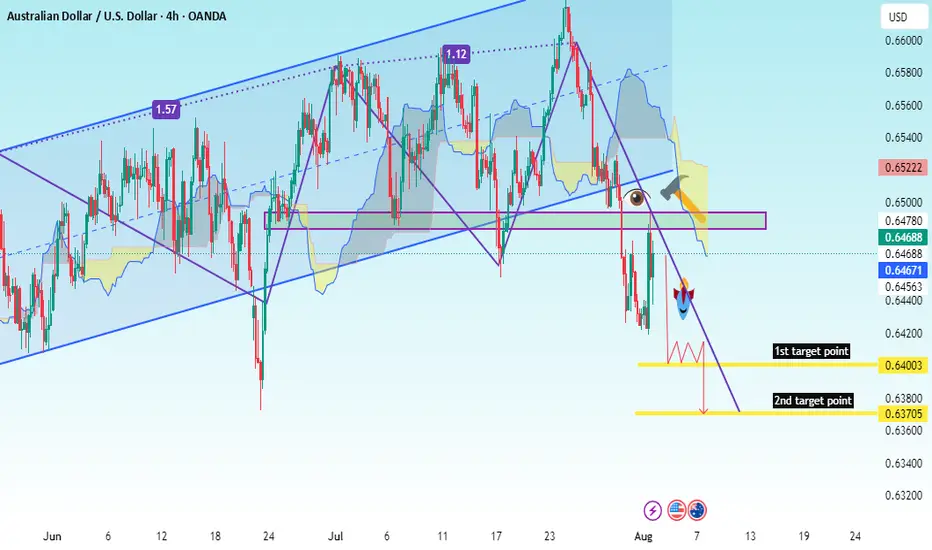
AUD/USD Bearish Breakout – Retest & Sell Continuation SetupAUD/USD (Australian Dollar vs. US Dollar)
Likely a 4H (4-hour) timeframe based on candlestick density and scale.
---
2. Structure & Patterns:
Rising wedge/ascending channel: Already broken to the downside.
Breakout zone: Around 0.6480–0.6500, clearly marked and now acting as resistance.
Retest confirmed: Price returned to the broken zone, touched resistance, and dropped.
Ichimoku Cloud: Price is below the cloud → strong bearish signal.
Downward projection: You’ve drawn a possible bearish path with lower highs and lower lows.
---
3. Key Support & Target Levels:
✅ Current Price (as per chart):
Around 0.6468
🎯 Target Points (as per your drawing):
1. First Target Point → 0.6400
This aligns with previous minor support.
2. Second Target Point → 0.6370
Likely based on a Fibonacci or historical support level.
---
✅ Clear Trade Setup Summary:
Component Value
Direction Sell (Short)
Entry 0.6475–0.6485
Stop-Loss 0.6520
TP1 0.6400
TP2 0.6370
---
📌 Conclusion:
You are currently in a bearish setup after a breakdown from a rising structure. The market structure favors lower prices with clearly marked TP1 at 0.6400 and TP2 at 0.6370. Your entry zone (0.6475–0.6485) is technically sound, especially if there's a minor retracement.
Let me know if you want:
A Fibonacci analysis
RSI/MACD confirmation
BTCUSD Technical Analysis (Smart Money Concepts) BTCUSD Technical Analysis (Smart Money Concepts)
Market Structure Overview:
Break of Structure (BOS) observed multiple times confirms a strong bearish trend.
Change of Character (CHoCH) around 30th July indicated initial shift from bullish to bearish intent.
Price has been forming lower highs and lower lows, respecting the bearish structure.
Key Zones:
🔴 Previous Resistance Zone (119,000 - 120,500)
Strong supply area from where price sharply reversed.
Also aligned with a Strong High marked at ~$120,000 – key for any future bullish invalidation.
🟫 Current Target Zone – 116,000
Acts as an immediate imbalance fill/FVG retracement zone.
Target highlighted as potential retracement point before continuing lower.
🟦 Liquidity / Fair Value Gap (FVG) Zone
Located between ~115,800 and 114,500.
Price may aim to revisit this zone on pullback, filling inefficiencies.
🟩 Support Zone (~113,000)
Price currently reacting near this zone.
This area has acted as a demand zone in the past and is expected to provide short-term support.
Volume Profile & Order Flow:
Visible Range Volume Profile shows heavy activity near the resistance cluster, indicating strong distribution by institutional players.
Low volume in the FVG area further confirms inefficiency and potential for a retracement move.
Smart Money Perspective:
The current structure reflects distribution at highs, followed by markdown phase.
Price swept liquidity below local lows and may now seek to mitigate previous supply or FVG around 116,000 before resuming bearish trend.
📌 Conclusion:
Bias: Bearish until 116K is tested and rejected.
Next Move Expectation: Possible liquidity sweep → bounce to 116K → short continuation.
Invalidation Level: Break and close above 117K would signal strength returning.
✅ Educational Note:
This is a classic Smart Money trap setup — liquidity grab near lows, fakeout pump to FVG, and potential short continuation. Traders should be cautious of fake rallies into known supply zones.

CADJPY Expected Growth! BUY!
My dear friends,
CADJPY looks like it will make a good move, and here are the details:
The market is trading on 107.35 pivot level.
Bias - Bullish
Technical Indicators: Supper Trend generates a clear long signal while Pivot Point HL is currently determining the overall Bullish trend of the market.
Goal - 107.90
About Used Indicators:
Pivot points are a great way to identify areas of support and resistance, but they work best when combined with other kinds of technical analysis
Disclosure: I am part of Trade Nation's Influencer program and receive a monthly fee for using their TradingView charts in my analysis.
———————————
WISH YOU ALL LUCK

CHFJPY On The Rise! BUY!
My dear friends,
My technical analysis for CHFJPY is below:
The market is trading on 183.63 pivot level.
Bias - Bullish
Technical Indicators: Both Super Trend & Pivot HL indicate a highly probable Bullish continuation.
Target - 184.54
Recommended Stop Loss - 183.16
About Used Indicators:
A pivot point is a technical analysis indicator, or calculations, used to determine the overall trend of the market over different time frames.
Disclosure: I am part of Trade Nation's Influencer program and receive a monthly fee for using their TradingView charts in my analysis.
———————————
WISH YOU ALL LUCK

Wedge Pattern: A Key to Trend Reversals and Continuations📈 Wedge Pattern: A Key to Trend Reversals and Continuations
A wedge pattern is a technical chart formation that signals a potential reversal or continuation in the market. It’s formed when price moves between two converging trendlines — either sloping upward or downward — creating a narrowing range over time.
There are two main types of wedge patterns:
🔻 Falling Wedge (Bullish)
Formed during a downtrend or as a correction in an uptrend.
Characterized by lower highs and lower lows, with the slope of the support line steeper than the resistance line.
Typically signals a bullish reversal as momentum builds for a breakout to the upside.
✅ Confirmation: Break above the resistance line with volume surge.
🔺 Rising Wedge (Bearish)
Appears during an uptrend or as a correction in a downtrend.
Shows higher highs and higher lows, but the support line is steeper than the resistance line.
Often leads to a bearish reversal, especially when volume declines into the pattern.
⚠️ Confirmation: Break below the support line with increasing volume.
🧠 Key Characteristics
Volume tends to decrease as the pattern forms, indicating a pause in momentum.
The breakout direction (up or down) determines whether it’s a continuation or reversal signal.
Wedges can appear on any time frame and are useful for both day traders and long-term investors.
📊 Trading Tip
Always wait for confirmation of the breakout before entering a trade. False breakouts can be common, especially in low-volume environments

BTCUSD Technical Analysis – Bearish Momentum Towards Fair Value BTCUSD Technical Analysis – Bearish Momentum Towards Fair Value Gap
Bitcoin is showing clear bearish pressure after rejecting from the previous resistance zone around 118,800 – 120,000. The market structure and smart money concepts indicate potential for further downside.
🔍 Key Observations:
Previous Resistance Respected: Price failed to break through the strong resistance zone marked near the 119,200–120,000 level, showing strong institutional selling interest.
Market Structure Breaks:
BOS (Break of Structure) and CHoCH (Change of Character) confirmed bearish shift.
Price has maintained lower highs and lower lows, signaling a bearish trend.
Liquidity/Fair Value Gap Zone: The market is currently targeting the liquidity/FVG zone between 116,400 – 116,100, which aligns with price inefficiency and unfilled orders.
Support Zone Ahead: A strong support zone is visible near 115,600 – 115,200. Expect a potential reaction or consolidation here.
📌 Strategy & Bias:
Short Bias Active until price reaches 116,116 (target).
Watch for possible bullish reversal signs in the support/FVG zone.
Ideal for scalp-to-swing short trades, with tight SL above recent EQH.
📚 Educational Notes:
Fair Value Gaps (FVG) indicate institutional imbalances and are often revisited by price.
CHoCH and BOS are early signals of smart money moves – always monitor them in confluence with volume and zones.

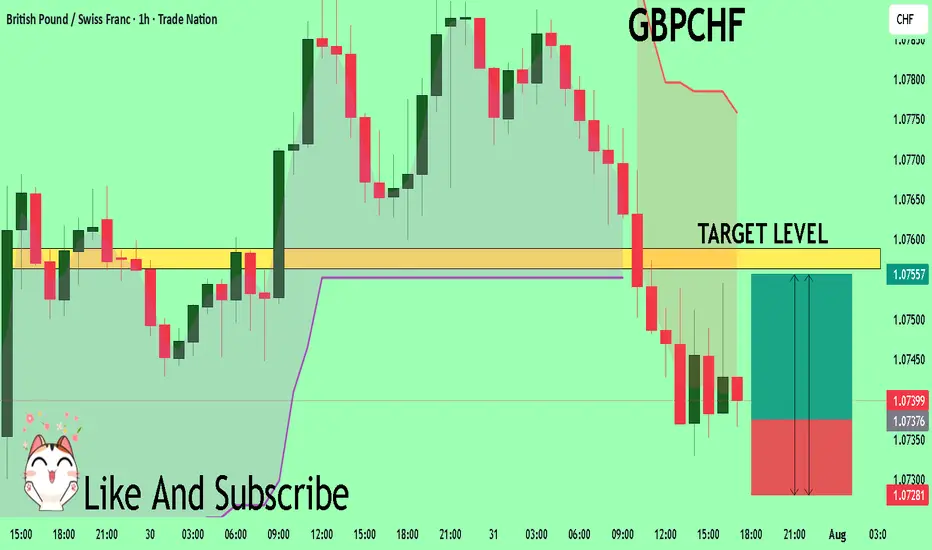
GBPCHF Trading Opportunity! BUY!
My dear followers,
This is my opinion on the GBPCHF next move:
The asset is approaching an important pivot point 1.0737
Bias - Bullish
Safe Stop Loss - 1.0728
Technical Indicators: Supper Trend generates a clear long signal while Pivot Point HL is currently determining the overall Bullish trend of the market.
Goal - 1.0756
About Used Indicators:
For more efficient signals, super-trend is used in combination with other indicators like Pivot Points.
Disclosure: I am part of Trade Nation's Influencer program and receive a monthly fee for using their TradingView charts in my analysis.
———————————
WISH YOU ALL LUCK
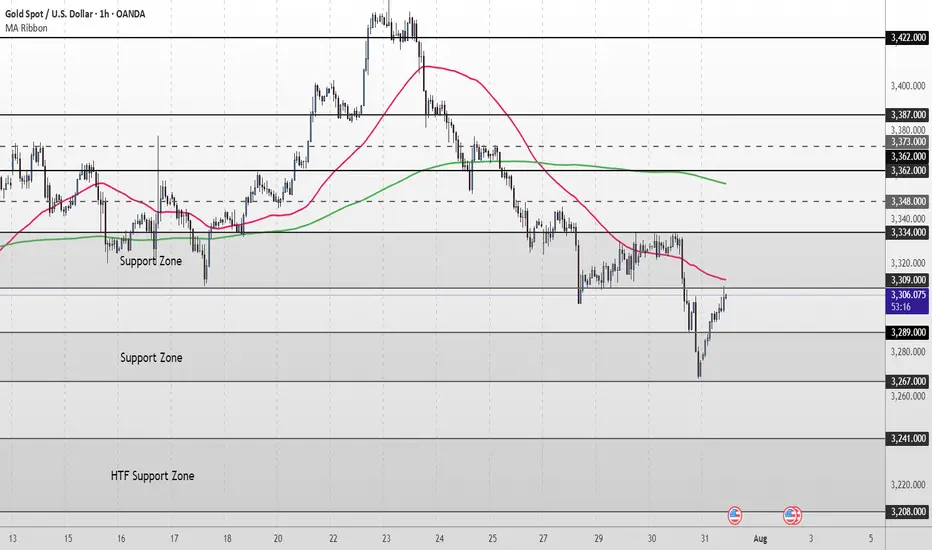
XAU/USD Intraday Plan | Support & Resistance to WatchGold staged a minor recovery overnight after bouncing from the 3,267 Support Zone, and is now trading around 3,305. Price remains below both the 50MA and 200MA, which continue to slope downward—confirming short-term bearish structure.
This current move is still corrective unless bulls manage to reclaim the 3,309–3,334 resistance zone. A clean break and hold above 3,334 would be the first sign of strength, opening up potential retests of 3,348 and 3,362.
Until then, any rallies into the 3,309–3,334 zone should be viewed with caution. If the bounce loses steam, watch for a retest of 3,289 - 3,267. A break below that would expose the 3,241 and 3,208 levels, with the HTF Support Zone (3,241–3,208) acting as a broader downside cushion.
📌 Key Levels to Watch
Resistance:
‣ 3,309
‣ 3,334
‣ 3,348
‣ 3,362
Support:
‣ 3,289
‣ 3,267
‣ 3,241
‣ 3,208
🔍 Fundamental Focus – Thursday, July 31
Big day for data.
🟥 Core PCE, Employment Cost Index, and Unemployment Claims — all critical for Fed outlook and could move gold sharply.
⚠️ Volatility expected around 2:30pm. Stay nimble and manage risk carefully.
Massive Base Formation on Charts – Potential Multibagger LoadingThere are two Chart of HIMATSINGKA SEIDE.
Himatsingka Seide is forming a symmetrical broadening wedge pattern on the weekly timeframe, with a strong support zone near ₹100.
On the daily timeframe, Himatsingka Seide is forming an ascending broadening wedge pattern, with a crucial support level near ₹135.
If this level is Sustain then we may see higher prices in Himatsingka Seide.
Thank You !!

USD/JPY BEARS ARE GAINING STRENGTH|SHORT
USD/JPY SIGNAL
Trade Direction: short
Entry Level: 147.871
Target Level: 145.815
Stop Loss: 149.230
RISK PROFILE
Risk level: medium
Suggested risk: 1%
Timeframe: 1D
Disclosure: I am part of Trade Nation's Influencer program and receive a monthly fee for using their TradingView charts in my analysis.
✅LIKE AND COMMENT MY IDEAS✅

EUR/USD BULLISH BIAS RIGHT NOW| LONG
Hello, Friends!
EUR/USD pair is in the uptrend because previous week’s candle is green, while the price is obviously falling on the 1D timeframe. And after the retest of the support line below I believe we will see a move up towards the target above at 1.179 because the pair is oversold due to its proximity to the lower BB band and a bullish correction is likely.
Disclosure: I am part of Trade Nation's Influencer program and receive a monthly fee for using their TradingView charts in my analysis.
✅LIKE AND COMMENT MY IDEAS✅

XAU/USD Intraday Plan | Support & Resistance to WatchGold remains under pressure, currently trading around 3,312. Price is holding just above the 3,309–3,289 Support Zone, but remains below both the 50MA and 200MA, which continue to slope downward—indicating short-term bearish pressure.
As long as price remains below the 3,334–3,348 resistance zone, the bearish momentum is intact. A clean break above this area would be the first sign of recovery, opening the path toward 3,362 and 3,373, where the next round of supply may emerge.
If price fails to reclaim 3,334 and breaks below 3,309, the 3,289–3,267 Support Zone becomes the next key downside target. Failure to hold that level would expose the HTF Support Zone (3,241–3,208).
📌 Key Levels to Watch
Resistance:
‣ 3,334
‣ 3,348
‣ 3,362
‣ 3,373
Support:
‣ 3,309
‣ 3,289
‣ 3,267
‣ 3,241
🔍 Fundamental Focus – Tuesday, July 29
Heads up — today’s focus is on 4:00pm, when we get JOLTS Job Openings 🟥 and CB Consumer Confidence 🟡
⚠️ Stay light and nimble — bigger moves may come tomorrow with red-folder data stacking up.
