GBPUSD LOND Trade ideiaGBPUSD LOND Trade ideia - Im hoping to have a pull back to my entry zone. We might not even have this chance but I prefer to not chase price now. If I lose this move its ok. Lets see.
Techincalanalysis

Tue 6th May 2025 GBP/JPY Daily Forex Chart Sell SetupGood morning fellow traders. On my Daily Forex charts using the High Probability & Divergence trading methods from my books, I have identified a new trade setup this morning. As usual, you can read my notes on the chart for my thoughts on this setup. The trade being a GBP/JPY Sell. Enjoy the day all. Cheers. Jim

GU Re-enter for LONGS. GU Re-enter for LONGS. AFter being stopped in BE Im entering again to this Long trade ideia. I believe we still bullish at this pair. Lets see. Please if ypu take it, put brake even after 1-1RR.

EURUSD LONG TRADE IDEIAEURUSD LONG - trade ideia. 1-3RR small pull back trade ideia. Expecting more move in this direction next week.

NAS100 BUY Trade ideiaNAS100 Long move trade ideia. Expecting to see trade reach this target.
Please move SL to BE once it hits 1-1RR.


EURUSD LONG 1-4RREURUSD LONG 1-4RR . I didnt share this trade ideia because I felt it was very risky, but Im happy to share that this worked.

GU SCAPL LONG Trade ideiaGU SCAPL LONG Trade ideia. just a starter 1-1RR. Its a small one I even expect more move bullish but as its monday lets go slowly..

XAUUSD is still in an Up TrendDespite being an Up Trend, XAUUSD still has a possibility to drop down to the 62% retracement line.

TRX Poised for Breakout After Weeks of CompressionTRX has been consolidating in a tight range between 0.24 and 0.26 for several weeks, showing signs of strength in a weak market. Price action has been orderly, with higher lows tightening into flat resistance — a textbook buildup.
This kind of compression often leads to sharp directional movement, especially when paired with low volatility and reduced attention. Volume remains muted, but any breakout with conviction above 0.26 could spark a strong trend continuation
Invalidation: Breakdown of support or rejection with high sell volume near 0.26.
Watching closely. No need to predict — just react.
#TRX #Crypto #BreakoutSetup #Altcoins #TradingViewIdeas

This AI-Backed IPO Is Just Warming Up — Next Stop: 86% Gains?CoreWeave is showing classic IPO 'honeymoon phase' price action, with early liquidity swept and bullish structure forming.
🔍 Price swept the daily sell-side liquidity at $35.70
📈 Now pushing higher — next major buyside targets at $55.04 and $65.22
🤖 Backed by NVIDIA, adding serious momentum and credibility
🧠 Expecting strong continuation as institutions begin to build exposure
If price maintains structure, this could be one of the strongest IPO moves of 2025.

SoFi Technologies (SOFI, 1D)On the daily chart, SoFi has broken out of its descending trendline, confirmed the breakout with a clean retest of the 0.618 Fibonacci retracement level at $12.33, and is now building upward momentum from this demand zone. This “buy zone” is acting as a launchpad for a potential mid-term move toward higher resistance levels.
Key Fibonacci-based upside targets:
– $13.48 (0.5 retracement)
– $14.64 (0.382 retracement)
– $16.07 (0.236 retracement) — within the defined target zone
– Extended target: $18.37 (1.0 Fibonacci projection)
Technical structure highlights:
– Breakout of multi-month downtrend + successful retest
– Price now trading above key EMAs (50/100/200)
– Volume expansion on bullish candles confirms demand
– Daily momentum favors further continuation toward the $14–$16 zone
– Premium supply zone above $16 may slow initial momentum but offers long-term potential toward $18+
Fundamental context:
SoFi is evolving as a vertically integrated fintech platform with strong brand recognition and growing user engagement across banking, investing, and lending services. As the company narrows losses and strengthens recurring revenue, investor interest in SOFI is growing — particularly as market appetite returns for high-quality fintech with path-to-profitability models.
The technical breakout is confirmed. As long as price remains above the $12.33–$12.50 buy zone, the bullish scenario remains valid with targets toward $14.64 and $16.07. A breakout above $16 would activate the full expansion toward $18.37 in the mid-term.

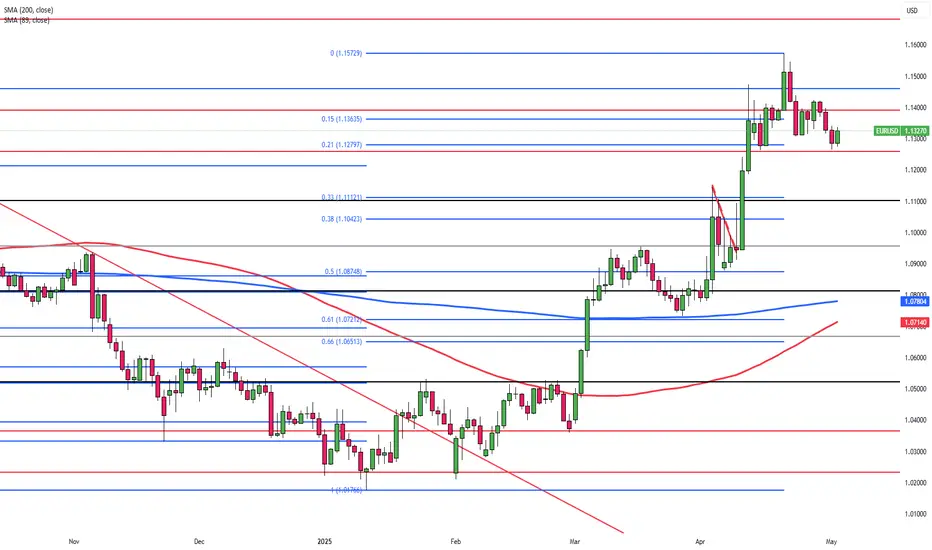
Euro Slips to $1.13 After Strong AprilThe euro dipped toward $1.13 on May 1 after a 5% April gain, as the dollar found support in Trump’s optimism about trade deals with India, Japan, South Korea, and China. Markets awaited Friday’s U.S. jobs data for Fed policy clues. The U.S. economy shrank 0.3% in Q1, partly due to import spikes ahead of expected tariffs. Meanwhile, the Eurozone grew 0.4%, driven by strong domestic demand. German inflation eased to 2.1%, though core rose slightly, while France’s annual rate held at 0.8%.
Resistance levels are seen at 1.1460, then 1.1580 and 1.1680, while support rests at 1.1260, followed by 1.1200 and 1.1150.
HDFC Life Insurance – Bullish Breakout on Monthly ChartHDFCLIFE is forming a strong ascending triangle on the monthly chart, signaling long-term bullish potential. A breakout above ₹750 with volume can trigger a fresh rally toward ₹880–₹920 in the coming months. RSI is trending up with strong momentum, which confirms buying interest. In the short term, ₹715 acts as support. Long-term investors can accumulate on dips.
Short-Term View: Buy on dips above ₹715 | Target ₹780
Long-Term View: Breakout above ₹750 | Target ₹900+
For educational purposes only

GOLD 05/01/2025Scenario GOLD TF H4
- Stick to your stop loss to protect your trades
- Manage your positions patiently until you hit the target
- Profit always in risk, take the risk or lose the chance

Thu 1st May 2025 NZD/CAD Daily Forex Chart Sell SetupGood morning fellow traders. On my Daily Forex charts using the High Probability & Divergence trading methods from my books, I have identified a new trade setup this morning. As usual, you can read my notes on the chart for my thoughts on this setup. The trade being a NZD/CAD Sell. Enjoy the day all. Cheers. Jim

XAUSUD LONG 1-10RRXAUSUD LONG 1-10RR. Look a this beautiful trade Im expecting for Gold. Lets see if we get those 10 . Have a great trading day.

Equity Research Update – Paras Defence and Space Technologies CMP: ₹1,143 | Upside Potential: High
Paras Defence has broken out of a strong resistance zone (~₹1,120–₹1,160), confirmed by significant volume and bullish momentum. The RSI shows strength above 70, indicating buyer dominance. Historical resistance, marked by previous rejections, may now act as strong support. If sustained, this breakout could lead to a fresh uptrend. Investors may consider accumulating on dips with a medium-term target of ₹1,300–₹1,350, keeping a stop-loss below ₹1,080.
Recommendation: BUY on Breakout Confirmation
For Education Purpose only

GU LONG TRADE Ideia. GBPUSD LONG Trade ideia. Im quiet confused about where to spot my entry. Will be monitoring but Ill be expecting longs these days. 1-6RR

EU LONG TRADE IDEIA. Expecting a bullish week. Lets seeEU LONG TRADE IDEIA. Expecting a bullish week. Lets see. 1-6RR
Equity Research Flash – BEML Ltd.CMP: ₹3,242.10 | Breakout From Falling Trendline
BEML has decisively broken out of a falling trendline and is now sustaining above a key consolidation zone. With strong bullish candles, a rising RSI, and healthy volume spike, the stock signals bullish momentum. Immediate resistance lies at ₹3,420–₹3,480. Sustained move above could target ₹3,750+. 20/50 EMA crossover supports the upward trend. Traders may consider entries on dips with SL near ₹3,080.
For educational purposes only

USOIL 2025/04/29Scenario USOIL TF H4
- Stick to your stop loss to protect your trades
- Manage your positions patiently until you hit the target
- Profit always in risk, take the risk or lose the chance

KFin Technologies LtdCompany Snapshot:
Sector: Financial Services (Mutual Fund Services, RTA)
Market Cap: ₹21,000 Cr
Current Price: ₹1,239.20
Debt-to-Equity: 0.06 (very low)
ROE: 39% | ROCE: 49%
Financial Highlights:
Revenue Growth (3Y CAGR): ~22%
Profit Growth (3Y CAGR): ~32%
EBITDA Margin: ~48%
P/E Ratio: ~35x (TTM)
Industry Avg P/E: ~30-32x
Recent Price Action:
Stock broke out sharply in April 2025.
Support: ₹1,180 | Resistance: ₹1,300
RSI near 70 (mildly overbought, but momentum strong).
Key Strengths:
Dominant RTA player with 70%+ MF asset share.
Consistent cash flows and expanding international footprint.
High operating leverage driving margin expansion.
Key Risks:
Regulatory changes (SEBI reforms) could pressure fees.
High client concentration risk with top AMCs.
Valuation & Recommendation:
DCF Estimated Fair Value: ₹1,280–₹1,350
Recommendation: BUY on Dips / Accumulate
12-month Target Price: ₹1,320
Investment Horizon: 1–2 years
📈 Verdict: Strong business fundamentals, steady growth, and low debt make KFin Technologies attractive for long-term investors. Minor corrections can offer better entry points.
For Education Purposes only

AUDUSD A Fall Expected! SELL!
My dear subscribers,
My technical analysis for AUDUSD is below:
The price is coiling around a solid key level - 0.6418
Bias - Bearish
Technical Indicators: Pivot Points High anticipates a potential price reversal.
Super trend shows a clear sell, giving a perfect indicators' convergence.
Goal - 0.6412
About Used Indicators:
By the very nature of the supertrend indicator, it offers firm support and resistance levels for traders to enter and exit trades. Additionally, it also provides signals for setting stop losses
Disclosure: I am part of Trade Nation's Influencer program and receive a monthly fee for using their TradingView charts in my analysis.
———————————
WISH YOU ALL LUCK
