EURAUD: Short After Break!Next week we are going to have important news for AUSSIE. If it aligns with our analysis, we will short the pair after breaking below the PURPLE level of 1.7550!
Regarding the EQUAL daily levels, we have seen a great reaction and wait for more bearish moves!
This is a great ZONE we are facing now!
We see that the last bearish move was considerably STRONG!
We expect a break below the zone; I'll put my orders then!
Technical

GBP/USD Is Approaching a Key Zone—Don’t Miss This Setup!What are your thoughts on GBP/USD?
Price recently reacted strongly from the upper resistance zone, showing clear loss of momentum after the latest bullish push. The pair is now pulling back, and as long as price remains below this resistance, a short-term bearish correction is the more likely scenario.
If the pullback extends toward the 1.3180–1.3150 demand zone, we could see a potential bullish reversal from that area. However, if price continues to reject the resistance zone, the bearish corrective scenario remains valid toward the marked target below.
Setup
Sell Area: 1.3330 – 1.3350
Target Zone: 1.3180 – 1.3150
Reason:
- Strong rejection at resistance
- Clear loss of momentum
- Clean liquidity below to collect
This matches the grey corrective path shown in the chart.
Don’t forget to like and share your thoughts in the comments! ❤️

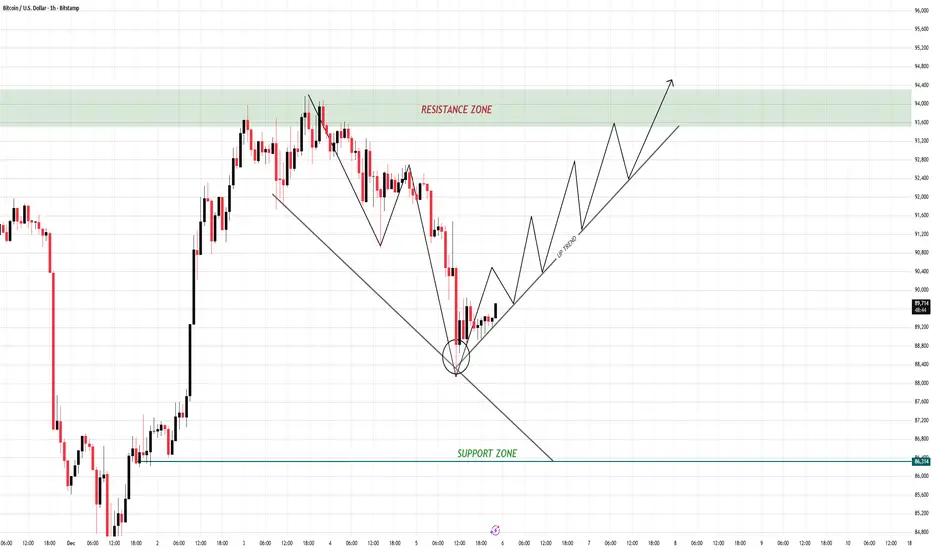
BTC Reversal Loaded — The Uptrend Has Officially Started1) Market Structure
- After a strong sell-off, BTC formed a new low and immediately bounced from a confluence zone of trendline + support (circled area).
- The previous move was a descending structure, but the sharp rebound signals the formation of a first Higher Low → a clear early sign of trend reversal.
- Price has slightly broken the descending trendline and is now retesting it, building the foundation for a bearish → bullish structure shift.
2) Key Levels
Support Zone:
Strong support around 86,300, where the price rejected and reversed.
Resistance Zone:
Major resistance between 93,600 – 94,400, previously a strong rejection area.
Uptrend Line:
- A new uptrend line is forming.
- Every pullback toward this trendline → a potential long opportunity.
3) Scenarios
✅ Main Scenario (Bullish – High Probability)
As long as BTC holds the circled support area and continues forming Higher Highs & Higher Lows, the uptrend remains intact.
Strategy: wait for pullbacks to the trendline to enter long positions.
Targets:
TP1: retest 93,600
TP2: break higher into 94,400
❌ Invalidation Scenario (Bearish)
- If price breaks below the uptrend line and falls back toward 86,300, the bullish structure fails.
- That would signal a deeper correction or a full bearish continuation.
4) Summary
BTC has bounced off a critical support zone with clear signs of a trend reversal. The bullish structure is forming, and pullbacks to the uptrend line will be the key opportunities.
The market rewards discipline — wait for your setup, then execute with confidence
GBPJPY: BUY IT!Hello Traders
This is the 1Y channel!
we are around a strong static level and mid of a bullish channel!
As it is obvious!
If we see a smooth correction! We will enter the trade!
Have fun!

How i trade This is how i trade.
Looking at AUDJPY, I want to show you step by step how i trade using volume, momentum and rsi, looking at each timeframe from the monthly to the 5 min.

GBP/JPY Bullish Continuation Toward 215.00 TargetGBP/JPY is trading around 201.09, maintaining an upward trendline support. The pair is consolidating near resistance at 201.50, with a potential bullish target set at 215.00 if price breaks above the current range.

USD/JPY(20251107)Today's AnalysisMarket News:
Revelo Labs, a US private data provider, reported that US non-farm payrolls decreased by 9,100 in October; Challenger job cuts in the US surged 175% year-over-year in October, and year-to-date layoffs increased by 65%; Chicago Fed data showed the October unemployment rate was approximately 4.36%, a four-year high. Federal Reserve officials remain cautious. Chicago Fed President Goolsby believes a lack of reliable inflation data and remains hesitant about interest rate cuts; Cleveland Fed President Hammarck emphasized inflation risks and opposed further rate cuts; however, Governor Milan continues to expect a Fed rate cut in December; New York Fed President Williams believes the model-based estimate of the US neutral interest rate is around 1%. Governor Barr pointed out that the impact of artificial intelligence may be affecting hiring in some industries.
Technical Analysis:
Today's Buy/Sell Threshold:
153.33
Support and Resistance Levels:
154.63
154.15
153.83
152.83
152.52
152.03
Trading Strategy:
If the price breaks above 153.33, consider buying with a first target price of 153.83.
If the price breaks below 152.83, consider selling with a first target price of 152.52.

USD/JPY(20251105)Today's AnalysisMarket News:
The US government shutdown stalemate continues, and the 35-day record is about to be broken.
Technical Analysis:
Today's Buy/Sell Threshold:
153.81
Support and Resistance Levels:
154.97
154.54
154.26
153.37
153.09
152.66
Trading Strategy:
Consider buying if the price breaks above 153.81, with a first target price of 154.26.
Consider selling if the price breaks below 153.37, with a first target price of 153.09.

Gold Price Breakout Toward 4,037 Target(XAU/USD) is forming a symmetrical triangle pattern on the 1-hour chart, suggesting potential breakout momentum. The price is currently trading near $4,014, with an upside target of $4,037 if bullish momentum continues. Key support zones are located at $3,960, $3,920, and $3,880.

USD/JPY(20251029)Today's AnalysisMarket News:
A survey by the London Bullion Market Association (LBMA) predicts gold prices will reach $4,980.3 per ounce and silver prices will reach $59.1 per ounce in one year.
Technical Analysis:
Today's Buy/Sell Threshold:
152.22
Support and Resistance Levels:
153.33
152.91
152.64
151.80
151.53
151.11
Trading Strategy:
If the price breaks above 152.22, consider buying with a first target price of 152.64.
If the price breaks below 151.80, consider selling with a first target price of 151.53.

SPX500: Trump's trip to East Asia shakes marketsHello Traders,
This is the Daily Chart!!
We had great bullish year! A bullish channel is crystal clear! we are about to be considered as overbought buyers! But since it's stocks and the channel is broken, we are till bullish!!
And this is the chart of recent 3M,
1- the break is powerful.
2- we need a correction, technically.
3- we are about the mid-term channel.
4- top of the long-term channel could also be firsthand support, they call it SL hunt, I don't.

Chorus (CNU) major resistance test. Price discovery?
CNU being in the Telcom space has seen a steady and consistent upwards trend since near its inception and being listing on the ASX, with over 600% gain since 2013. In the last 5 years or so we've seen a sideways trend, as the price begins to advance towards test its previous major resistance @ around the $8.80 mark.
On the (W) we can see a gap down after a test of this key area and a mean reversion to the 200MA with a close on the 50MA. Some big seller volume moved in to push the price down, but encouragingly price as respected the current trend line, with signs of a bounce this week.
A potential GAP fill is in play, and a potential for a break above major resistance and then into price discovery for this company. A clear BUY signal would be a break or break and hold after a retest of the resistance of the $8.80 mark. Good luck.

USD/JPY(20251023)Today's AnalysisMarket News:
The shutdown continues, and the US Senate has rejected the temporary funding bill for the 12th time.
Technical Analysis:
Today's buy/sell levels:
151.83
Support and resistance levels:
152.38
152.17
152.04
151.61
151.48
151.27
Trading Strategy:
If the stock breaks above 152.04, consider buying, with the first target price being 152.17.
If the stock breaks below 151.83, consider selling, with the first target price being 151.61.

USD/JPY(20251021)Today's AnalysisMarket News:
The US government shutdown entered its 20th day on Monday after senators failed to break the impasse for the tenth time last week. The shutdown has also delayed the release of key economic data, leaving investors and Federal Reserve policymakers with a data vacuum ahead of next week's policy meeting. The US Consumer Price Index (CPI) data, delayed by the shutdown, is scheduled for release this Friday. Meanwhile, traders are pricing in a 99% probability of a Fed rate cut next week, with another cut expected in December. As a non-interest-bearing asset, gold typically performs well in a low-interest rate environment.
Technical Analysis:
Today's Buy/Sell Levels:
150.73
Support and Resistance Levels:
151.65
151.30
151.08
150.37
150.15
149.81
Trading Strategy:
On the upside, consider buying on a break above 151.08, with the first target at 151.30.
On the downside, consider selling on a break below 150.73, with the first target at 150.15.

Gold Price Outlook: What Could Drive the Next Rally?The global economy continues to grapple with challenges such as inflation, labor market uncertainty, and persistent geopolitical risks. Unlike previous cycles, gold has shown more shallow and short-lived corrections, reflecting a broadly optimistic outlook from investors and traders. With central banks and ETFs steadily increasing their exposure to gold, the yellow metal is set to remain a key safe-haven asset.
The XAU/USD pair, representing gold against the US dollar, is expected to follow a bullish trajectory throughout 2025. By analyzing upcoming macroeconomic drivers and technical signals, we can identify several catalysts that may fuel gold’s next rally.
Key Drivers of the Bullish Trend
1. Fundamental Factors
Central Bank Demand: Global central banks, particularly in emerging markets and China, continue to expand their gold reserves, adding consistent pressure on the demand side.
Geopolitical Risks: Ongoing conflicts, such as the Russia–Ukraine war and unrest in the Middle East, have reinforced gold’s role as a safe-haven asset, pushing prices higher.
ETF Inflows: Recent weeks have seen growing inflows into gold ETFs, indicating stronger institutional demand and confirming investor confidence.
Volatility Index (VIX): With the VIX rising above 20, risk-averse sentiment is fueling demand for safe assets like gold.
2. Inflation & Monetary Policy
As inflation remains a persistent concern, gold continues to serve as a traditional hedge. If inflation rises further or stays elevated, gold’s attractiveness will increase. At the same time, a dovish Federal Reserve stance—or the maintenance of lower interest rates—would enhance the appeal of non-yielding assets such as gold, further supporting upward momentum.
3. Technical Indicators
Technical analysis suggests a clear bullish bias. Key support lies near $3,535, with resistance around $3,900. The 50-day moving average provides a strong base, affirming positive momentum. Although daily RSI and MACD readings show overbought conditions, which may lead to short-term pullbacks, the overall trend remains decisively upward.
4. COT Data Insights
Commitment of Traders (COT) reports highlight the prevailing bullish sentiment. Long positions currently stand at 332,808 compared to 66,059 short positions—a ratio of more than 5:1. This reinforces the likelihood of sustained positive price action.
Short-Term Outlook (October–December 2025)
The final quarter of 2025 appears primed for favorable gold price movements:
October: Trading is projected between $3,892.19 and $4,299.84, with an average near $4,084.78, implying an ~11% monthly gain.
November: The average range could extend to $4,277.88–$4,447.77, signaling continued bullishness.
December: Prices are forecast to move between$4,113.43 and $4,367.87, with an average of$4,240.65, marking a potential year-end peak.
Long-Term Projection Beyond 2025
By year-end 2025, gold could consolidate near$4,240.65, a substantial gain from current levels. Looking further ahead, some analysts foresee the possibility of gold climbing toward$5,107 by the end of the decade, assuming supportive macroeconomic and monetary conditions persist.
Despite the broadly optimistic outlook, several risks may temper gold’s trajectory:
Federal Reserve Policy Shifts: A sudden pivot to a more aggressive tightening cycle would reduce gold’s appeal in favor of interest-bearing assets.
Global Economic Recovery: Strong rebounds in major economies such as the U.S. and China could diminish safe-haven demand, weighing on prices.
Probable Scenarios (1–3 Weeks Ahead)
Base Case – Uptrend with Pullbacks (60% probability): After brief corrections within $3,750–$3,800, buyers may step in, pushing gold toward $3,990–$3,900.
Corrective Scenario (25% probability): A stronger dollar or unexpected Fed hawkishness could drive a deeper pullback toward $3,600–$3,650.
Accelerated Bullish Scenario (15% probability): Sustained safe-haven demand and institutional flows may trigger a breakout above $3,900–$4,000, especially under heightened geopolitical or financial stress.
Key Data to Watch
In the near term, inflation and labor market data remain the most influential indicators. Upcoming releases of Nonfarm Payrolls, Unemployment Rate, ISM Services PMI along with political developments such as remarks from Donald Trump, will be closely monitored for their impact on market sentiment and gold’s trajectory.
Conclusion
Overall, 2025 appears well-positioned for a sustained gold rally, driven by central bank demand, inflationary pressures, and geopolitical tensions. While risks remain—particularly tied to U.S. monetary policy—technical and fundamental signals point toward higher prices. For investors, gold continues to stand out as one of the most compelling hedges in a volatile global environment.

EUR/CHF: SNB Intervention Opens the Door for LongsDear Traders,
This trade idea combines technical structure with a fundamental catalyst and can be used to gradually build long exposure in EUR/CHF, anticipating an eventual upside move.
🔹 Fundamental Catalyst
Yesterday, the Swiss National Bank (SNB) published a report confirming that – for the first time since 2022 – it intervened in the FX market by selling CHF against EUR. In practice, this is equivalent to establishing a long EUR/CHF position.
The intervention followed a period of extreme CHF strength, as the currency became the safe-haven of choice in 2025. Meanwhile, the USD lost its traditional safe-haven appeal due to U.S. tariff uncertainty and the prospect of Fed rate cuts. Global reserve managers reduced USD holdings and shifted some flows into CHF, given Switzerland’s political stability.
However, with Swiss interest rates near zero, the CHF is increasingly attractive as a funding currency. Coupled with the first official intervention in three years, this creates a strong case for potential CHF weakness in the weeks and months ahead.
🔹 Technical Setup
EUR/CHF remains range-bound.
Key support zones:
>0.9300+
>0.9250 – 0.9280
Even if these levels are briefly breached, strong EUR demand (as the USD falls out of favor) should provide a cushion.
🔹 Trade Idea
Initiate a small long position at current levels.
Scale in with additional small longs every 0.5–1 ADR lower.
This approach helps achieve a favorable breakeven and positions for a potential move towards 0.9400+.
💬 Final Note
Risk management and position sizing are crucial. Keep entries small and scale gradually. If you’d like insights on position sizing or risk parameters, feel free to leave a comment below.
Best regards,
Meikel

I'm still long biased @ $XAUUSD (but deleveraging)Technical View
A potential bullish cup & handle pattern is forming, often seen as a continuation signal.
Price has already broken out of a bearish channel, which suggests that buyers have taken control.
Triangle and wedge formations point to pressure building upward.
The broader macro channel remains intact, so the larger trend has not been broken.
Clear invalidation levels are visible near 3,730 and 3,612, which provides trade structure from a technical perspective.
Overall, the technical picture continues to lean bullish.
Macro View
US CPI remains sticky while jobless claims are softening, hinting at stagflation dynamics.
The Federal Reserve is under pressure to cut rates, with real interest rates already negative.
Historically, when real rates are negative, gold tends to outperform bonds as a store of value.
Global central banks remain net buyers of gold as they diversify away from Treasuries.
This combination is similar to the 1970s stagflation backdrop: falling rates with inflation uncertainty often encouraged capital flows into gold.
Opinion
Technicals suggest upward momentum. Macro factors also support a bullish bias. The main caveat is that positioning in gold is already heavy, which can lead to sharp short-term volatility. Directionally, however, the long bias aligns with both the charts and the macro backdrop.
Disclaimer
This post reflects only my personal market observations and opinions, shared for educational and informational purposes. It should not be considered financial advice, investment recommendation, or a call to action. Trading financial markets involves risk, and you should carefully assess your own situation and risk tolerance before making any trading decisions. Past performance or historical patterns do not guarantee future results. Always do your own research and consult a licensed financial professional if needed.

#GOLD NewforcastOANDA:XAUUSD continues to climb upward channel.
If price holds above 3747, the breakout projection targets the zone above 3800 resistance.
risks:3747 - 3700
3800 My trigger profit - taking and short -term pullbacks.

USD/JPY(20250924)Today's AnalysisMarket Analysis:
Federal Reserve Chairman Powell stated that the policy rate remains somewhat restrictive, but allows the Fed to better respond to potential economic developments; tariffs are expected to have a one-time pass-through effect; and decisions will "never be based on political considerations." Fed spokespersons noted that Powell's comments indicate that he believes interest rates remain tight, potentially opening the door for further rate cuts.
Technical Analysis:
Today's Buy/Sell Levels:
147.66
Support and Resistance Levels:
148.13
147.95
147.84
147.49
147.37
147.20
Trading Strategy:
If the market breaks above 147.84, consider entering a buy position, with the first target price being 148.13.
If the market breaks below 147.66, consider entering a sell position, with the first target price being 147.49.

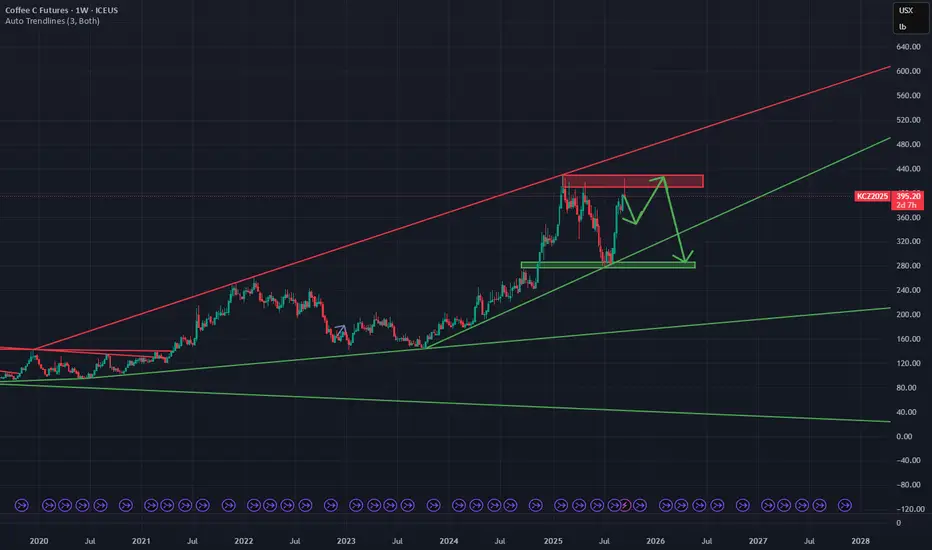
Short Arabica Coffee🔍 Setup
Price is approaching a well‐defined supply/resistance zone (red area on chart). Historically this zone has acted as overhead resistance.
Below, there is a green demand/support zone which should act as target support area.
My target on the short is around 7.8% downside from entry, with stop loss placed just above the resistance zone / recent swing high to limit risk.
📊 Fundamental & Sentiment Background (COT & Others)
According to the latest COT report (as of 9 Sep 2025), commercial hedgers are significantly net short in Coffee C.
tradingster.com
However, speculators / non-commercials are heavily net long. This suggests that bullish momentum is still in force.
tradingster.com
Open interest is rising, showing participation in current levels. This makes the risk of a breakout (to the upside) real, if bulls hold control.
⚠️ Risks to this trade
Momentum from speculators could drive price through resistance, triggering stop losses and a strong short squeeze.
Any unexpected fundamental shock (weather, export disruption, currency devaluation, etc.) could reduce supply or boost demand, pushing prices higher.
If volume doesn’t drop on advance into resistance, the upward move may be stronger than anticipated.
✅ Conditions / Trigger For Entry
I will consider entering the short position once:
Price touches or re-tests the red supply zone.
There's a clear rejection (candlestick reversal pattern + bearish confirmation).
Momentum or RSI / MACD divergence is visible.
Speculator net longs show signs of plateauing or declining in the COT (next report).
🎯 Targets & Risk/Reward
Entry: around current price near supply, or after confirmed rejection.
Stop Loss: just above resistance / recent high.
Target: green demand/support zone (approx. 7-8% downside).
Risk-Reward Estimate: aiming for at least 1.5-2x potential reward vs. risk, ideally better.
🧐 My Edge vs What Could Go Wrong
My trading strategy gives me an average short profit of 7.8%, so this is in line with my risk appetite. The probability for a profitable trade for a short position is 75%. However, on average I will lose 12% on a losing short trade.
But I’m aware shorting commodities is riskier when there's strong bullish positioning (as is the case with speculators now).
I will monitor upcoming COT reports and fundamentals closely — if speculators increase longs again, I might bail earlier or tighten stops.
Conclusion: The COT data does not overwhelmingly confirm a short at this moment. It offers partial support via hedger short positions, but speculator long bias remains strong. If price shows a credible technical rejection in the supply zone and sentiment shows cracks, I believe this short has good risk/reward.
Agape ATP Corporation (NASDAQ: ATPC) | Technical ReviewATPC has stabilised after earlier volatility, consolidating tightly between $1.20 (support) and $1.40 (near-term range ceiling). The chart shows repeated accumulation signals near support, suggesting steady buying interest. Momentum indicators are holding above midline levels, pointing to underlying strength despite the quieter price action.
A breakout above $1.60 (first resistance) could trigger renewed momentum towards $2.00 (major resistance), last tested in April–May. As long as $1.20 holds, the technical bias remains positive.
Investment Note
ATPC is in a constructive base-building phase. The downside appears limited by firm support at $1.20, while the upside potential is significant if it clears $1.60–2.00. With accumulation evident and volatility compressed, the stock offers a favourable risk-reward setup for speculative investors awaiting the next catalyst-driven move.

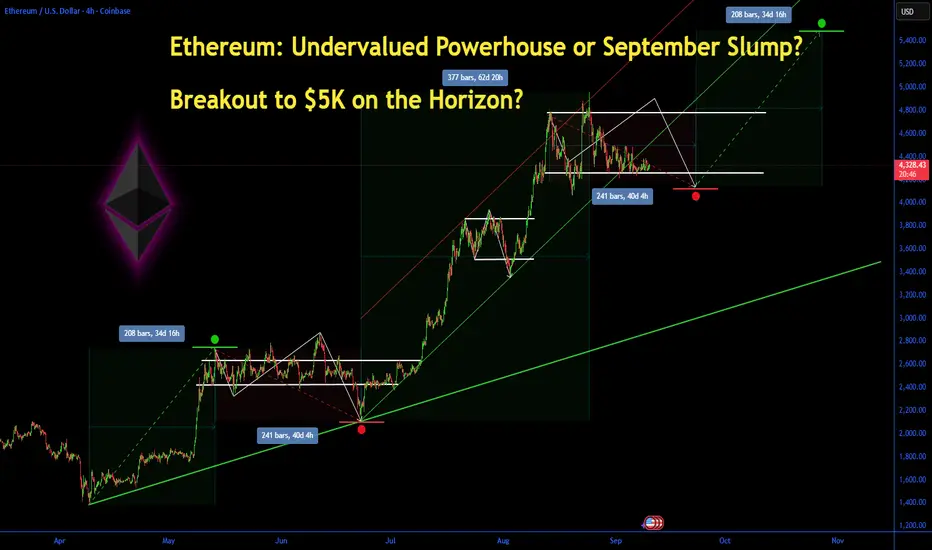
Ethereum: Undervalued Powerhouse or September Slump? Ethereum: Undervalued Powerhouse or September Slump? Breakout to $5K on the Horizon?
Ethereum (ETH) has held steady around $4,300 this month amid a choppy crypto market, down about 15% from its August all-time high but showing resilience with a modest 0.52% gain today to $4,328.5. Early September saw over $500 million in outflows from spot Ethereum ETFs, reversing summer inflows and fueling doubts about institutional appetite.
Yet, with analysts eyeing a potential rally to $9,000–$12,000 by year-end 2025 driven by ETF rotation and broader adoption, is ETH the undervalued blue-chip crypto ready for a rebound, or will seasonal weakness cap its upside? Let's dive into the fundamentals, charts, and key levels to navigate this pivotal moment.
Fundamental Analysis
Ethereum's core drivers remain tied to its ecosystem growth and macroeconomic tailwinds, but recent ETF flows have introduced volatility. As the backbone for DeFi, NFTs, and layer-2 scaling, ETH benefits from rising staking rewards and network upgrades like Dencun, which have boosted efficiency.
Analysts project ETH could hit $5,194 by late September, with long-term forecasts up to $12,000 in 2025 if institutional demand surges via ETFs. However, sticky inflation and Fed policy uncertainty could delay rate cuts, pressuring risk assets like crypto.
- **Positive:**
- Record ETF inflows in July–August signal growing institutional interest; recent positive territory returns hint at rotation back to ETH.
- Staking growth and adoption in DeFi (e.g., Aave, Uniswap) underscore undervaluation, with ETH's market cap at ~$520 billion versus Bitcoin's dominance.
- Broader trends like AI-blockchain integration and regulatory clarity (e.g., potential spot ETFs for challengers like Sui) bolster ETH's utility.
- **Negative:**
- $500M+ ETF outflows in early September reflect profit-taking and risk-off sentiment amid U.S. labor market weakness.
- Seasonal September weakness in crypto, compounded by geopolitical risks, could extend the correction if Bitcoin falters.
Technical Analysis
On the daily chart, ETH is coiling in a tight symmetrical triangle pattern after bouncing from the $4,320–$4,325 support base, with volume picking up on the upside. This consolidation follows a descending channel breakdown, but the hold above key EMAs suggests building momentum for a potential impulse wave higher. Current price: $4,328.5, with VWAP at $4,300 providing intraday support.
Key indicators:
- **RSI (14-day):** Hovering at 48, neutral but nearing oversold territory— a dip below 40 could signal a strong bounce. 📈
- **MACD:** Histogram in negative territory, but the signal line crossover is imminent, hinting at bullish divergence if volume confirms. ⚠️
- **Moving Averages:** Price above the 21-day EMA ($4,280) but testing the 50-day SMA ($4,350)—a sustained hold here avoids short-term bearish pressure.
Support/Resistance: Firm support at $4,320 (recent low and 200-day EMA), with major resistance at $4,500 (August high). Patterns/Momentum: The triangle apex nears; a bullish breakout above $4,500 could target $4,800–$4,952, while failure risks a retest of $4,200. 🟢 Bullish signals: Accumulation on hourly charts. 🔴 Bearish risks: Death cross if 50-day SMA flips below 200-day.
Scenarios and Risk Management
- **Bullish Scenario:** A clean break above $4,500 on ETF inflow news or positive macro data (e.g., softer PCE) targets $4,800 initially, then $5,000–$9,000 by Q4. Buy on pullbacks to $4,320 support for optimal entry.
- **Bearish Scenario:** Drop below $4,320 eyes $4,200 (psychological level); a full death cross could accelerate to $3,800. Avoid longs if Bitcoin slips under $60K.
- **Neutral/Goldilocks:** Range-bound $4,200–$4,500 if data remains mixed, ideal for scalping or options plays.
Risk Tips: Set stops 2–3% below support ($4,200) to cap losses. Risk no more than 1–2% of portfolio per trade. Diversify with BTC or stablecoins to hedge crypto correlations—avoid overexposure in this volatile September.
Conclusion/Outlook
Overall, a bullish bias emerges if ETH reclaims $4,500 and ETF flows reverse, positioning it as an undervalued play with 100%+ upside potential into 2025 amid institutional rotation.
But watch today's crypto volatility and upcoming Fed signals for confirmation—this fits the classic September Effect of weakness before Q4 rallies. What's your take? Bullish on ETH's rebound or sitting out the slump? Share in the comments!
Further rate cuts by the Fed could boost gold prices again.Gold prices fell on profit-taking after hitting a record high in the previous session as markets assessed the US Federal Reserve’s stance on further interest rate cuts.
The Fed on Wednesday made its first rate cut since December and left the door open for further easing, but warned of persistent inflation, raising doubts about the pace of future policy adjustments.
Gold, which typically performs well in low-interest-rate environments and periods of uncertainty, has gained nearly 39% so far this year.
In the short term, gold prices are under pressure to take profits after a series of consecutive increases in recent days and the market has reflected this in the price movements. However, in the long term, the Fed's further interest rate cuts - and the weakening USD - could push gold prices up again.
