USDJPY Breakout and Potential RetraceHey Traders, in today's trading session we are monitoring USDJPY for a selling opportunity around 148.300 zone, USDJPY was trading in an uptrend and successfully managed to break it out. Currently is in a correction phase in which it is approaching the retrace area at 148.300 support and resistance area.
Trade safe, Joe.
Technical Analysis

Dow Jones Potential DownsidesHey Traders, in today's trading session we are monitoring US30 for a selling opportunity around 44,300 zone, Dow Jones is trading in a downtrend and currently is in a correction phase in which it is approaching the trend at 44,300 support and resistance area.
Trade safe, Joe.

AUDUSD Breakout and Potential RetraceHey Traders, in today's trading session we are monitoring AUDUSD for a buying opportunity around 0.64700 zone, AUDUSD was trading in a downtrend and successfully managed to break it out. Currently is in a correction phase in which it is approaching the retrace area at 0.64700 support and resistance zone.
Trade safe, Joe.

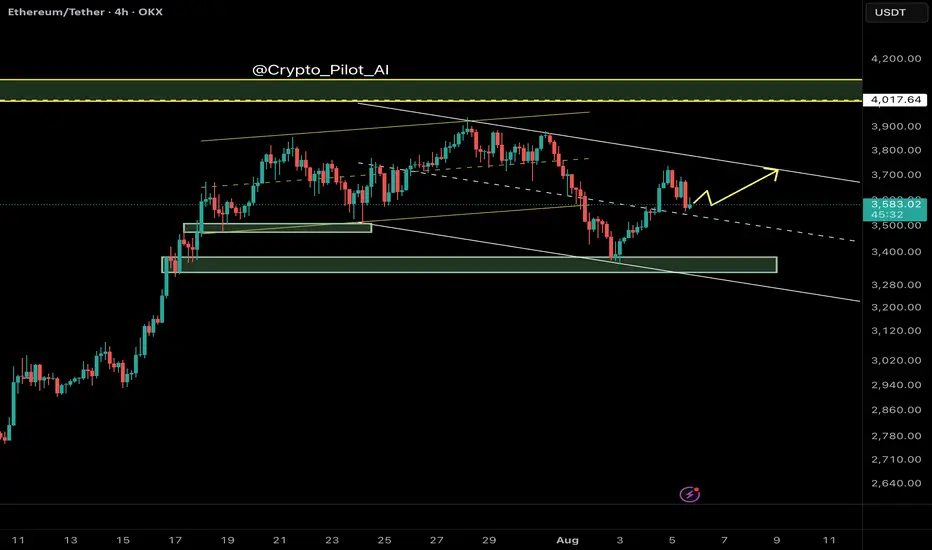
Ethereum (ETH/USDT) – Midline Break Retest and Channel Top in Si🔍 Technical Overview
Ethereum has recently broken above the midline of its descending channel, indicating a potential bullish shift within the short-term corrective structure. The price action suggests that we are currently witnessing a retest of the broken midline, which is now acting as dynamic support.
This behavior is consistent with smart money principles — where a previously broken internal structure gets tested before continuation.
⸻
🧠 NEoWave Context
Structurally, ETH appears to be developing a Contracting Corrective pattern, with the current leg likely evolving as Wave D. This wave typically exhibits strength and complexity, often stretching toward the channel top while still respecting broader consolidation boundaries.
⸻
💡 Smart Money Insights
• ✅ BOS already confirmed on LTF (1H, 4H) with higher lows
• 🔄 Price has reclaimed the internal broken structure (midline) and is retesting it
• 🔋 Bullish OB around $3,480–$3,510 acted as a launch zone for current leg
• 📍 Next resistance is the channel top near $3,740
⸻
📊 Trade Scenarios
🟩 Bullish Scenario (Preferred):
If the retest of the midline holds, ETH is likely to continue its move toward the upper boundary of the descending channel (~$3,730–$3,750). This aligns with Wave D expectations in complex corrections.
🟥 Bearish Invalidations:
A breakdown back below $3,520 and loss of the internal bullish structure would negate this short-term bullish scenario and reopen downside potential toward $3,350.
⸻
⚠️ Trader Tip:
Retests of internal structures like midlines or internal trendlines often provide low-risk continuation setups — if confirmed by bullish internal BOS.
⸻
✅ Conclusion
Ethereum remains technically corrective but with bullish momentum building within the channel. As long as the midline holds, we expect continuation toward the channel top, completing Wave D structure before potential reversal.
💬 Drop your alt counts or thoughts in the comments.
XAUUSD breaks out – bullish bias returnsGold has bounced from the bottom of the descending channel, initiating a clear upward move with a series of strong bullish candles. On the H2 chart, price has broken above the upper boundary of the medium-term downtrend channel and filled the nearest fair value gap, signaling a resurgence in buying pressure.
Current price action is approaching a previous resistance zone, aligned with recent swing highs. The chart suggests a potential consolidation before further upside, provided that the current bullish structure remains intact.
From a macro perspective, while the stronger-than-expected U.S. PMI data supports the USD in the short term, weak labor market figures and ongoing global geopolitical tensions continue to fuel demand for gold as a safe-haven asset. This environment is helping sustain XAUUSD’s current recovery structure.

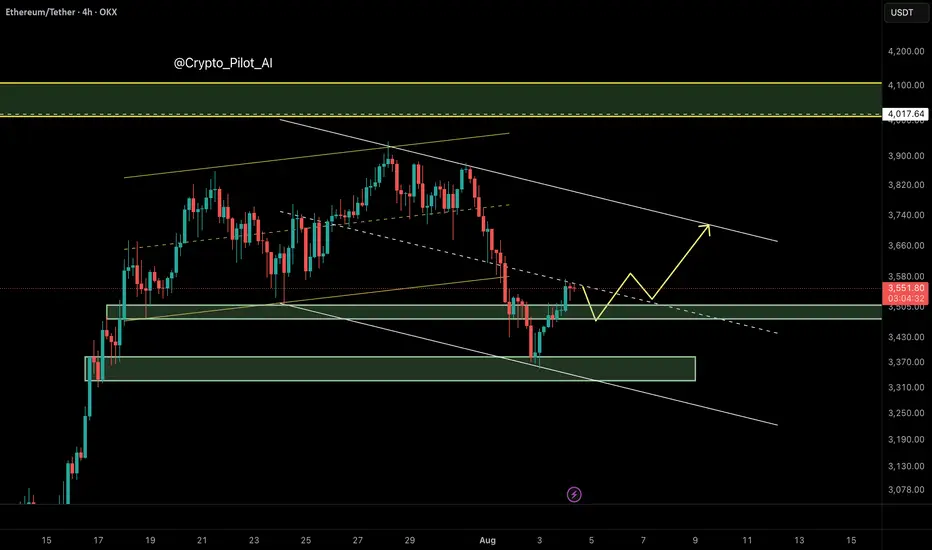
Ethereum (ETH/USDT) – Bearish Channel Structure Developing
⸻
🔍 Technical Overview
Ethereum has broken down from its ascending channel, invalidating the earlier bullish projection toward $4,000. After failing to hold the channel midline around $3,577, price dropped sharply to $3,360, forming a new bearish descending channel.
Currently, ETH is trading near the midline of this bearish channel, which typically acts as a decision point — not a buying zone — in smart money models.
⸻
🧠 NEoWave Interpretation
We may be inside a Complex Corrective Wave, possibly a Running or Contracting Flat evolving after the March top. The current structure resembles a B-wave trap, where price fakes out the upside before shifting momentum sharply downward. The break below the ascending channel midline confirms this bearish shift.
⸻
📊 Smart Money Summary
• 🟥 BOS confirmed on 1H and 4H (lower highs and lower lows)
• 🔻 Midline failure acted as a smart money trap, followed by a liquidity sweep below $3,490
• 📦 Bullish Order Block around $3,490–$3,520 has been tapped, prompting a minor reaction
• 🟡 Current resistance sits near the channel top ~ $3,715
⸻
🎯 Trade Scenarios
📌 Bearish Continuation:
If price fails to reclaim above $3,715, a retest and rejection from the channel top could trigger continuation toward $3,300–$3,250.
📌 Bullish Reversal (less likely for now):
Only a clean break and hold above $3,720 would suggest that bulls are regaining control, opening path toward $3,900–$4,000 — though this scenario is weakened after structural damage.
⸻
⚠️ Trader Tip:
Avoid buying into midline reactions in weak channels. Better long setups form after stop-hunts, ideally near bullish OBs + internal BOS confirmations.
⸻
✅ Conclusion
Ethereum remains under bearish pressure after losing its ascending structure. Unless price reclaims the $3,715 resistance zone with momentum, downside continuation remains likely.
⸻
📌 Save this analysis
💬 Share your thoughts or alt wave counts in the comments.
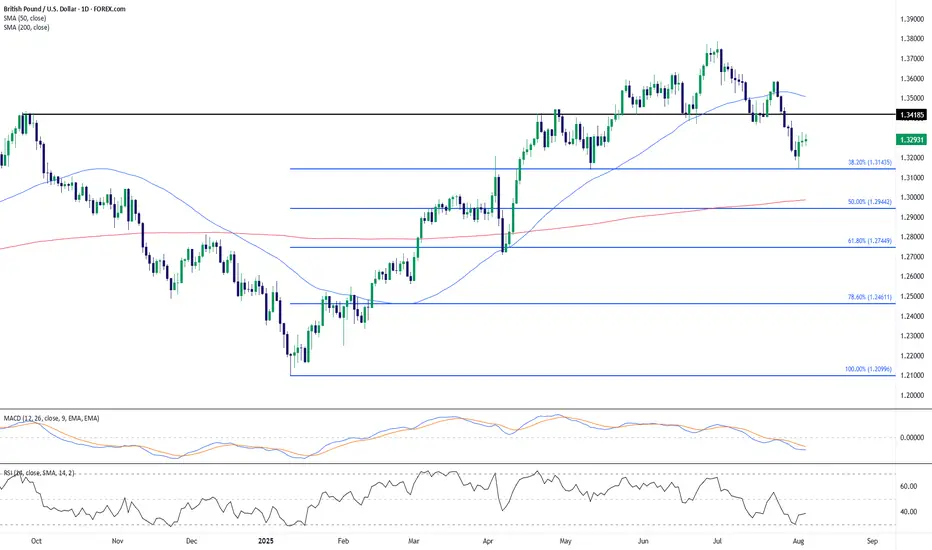
GBP/USD: Bullish Bounce from Fibonacci SupportCable has recently rebounded off the 38.2% Fibonacci retracement level around 1.3145, suggesting initial downside momentum is losing steam after the July high near 1.38. This bounce comes as RSI begins turning up from oversold territory (38.70), potentially hinting at early bullish divergence. Meanwhile, the MACD remains bearish, though its histogram shows signs of contraction.
Price action has slipped below the 50-day SMA (1.3508), but is still well above the 200-day SMA (1.2986), keeping the broader bullish structure intact. The area between 1.3145 and the 1.2940 (50% retracement) remains key support, while 1.3418 – a prior support now turned resistance – may act as a ceiling for any rebound attempts.
Key Takeaways:
Price has reacted positively to the 38.2% Fib level.
MACD remains weak but shows early signs of slowing downside.
RSI is attempting to reverse from near-oversold conditions.
1.3418 is the level to beat for bulls; below 1.3145 could open room to 1.2940.
Until we see a daily close above the prior support at 1.3418, upside may be limited to a corrective phase within a broader pullback. Short-term bullish attempts are likely to remain fragile unless supported by improving momentum and a reclaim of the 50-day SMA.
-MW
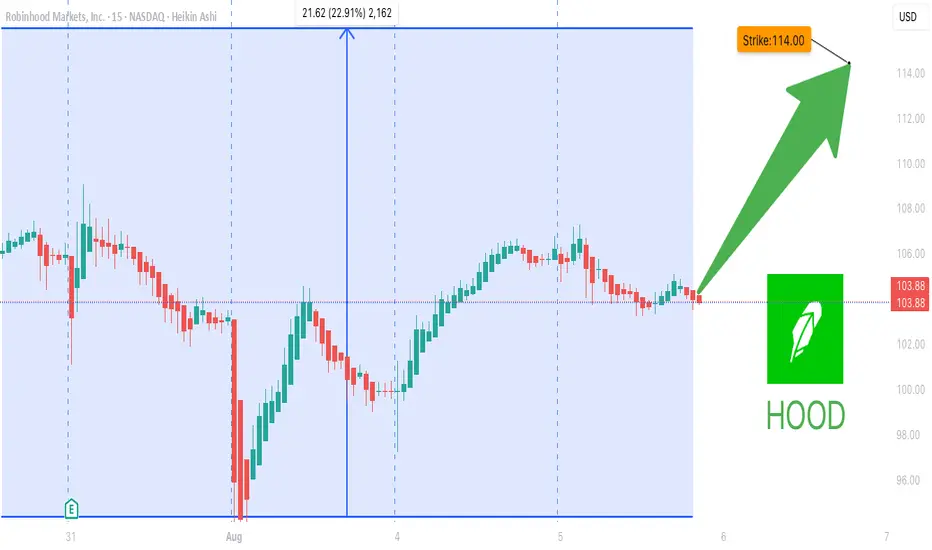
HOOD Lifetime Setup--Will You Miss It Again?### 🟢 **HOOD Options Flow Explodes: 2.05 Call/Put Ratio Sparks Bullish Firestorm 🔥**
**Will \$114 Be Breached This Week? Smart Money Thinks So.**
📈 **HOOD Weekly Options Breakdown – Aug 5, 2025**
---
#### 🔍 Market Snapshot:
* **Total Calls**: 178,756
* **Total Puts**: 87,243
* **C/P Ratio**: 2.05 → **BULLISH**
* **RSI**: Daily – 60.2, Weekly – 77.3 → **Uptrend Confirmed**
* **Volume**: 1.5x Previous Week → **Institutional Flow Detected**
* **Gamma Risk**: 🟡 Moderate
* **VIX**: 17.5 → Ideal for Weekly Plays
* **Time Decay**: 🔥 Accelerating
---
### 🧠 Consensus:
✅ All models confirm **strong bullish momentum**
⚠️ Some debate: Is rising volume accumulation or distribution?
---
### 🎯 Recommended Trade Setup:
> **Naked Call – HOOD \$114C (Exp: 2025-08-08)**
* **Entry**: \$0.79
* **Stop Loss**: \$0.40
* **Profit Target**:
* 🥇 Base: \$1.03 (+30%)
* 🥈 Stretch: \$1.58 (+100%)
* **Confidence Level**: 80%
* **Timing**: Enter @ market open
---
### 🔖 Tags (Hashtags for TradingView & Socials):
`#HOOD #OptionsFlow #CallOptions #BullishSentiment #WeeklyOptions #TradingStrategy #VolumeBreakout #RSI #Gamma #Robinhood #SmartMoneyMoves #HOODTradeIdea #TechnicalAnalysis #StockOptions #ViralTradeSetup`
GBPJPY: More Growth is Coming! 🇬🇧🇯🇵
GBPJPY will likely bounce from a key daily support,
following a formation of a double bottom pattern
on an hourly time frame.
I think that the price will reach 196.7 level soon.
❤️Please, support my work with like, thank you!❤️
I am part of Trade Nation's Influencer program and receive a monthly fee for using their TradingView charts in my analysis.

GBPUSD 4H: retest done - bearish continuation beginsOn the 4H chart, GBPUSD has completed a textbook head and shoulders pattern. The neckline has already been broken, and the price is now finalizing a retest around 1.3365–1.3380, where the 0.5 Fibo level also lies. This confirms a trend reversal, with the market preparing for the next leg down.
MA and EMA are above the current price, adding pressure to the downside. RSI remains neutral, and volume is shifting in favor of bears. The key resistance zone at 1.3365 has been tested from below, and the price is beginning to roll over - a classic bearish continuation signal.
Targets: 1.3240 first, then 1.3150 and potentially 1.2 870 if momentum builds. The invalidation point is a close above 1.3365, which is not likely at this stage.
Fundamentals support the move: the dollar remains strong as the Fed holds its hawkish stance, while the UK economy continues to show weakness across services and manufacturing.
Neckline broken ✅
Retest done ✅
Momentum building ✅
The setup is complete — time to follow the structure.

Crude Oil Resumes Its WeaknessCrude oil rised and then fell sharply from above 78 dollars back in June, after tensions in the Middle East. The drop unfolded as an impulse into wave A, so even if this is just a counter-trend move down from 78, it still appears incomplete. After we recently spotted a corrective rally in wave B that nicely stopped at projected $70 resistance near 61,8% Fibo. retracement, we can now see it resuming lower within projected wave C towards 60-59 area at least, if not even lower.

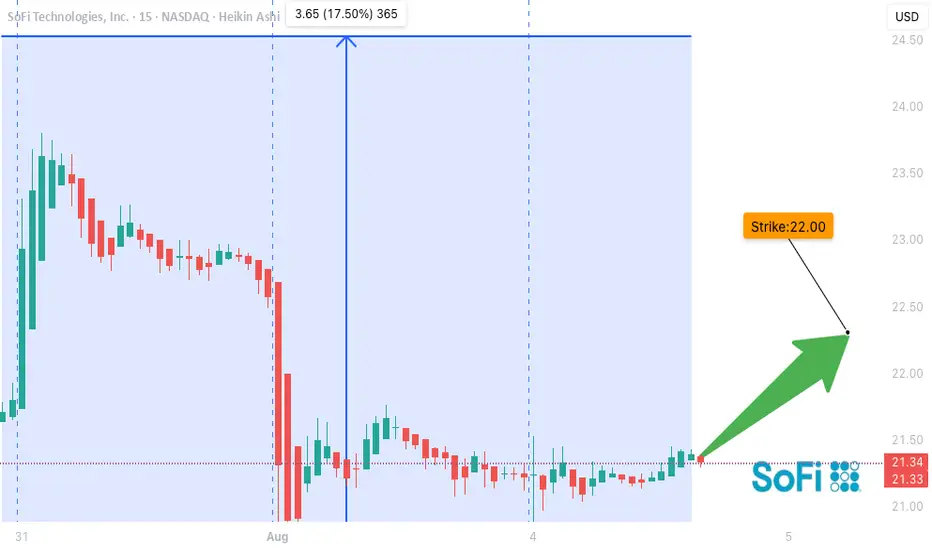
SOFI Setup Before Gamma Squeeze?
## 🐂 **SOFI WEEKLY OPTIONS BREAKOUT SETUP (Aug 4–8)**
**🔥 Bullish Momentum + Institutional Volume Surge = \$22 CALL in Play**
---
### 📌 Summary:
* **Weekly RSI** rising 📈
* **Volume** 2.5x average – strong institutional presence 🏦
* **Options Flow** favors calls: aggressive accumulation
* **Gamma Risk** into Friday + VIX stable ✅
* **Daily RSI** soft = potential dip before rip
---
### 🛠️ Trade Setup:
| Type | Direction | Strike | Expiry | Entry | Stop | Target | Confidence |
| ------ | --------- | ------- | ------ | ------ | ------ | ------ | ---------- |
| Option | CALL | \$22.00 | Aug 8 | \$0.34 | \$0.17 | \$0.68 | 70% ✅ |
💡 **Watch for breakout over \$21.50** — potential gamma squeeze to \$23+
📉 Manage risk below \$21.00 / VIX spike
⚠️ Earnings & macro could add volatility
---
### 🧠 Model Consensus:
* **Grok/xAI**: Strongly bullish, confirms flow & breakout potential
* **Claude & Meta**: Volume confirms upside, but caution on RSI
* **Gemini**: Neutral on daily, bullish long-term
* **DeepSeek**: Momentum trend intact, supports call strategy
---
### 📊 Tag Zone:
`#SOFI #Options #TradingView #Bullish #GammaSqueeze #CallOption #VolumeBreakout #WeeklySetup #MomentumTrading #SmartMoney`
SOLUSDT 1D - Bulls back in control with Golden Cross and channelOn the daily chart, SOLUSDT is forming a bullish continuation structure. After the Golden Cross (MA50 crossing MA200), the price is now pulling back toward the midline of the ascending channel and the 0.5 Fibonacci level at 166.38. This confluence with the broken trendline and 200 EMA makes this zone a prime technical area of interest.
Support: 166.38 (0.5 Fibo), EMA200 (161.77), broken trendline
Resistance: 182.84–189.67 (Fibo 0.705–0.79), 206.54, target - 255.93 (Fibo 1.618)
This retracement looks healthy, supported by higher volume during the prior bullish leg. As long as the 166.38–161.77 zone holds, continuation toward 206.54 and potentially 255.93 is on the table.
Fundamentally, Solana remains a key L1 narrative with strong traction in DePIN and AI-linked dApps. The rising TVL and investor sentiment support the trend.
Watch price action around 166 for confirmation - this is the battleground.

MarketBreakdown | EURCHF, WTI CRUDE OIL, GBPNZD, DXY
Here are the updates & outlook for multiple instruments in my watch list.
1️⃣ #EURCHF daily time frame 🇪🇺🇨🇭
The market is testing a strong supply area
based on a solid falling trend line and a horizontal resistance.
Probabilities will be high that the price will retrace from that.
2️⃣ CRUDE OIL #WTI daily time frame 🛢️
The price is very close to a significant demand zone
based on a horizontal support cluster and a rising trend line.
I will expect a bullish reaction to that.
3️⃣ #GBPJPY daily time frame 🇬🇧🇳🇿
The market is trading within a contracting triangle.
The price nicely respected its support line and goes up steadily.
I think that bullish momentum will remain strong and the market
will go up to the resistance line of a triangle.
4️⃣ DOLLAR INDEX #DXY daily time frame 💵
The market is consolidating on a key daily support cluster.
Probabilities will be high that the price will bounce from that.
Today's fundamental news can be a trigger.
Do you agree with my market breakdown?
❤️Please, support my work with like, thank you!❤️
I am part of Trade Nation's Influencer program and receive a monthly fee for using their TradingView charts in my analysis.

GOLD: Bulls Testing the Top of the RangeGold is attempting to break above the well-established horizontal resistance near $3,430, which has capped price action since April. The metal continues to respect its ascending trendline from the December 2024 low, supported by the rising 50-day SMA ($3,344). The lower boundary of the consolidation range is marked near $3,245, making this a textbook triangle/range structure within a broader uptrend.
Momentum indicators support the bullish case:
MACD has crossed bullish above the signal line, although still near the zero line.
RSI is rising and sits at 55.46, showing room for further upside before entering overbought territory.
If bulls succeed in securing a daily close above $3,430, this would confirm a bullish breakout from multi-month consolidation, potentially opening the door to a fresh leg higher. On the downside, any failure to break out cleanly may lead to a retest of the ascending trendline and the $3,245 support area.
Summary:
Gold remains in an uptrend and is challenging the top of a 4-month range.
Break above $3,430 would signal bullish continuation.
MACD and RSI both point to building momentum.
Support lies at $3,344 (50 SMA) and $3,245 (range low).
Patience is key here—traders may wait for confirmation of a breakout or watch for rejection candles near resistance to determine the next directional bias.
-MW

Nightly $SPY / $SPX Scenarios for August 6, 2025🔮 Nightly AMEX:SPY / SP:SPX Scenarios for August 6, 2025 🔮
🌍 Market‑Moving News 🌍
🪙 Citi Lifts Gold Price Forecast Amid Global Uncertainty
Citi raised its short-term gold outlook to $3,500/oz, citing surging safe-haven demand driven by trade instability, softening labor metrics, and heightened geopolitical risk. Risk premiums and volatility remain elevated.
📉 Equities Tumble as Risk Aversion Returns
U.S. stocks slipped on renewed caution—investors rotated into bonds and precious metals following weaker job indicators and escalating trade friction. The dollar and gold strengthened, while equity futures pulled back.
📊 Key Data Releases & Events 📊
📅 Wednesday, August 6:
No major U.S. economic data releases scheduled for today. Markets are closely monitoring corporate earnings reports and commentary from Fed officials, including San Francisco Fed President Mary Daly later in the day.
⚠️ Disclaimer:
This content is for educational and informational purposes only—it is not financial advice. Always consult a licensed financial advisor before making investment decisions.
📌 #trading #stockmarket #economy #trade #currency #gold #earnings
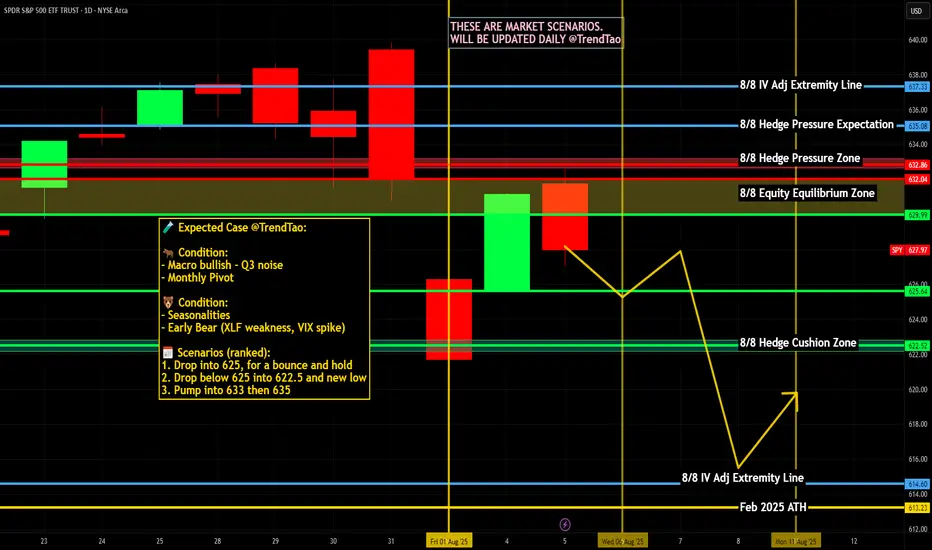
Nightly $SPY / $SPX Scenarios for August 5, 2025🔮 Nightly AMEX:SPY / SP:SPX Scenarios for August 5, 2025 🔮
🌍 Market‑Moving News 🌍
🔹 PBOC Moves Prompt FX Backlash
On August 5, 2019, China’s central bank allowed the yuan to depreciate over 2% to its lowest level since 2008. That same day, the U.S. Treasury officially designated China as a currency manipulator, citing the PBOC’s moves as retaliation for recent U.S. tariff actions. In response, China ordered state-owned enterprises to suspend purchases of U.S. agricultural goods—a significant blow to U.S. exporters.
🔹 EU Suspends Counter-Tariffs for Six Months
Following a negotiated framework with the U.S., the European Union suspended retaliatory tariffs on U.S. goods for six months. The move aims to de-escalate trade tensions while joint discussions continue.
🔹 Citi Raises Gold Price Outlook to $3,500/oz
Citi revised its short-term trading range for gold to $3,300–$3,600 per ounce, based on weakening U.S. labor data, rising inflation pressure from tariffs, and growing demand for safe-haven assets. Spot gold traded around $3,356 oz on Monday.
📊 Key Data Releases & Events 📊
📅 Tuesday, August 5:
8:30 AM ET – U.S. Trade Balance (June)
Expected to improve modestly to –$67.6 billion (from –$71.5B), reflecting tariff-influenced shifts in import/export volumes.
9:45 AM ET – S&P Global U.S. Final Services PMI & ISM Non-Manufacturing Index (July)
Key indicators of service-sector strength. Readings above 50 suggest expansion; below 50, contraction. Flash estimates forecast moderated growth in activity.
⚠️ Disclaimer:
This content is for educational and informational use only—not financial advice. Consult a licensed financial advisor before making investment decisions.
📌 #trading #stockmarket #economy #trade #data #inflation #currency

NVTS Tight Coil Before Earnings## ⚡️ \ NASDAQ:NVTS WEEKLY TRADE IDEA (AUG 5–9)
**🔥 STRONG BULLISH FLOW | CALL/PUT: 5.24 | EARNINGS INCOMING**
---
### 🔍 SENTIMENT SNAPSHOT
* 📈 **Daily RSI**: 59.2 — Bullish
* 📅 **Weekly RSI**: 71.4 — Strong momentum
* 🔻 **Volume**: 0.7x — Weak institutional follow-through
* 🔔 **Earnings Risk**: HIGH — Earnings expected Aug 5
* 🧠 **Model Consensus**: Bullish, but cautious on binary event
---
### 💡 TRADE SETUP
| 🔹 | Trade Type | Long Call |
| -- | -------------- | --------------- |
| 🎯 | **Strike** | **\$8.50** |
| 📅 | **Expiry** | **Aug 8 (Fri)** |
| 💵 | **Entry** | **\$0.55** |
| 📈 | **Target** | **\$1.50** |
| 🛑 | **Stop** | **\$0.30** |
| 📏 | **Size** | 1 contract |
| ⚖️ | **Confidence** | 70% |
---
### ⚠️ TRADE NOTES
* 🚨 Earnings volatility could create gaps — plan around Aug 5
* 📉 Low volume = reduced follow-through risk
* ⏰ Very short expiry = high gamma exposure
---
### 🧩 STRATEGY CONTEXT
> “Momentum is real, but earnings are the wildcard. Size light. Stay nimble.”
📍 Enter: At market open Monday
🔍 Watch: Post-earnings price action + volume spike
📊 Manage: Tight stop, scale out if it rips pre-earnings
---
💬 Playing NVTS this week?
🔥 Comment “NVTS” if you’re watching this setup
🔁 Repost if you’re riding earnings momentum

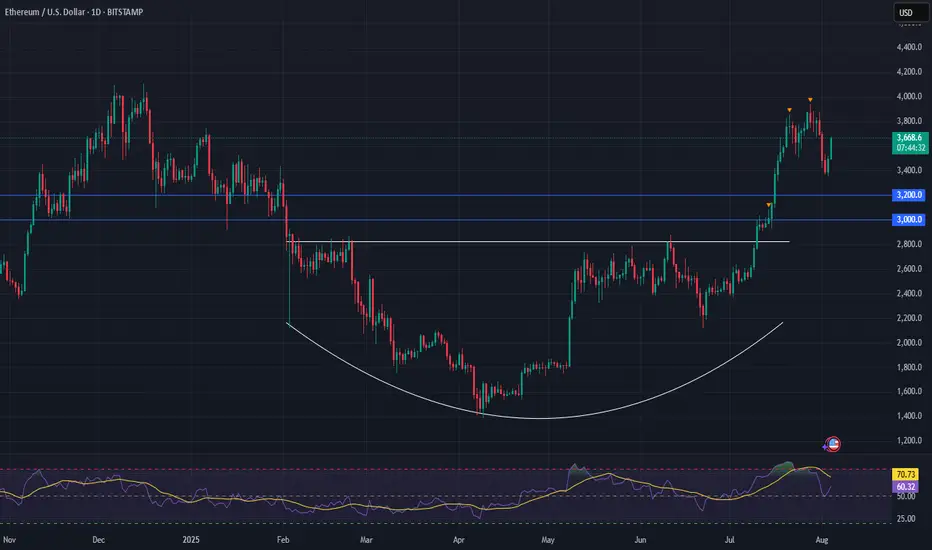
Ethereum (ETH) is setting up for a powerful moveFollowing a strong breakout, ETH has entered a healthy consolidation phase—setting the stage for its next leg higher.
Momentum remains firmly on the bulls’ side, with the breakout from a long-term saucer pattern fueling continued upside pressure.
📈 Technical Highlights:
✅ Short-term target: $4,000+ (breakout continuation)
✅ Long-term potential: $7,000+
🛡️ Key support: $3,000–$3,200 (bullish as long as this holds)
📣 Takeaway:
Ethereum is showing classic bullish structure. With higher-lows forming and strong support below, pullbacks are likely to offer high-probability entries for both traders and long-term holders.
#Ethereum #ETHUSD #Crypto #Trading #TechnicalAnalysis #CryptoTrading #EthereumPrice #Altcoins #Bullish #Breakout
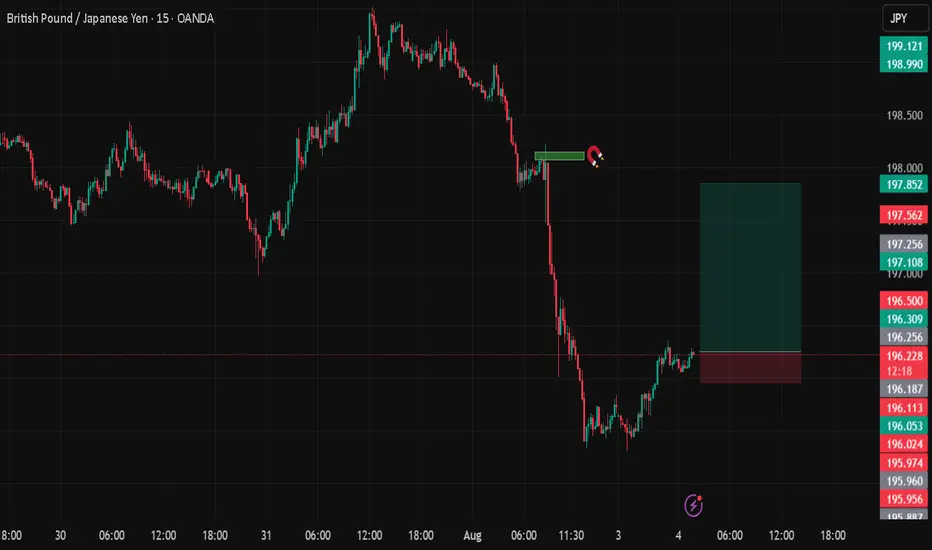
GBPJPYDate:
August 3,2025
Session:
Tokyo Session
Pair:
GBPJPY
Bias:
Long
Fridays New York open left a liquidity pool. I see todays Asia or London session sweeping that area.
Entry:196.254
Stop Loss:195.957
Target:197.847
RR:5.32
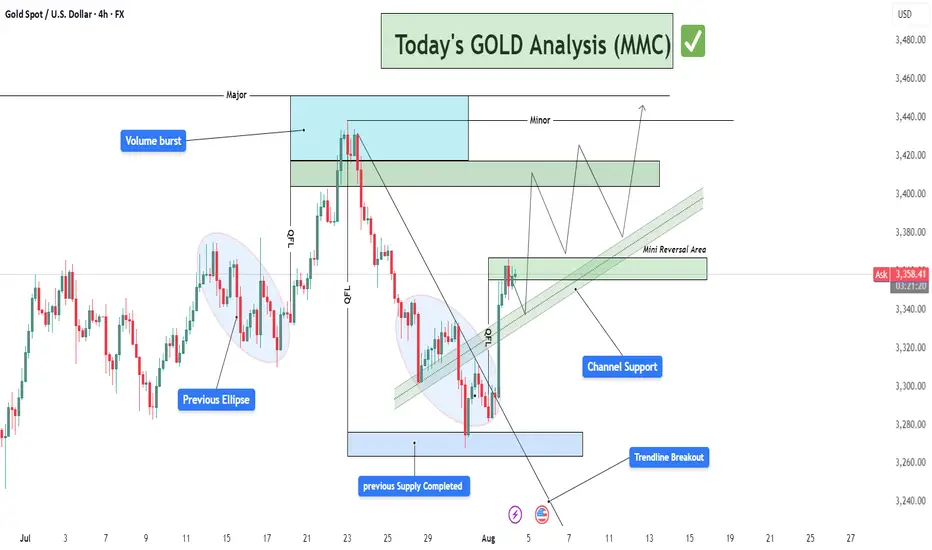
Today's GOLD Analysis : MMC Structural Analysis + Reversal ZoneThis analysis is rooted in MMC – Mirror Market Concepts, a framework designed to track institutional behavior through liquidity patterns, QFL (Quick Flip Levels), trendline shifts, and volume bursts. The current 4H Gold chart demonstrates a smart money footprint that provides actionable insight for intraday and swing traders.
🔍 Detailed Technical Breakdown:
🟦 1. Previous Supply Completed | Demand Zone Reversal
At the lower end of the chart, price entered a key blue zone around $3,250–$3,280, previously a supply zone now flipped into demand. This zone represents where institutional buyers absorbed liquidity, forming the base for a bullish impulse.
The strong reaction from this zone, marked by long-wick candles and immediate reversal, indicates exhaustion of selling pressure.
This reversal is confirmed by a QFL structure, meaning price created a fast liquidity sweep before flipping direction.
MMC recognizes this as a high-probability area of reversal, a point where smart money typically enters.
📈 2. Trendline Breakout & Structure Shift
A descending trendline, representing bearish market control, was decisively broken to the upside. This shift marks:
End of the corrective phase
Beginning of a bullish structural change
Buyers now control the short-term narrative
The breakout was not only clean but also supported by a volume burst, which is a classic MMC indicator that institutional traders are entering the market.
🔶 3. Volume Burst Confirmation
Volume behavior plays a critical role in MMC. We see a clear volume spike post-breakout. This suggests that:
The breakout is not false
Buyers were aggressively positioned
A sustainable move is in development
This supports the validity of the trendline breakout and confirms the idea that price is ready to test higher liquidity zones.
🟢 4. Current Price Structure: Bullish Channel
After the breakout, the market formed a bullish channel, where price is steadily climbing while respecting parallel boundaries.
The channel support line acts as a dynamic entry point for retracement buys
MMC strategy uses this structure to identify scaling entries at channel lows or after successful pullbacks into key reversal zones
🟩 5. Mini Reversal Area (Short-Term Resistance Zone)
Price is currently testing a minor supply zone or what MMC defines as a "Mini Reversal Area". This is a reaction zone before continuing toward the major target above.
There are two possible reactions:
Short-term rejection, leading to a pullback into the lower channel support zone
Minor consolidation, forming a base for a breakthrough toward major resistance
🟦 6. Major & Minor Supply Zones Above
Marked in light blue and green, these zones represent areas where previous selling volume and distribution occurred.
The major supply zone (approx. $3,440–$3,470) is the next institutional target
The minor zone sits between $3,400–$3,420 and may cause initial resistance or a base for another impulse
These levels are prime for partial profit-taking or scouting short-term reversal trades.
📊 Trade Management Insights:
🛒 Buy Opportunities (Long Bias):
On pullback into channel support near $3,340–$3,350
On bullish confirmation from mini reversal area
On break and retest above minor resistance at $3,420
🛑 Stop-Loss Suggestion:
Below the channel support or below the blue demand zone (approx. $3,245)
🎯 Profit Targets:
TP1: $3,400 (first resistance)
TP2: $3,420 (minor supply)
TP3: $3,450–$3,470 (major institutional level)
🧠 Mirror Market Concepts (MMC) Highlights:
QFL Structures = Institutional Reversal Points
Volume Burst = Confirmation of Breakout Validity
Trendline Breakout = Momentum Shift
Channel Structure = Controlled Climb Pattern
Mini Reversal Zone = Key Decision Point Before Continuation
🧭 TradingView Summary for Minds Community:
This GOLD chart beautifully aligns with the MMC method — spotting smart money involvement early and aligning with their flow. After confirming structural reversal via trendline and QFL, the setup now looks poised for continuation toward the $3,440–$3,470 zone, making it a perfect chart to watch for buy-the-dip setups.
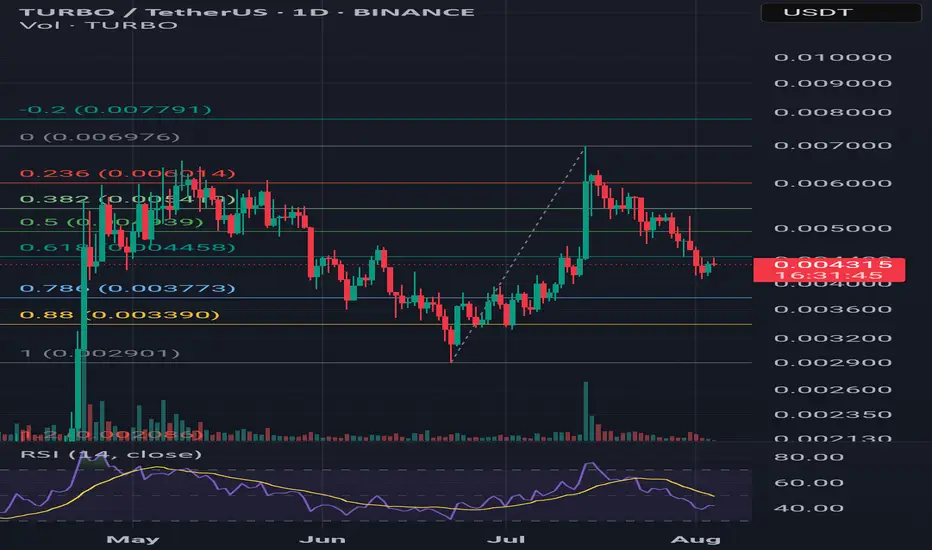
TURBO/USDT – Cup and Handle Formation (1D Chart)Overview:
TURBO/USDT is potentially forming a textbook Cup and Handle pattern on the 1-day chart. Price action suggests a rounded bottom (the “cup”) followed by a consolidation range (the “handle”), setting up for a possible breakout.
---
🔍 Pattern Structure:
- Cup Formation:
Price rallied from ~0.0029 to ~0.0060 USDT, retracing slightly from the top. This rounded rise resembles the classic cup shape.
- Handle Formation:
Recent price consolidation between 0.0042–0.0049 USDT hints at the formation of the handle. A breakout above resistance could validate the pattern.
---
📈 Key Technical Levels:
Entry Zone | 0.0047 – 0.0050 |
| Resistance (Breakout)| ~0.0060 |
| Target 1 | ~0.0064 |
| Target 2 | 0.0078 – 0.0084 |
| Stop Loss | Below 0.0042 |
🔄 Additional Indicators:
- Volume: Watch for increasing volume to confirm breakout momentum.
- RSI (14-day): Neutral zone with room for upward movement. Momentum is building.
- Fibonacci Levels: 0.618 retracement (~0.004458 USDT) has acted as a key support during handle formation.
---
💡 Idea: Monitor for a daily close above 0.0060 with volume confirmation. That could mark the beginning of a bullish continuation. Risk management is essential if price fails to hold above the handle support.
XAU/USD Intraday Plan | Support & Resistance to WatchGold is holding above the $3,369 level after rejecting from the $3,387 resistance zone. Price action remains bullish for now, with structure supported by the rising 50MA, which is acting as dynamic support.
To extend higher, bulls need a clean break and hold above $3,387, which would open the path toward $3,422 next.
If price fails to hold above $3,369, we could see a pullback into the $3,358–$3,344 zone, which remains the first key support. Below that, the next area of interest is the Pullback Zone at $3,329–$3,313 — a former resistance turned support, and a likely area for dip-buying interest.
A break below that would shift focus to the Secondary Support Zone at $3,295–$3,281, where price last launched its breakout.
📌 Key Levels to Watch
Resistance:
‣ $3,387 ‣ $3,422
Support:
‣ $3,369 ‣ $3,358‣ $3,344‣ $3,329–$3,313‣ $3,295–$3,281
🔎Fundamental Focus:
No high-impact data today, but markets may remain reactive.
