EURGBP Short, 24 July Playing Off 15m POI After HTF Wick Rejection
HTF shows strong rejection from Weekly Highs with clear wick activity, and price tapped into a 4H Orderblock 📉
Structure shifted bearish on LTF with a clean 15m BOS — the last OB from the full move is now in play.
Asia high sits above and can’t be covered with a 10 pip stop, so I used a tighter 5 pip SL to cover just the OB (high probability since no key zones sit above) ✅
📉 Confluences:
– Weekly High wick rejection
– 4H OB tapped
– 15m BOS
– 1m BOS from 15m POI
– Entry from cleaner 5m OB inside 15m OB
🎯 TP: Targeting Asia Low
💰 RR: 5 pip SL improves RR since GU moves slow
🛡️ SL: Tight stop covering only the OB — if invalidated, setup likely fails anyway
Technical Analysis

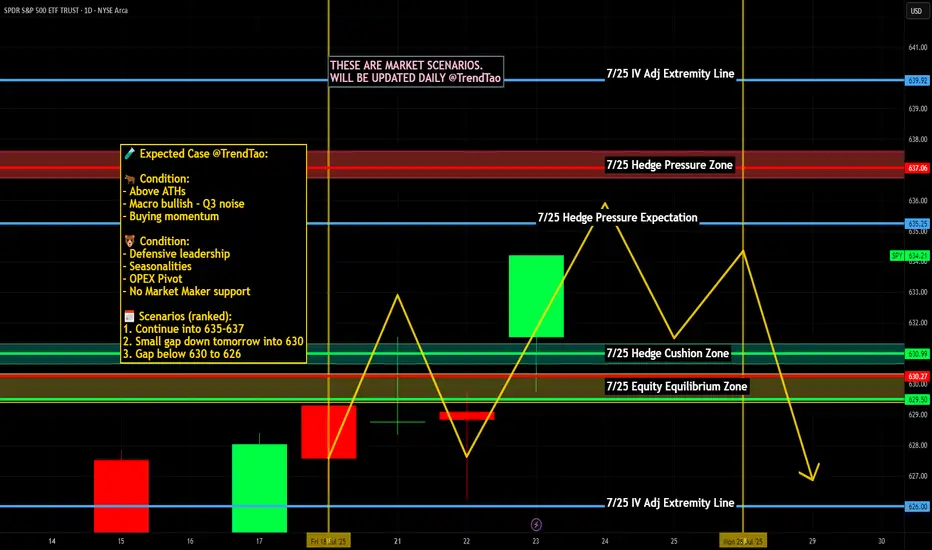
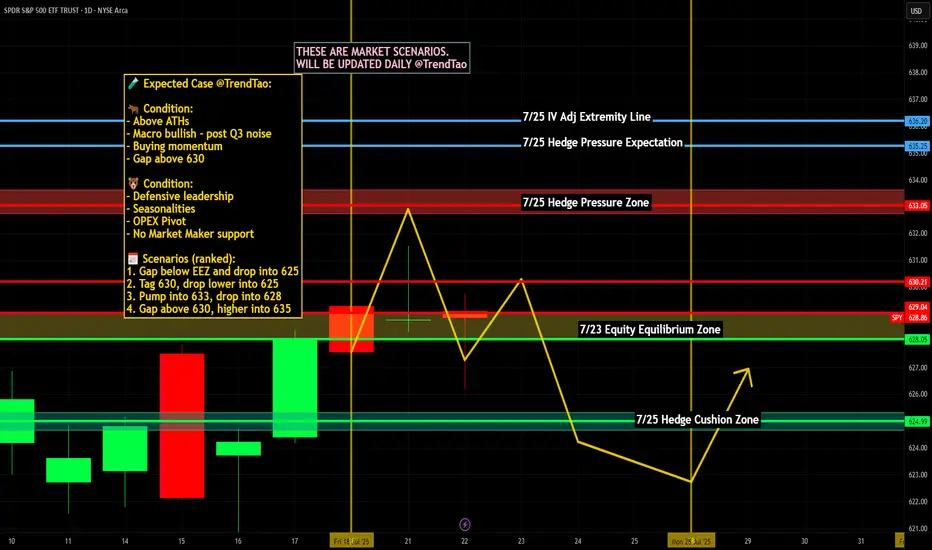
Nightly $SPY / $SPX Scenarios for July 24, 2025🔮 Nightly AMEX:SPY / SP:SPX Scenarios for July 24, 2025 🔮
🌍 Market-Moving News 🌍
🤝 U.S.–EU & U.S.–Japan Trade Optimism Lifts Sentiment
The S&P 500 and Nasdaq hit record-high closes on July 23, fueled by optimism over a potential U.S.–EU trade deal mirroring the U.S.–Japan framework, with the EU-set tariff on autos potentially halved to 15%
💵 Dollar Retreats, Yields Climb
As markets shifted toward risk assets, U.S. Treasury yields increased and gold softened, while the dollar eased—highlighting growing confidence in trade-driven growth news
🏦 Fed Independence Under Pressure—But No July Cut Expected
A Reuters poll shows economists see heightened political pressure on the Fed jeopardizing its independence, though the consensus remains that rates will stay unchanged this month
📊 Key Data Releases & Events 📊
📅 Thursday, July 24:
8:30 AM ET – Initial Jobless Claims
Weekly tally of new unemployment benefit applications—key indicator of labor-market conditions.
10:00 AM ET – New Residential Sales (June)
Tracks signed contracts for new homes, offering insight into housing demand under tightening mortgage rates.
All Day – Trade Headlines & Fed Watch
Continued focus on U.S.–EU trade developments and any follow-up to Fed independence concerns from policy circles.
⚠️ Disclaimer:
This information is for educational and informational purposes only—not financial advice. Please consult a licensed financial advisor before making investment decisions.
📌 #trading #stockmarket #trade #economy #Fed #housing #jobs #technicalanalysis
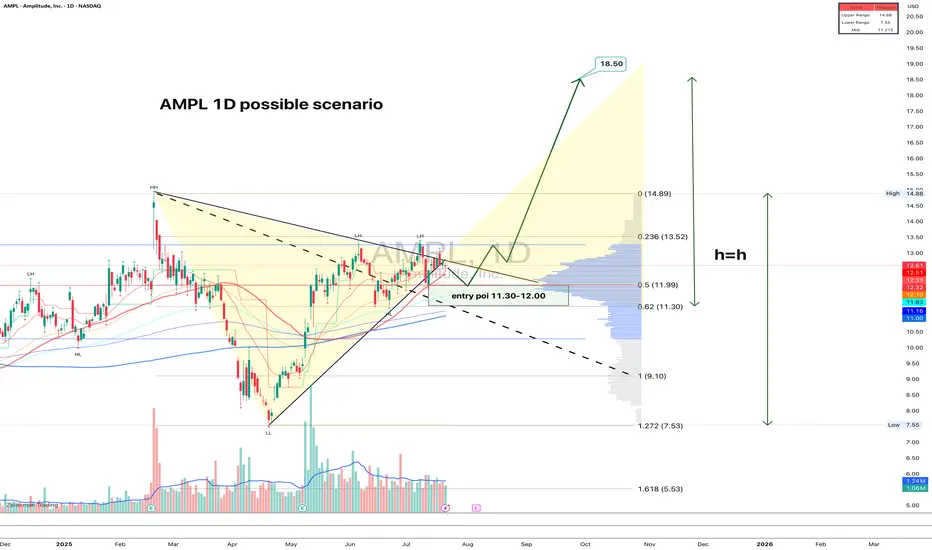
AMPL: structure clean, volume right, fundamentals warming upAMPL just broke out of a symmetrical triangle on the daily chart. The breakout was confirmed with decent volume, and now price is calmly pulling back into the 11.30–12.00 zone — exactly the kind of textbook retest that gets serious traders interested. The 0.618 Fib level sits at 11.30, and 0.5 at 11.99, strengthening this entry area. Volume has tapered off post-breakout, which is typical before a continuation. Moving averages are stacked bullish, confirming the trend shift. First upside target is 13.52, followed by 14.89, and if the full h = h move plays out, price could reach 18.50. A natural stop sits just below 11.00. Clear structure, solid risk control — this is one of those setups that checks all the boxes.
On the fundamental side, Amplitude remains a key player in product analytics and digital optimization. After a slow 2024 marked by cost-cutting and stagnating revenue, the company is showing early signs of recovery this year. The broader SaaS market has stabilized, and AMPL is benefiting from renewed enterprise demand, especially for AI-driven user behavior analytics. Recent earnings came in better than expected, and institutional interest has quietly returned. Valuation is still moderate at these levels, giving it room to re-rate if momentum builds.
A clean breakout with technical alignment and an improving macro picture - when both sides of the story match, it's worth paying attention.
Gold Ends Rally, Focus Shifts to Fed MeetingGold slipped, snapping a three-day rally. The retreat came after the U.S. struck trade agreements with Japan, the Philippines, and Indonesia, easing safe-haven demand. The latest deal with Japan includes 15% tariffs and expanded U.S. access. Still, unresolved tensions with the EU and anticipation ahead of next week’s Fed meeting are keeping investors on edge.
Resistance is at $3,400, while support holds at $3,375.

Pound Hits $1.35 on Weaker DollarThe pound climbed to $1.35, supported by a weaker dollar and cautious positioning ahead of the August 1 U.S. tariff deadline. Investors expect UK economic data to show improving momentum, while the Bank of England may scale back bond sales due to weak demand. Despite the optimism, markets still price in two BoE rate cuts in 2025.
Resistance stands at 1.3550, with support at 1.3380.

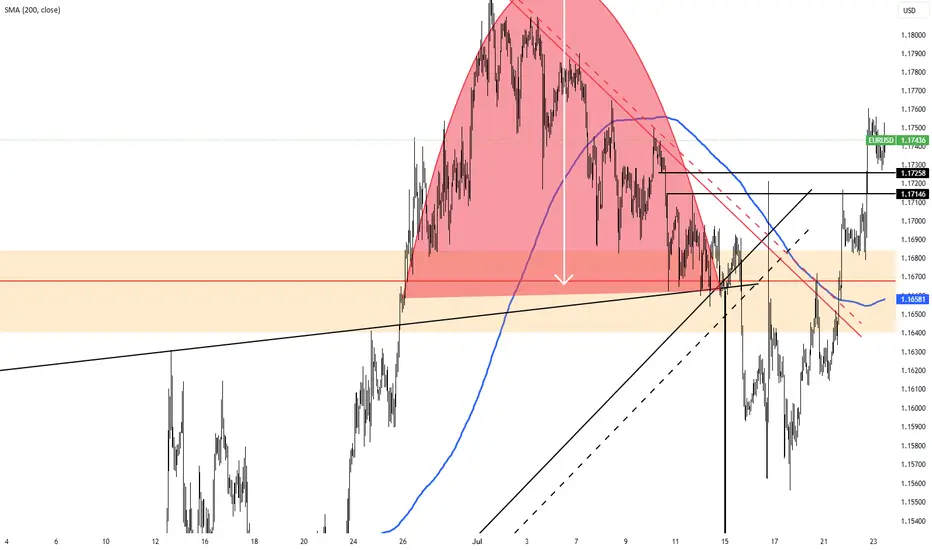
Euro Steady at $1.17 as ECB Holds FireThe euro hovered near $1.17 as traders awaited Thursday’s European Central Bank decision. With rates expected to remain steady following eight consecutive cuts, policymakers tread cautiously amid strength in the euro and lingering U.S. tariff uncertainty. Meanwhile, EU officials are preparing contingency plans in case trade negotiations with President Trump collapse before the August 1 deadline.
Resistance for the pair is at 1.1830, while support is at 1.1660.
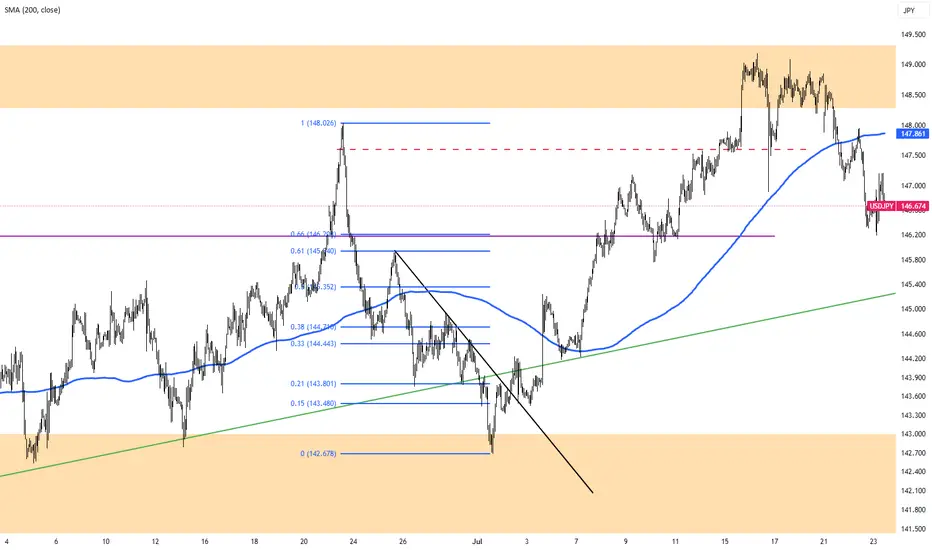
US-Japan Deal Supports YenThe yen held firm near 146.5 per dollar, its highest level in two weeks, after President Trump announced a trade agreement with Japan featuring 15% tariffs on exports. Japan, in turn, pledged $550 billion in U.S. investments and increased access for American goods. Prime Minister Ishiba’s lack of details and speculation about his possible resignation add further political uncertainty, especially after the coalition’s upper house defeat.
Resistance is at 147.75, with major support at 146.15.
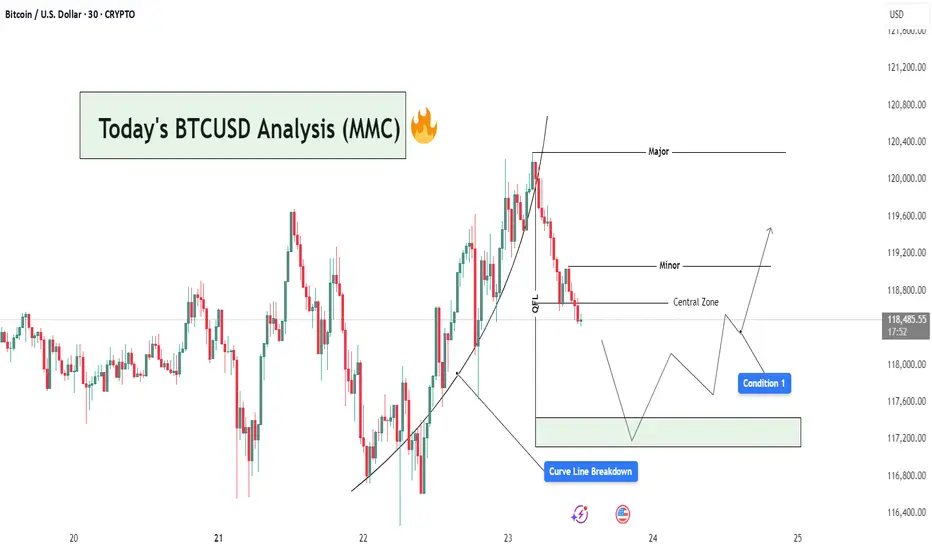
BTCUSD Analysis : Curve Line Breaked and Move Towards Target📊 Market Overview:
BTCUSD has recently completed a strong bullish leg, following a parabolic curve formation that led price into a Major Resistance Zone near the $120,400 level. This rally aligns with MMC principles where price forms momentum-driven structures before reaching high-liquidity zones (often ending in exhaustion).
📍 1. Curve Line Support & Breakdown – A Shift in Sentiment
Your chart shows a clear Curve Line that supported the bullish impulse. Price respected this dynamic support throughout the uptrend until a Curve Line Breakdown occurred—marking the first sign of bullish weakness.
In MMC strategy, this curve structure breakdown is critical:
It tells us the accumulation → expansion → exhaustion cycle is ending.
The market is likely entering retracement or distribution phase.
Price often seeks lower equilibrium, typically around the Central Zone.
🧠 2. QFL Zone (Quick Flip Level) – The Hidden Base
Immediately after the curve broke, price moved toward the QFL level, which represents a demand base from earlier structure. This zone acts as a short-term support and often produces a reactive bounce (but not always a reversal).
Watch closely:
If price respects this zone → temporary relief bounce
If it fails → we’ll likely see full test of Central Zone or lower demand levels
🟩 3. Central Zone – The MMC Decision Area
The Central Zone is a key horizontal level on your chart, defined between ~$117,300 and ~$118,200. This zone is marked based on:
Previous structure
Volume clusters
Demand imbalance
Why is this zone important?
It serves as the balance point between buyers and sellers.
A bullish reaction here could re-initiate a move toward Minor Resistance (~$119,200).
A failure to hold could open the door for deeper retracement toward the green demand box (~$117,200 or below).
🔄 4. Two Primary MMC-Based Conditions to Watch:
✅ Condition 1: Bounce from Central Zone
Price reacts from within the Central Zone
Forms bullish structure (double bottom, bullish engulfing, or reversal wick)
Short-term target becomes Minor Resistance (~$119,200)
If volume increases and price breaks above Minor, continuation toward Major is possible
❌ Condition 2: Breakdown & Bearish Continuation
Price fails to hold within Central Zone
Bearish structure forms (e.g. lower highs, breakdown candles)
Clean move expected toward next liquidity pocket at $117,200–$116,800
This would confirm market shifting into bearish control
📌 5. Minor vs Major Levels – Key Zones
Minor Resistance (~$119,200): Short-term target if bounce occurs
Major Resistance (~$120,400): Liquidity sweep zone, strong supply
Green Demand Box (~$117,200): If Central Zone fails, this becomes next bounce zone
📘 Final Thoughts:
This is a classic MMC setup in real-time:
Curve Formed → Broke
OFL + Central Zone → Now being tested
Next move depends on confirmation from buyers or sellers at Central Zone
Don’t trade emotionally — let price action give you confirmation before taking any positions. Watch the Central Zone behavior closely and manage risk based on scenario outcomes.
GOLD Rejected from Reversal Zone – Retest + Bounced & Major High📌 1. Major High & Liquidity Grab
The chart starts by showing a strong impulsive move toward the upside that taps into a Major High zone (highlighted at the top). This is a classic MMC "liquidity grab" where price sweeps the previous high to trigger stop losses and collect orders before reversing. This is a common trap zone where retail traders get caught in FOMO buys.
📌 2. Reversal Area Identified
The price entered a clearly marked Reversal Area between $3,430 – $3,445. This zone acted as:
Historical supply area
Psychological resistance
Liquidity hunt zone
Upon entry, strong rejection candles formed, signaling institutional sell pressure. This reaction aligns with MMC principles where reversal is expected post-liquidity collection from major highs.
📌 3. Parabolic Curve Formation – Bullish Impulse
A beautifully formed parabolic curve (Black Mind Curve) supported the bullish rally from around $3,310 up toward the high. This shows accumulation → breakout → expansion. However, the curve has now been broken, suggesting that bullish momentum is weakening.
⚠️ This break of curve support is critical — it often leads to a corrective phase or a deeper retracement.
📌 4. Mini Reversal Zone + SR Interchange Zone
Price has now pulled back to a very important area: the Mini Reversal Zone + SR Flip Zone around $3,400. This zone previously acted as resistance and now has the potential to act as support (classic SR interchange).
According to MMC concepts:
If this zone holds → we may see a bullish bounce and potential re-test of the upper reversal area.
If this zone breaks → bears will likely push price toward the next demand level around $3,350 – $3,340.
This is the decision point — a “battlefield” zone where market direction can be decided.
📌 5. Potential Scenarios Ahead:
✅ Bullish Scenario:
Price respects the SR zone ($3,400)
Forms bullish engulfing / continuation pattern
Likely target: re-test of reversal zone ($3,430–$3,445)
Beyond that: breakout possible if volume supports it
❌ Bearish Scenario:
Price breaks below $3,395 with strong bearish candles
Could confirm the rejection from the major high and trigger a full retracement
Downside targets: $3,360 → $3,340 range
🔑 Final Thoughts:
This GOLD setup is a perfect case of MMC theory in action — liquidity grab at the top, rejection at reversal zone, curve break, and now testing critical SR flip area.
Keep an eye on:
Candlestick behavior at the SR zone
Volume confirmation
Momentum indicators (if using)
Wait for confirmation before jumping in — let the market reveal its hand at the decision zone.

RF 1D: Breakout or Just a Bullish Pause?Regions Financial (ticker: RF) finally escaped the descending channel it had been stuck in for nearly 8 months — like someone who missed their stop and woke up in a different state. The breakout came with volume and a hold above the 50-day MA, which technically gives the bulls a reason to stretch their legs — cautiously.
The price has already cleared the 0.618 Fibonacci level (~21.66), and is now pushing toward the 0.5 zone (~22.87). If momentum holds, the next key area is target 1 around 24.00–24.50. Beyond that — and this is where things get ambitious — we have target 2 in the 27.50–28.50 range, which aligns with pre-breakdown resistance from late 2024.
RSI is climbing into overbought territory but still confirms the breakout rather than warning of a top — at least for now.
On the macro side: U.S. regional banks have had a rough ride in early 2025, but RF has held up better than many peers. The recent earnings beat and visible uptick in volume suggest growing institutional interest. If bond yields keep cooling and risk appetite returns to the value sector, RF could remain in favor.
That said, bulls need to see a confirmed hold above 22.80. Otherwise, this could end up as another failed retest — and bears are always lurking just outside the channel.

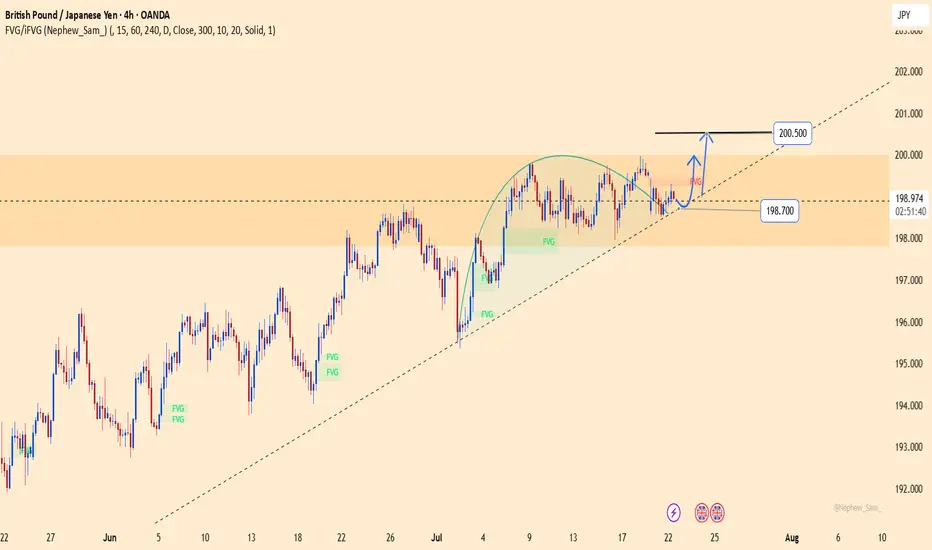
GBPJPY – breakout loading: final leap to 200.500?After days of compression, GBPJPY is flashing clear signs of an explosive breakout.
Price is holding firmly above the ascending trendline and consolidating right at the top of the FVG zone – a strong signal that buyers are preparing to punch through the 200.500 resistance in one decisive move.
Meanwhile, the JPY continues to lose ground as the BoJ shows no clear intention to hike rates, while GBP gains support on expectations that the BoE will maintain its hawkish stance longer due to persistent core inflation.
Trade setup (reference):
Buy limit: 198.900
SL: below 198.500
TP: 200.500
Nightly $SPY / $SPX Scenarios for July 23, 2025🔮 Nightly AMEX:SPY / SP:SPX Scenarios for July 23, 2025 🔮
🌍 Market-Moving News 🌍
📈 Morgan Stanley Stays Bullish
Morgan Stanley reaffirmed its optimistic view, forecasting the S&P 500 will reach 7,200 by mid‑2026. They cited strong earnings and anticipated rate cuts as key drivers, though warned of risks from rising Treasury yields and tariff-related cost pressure
📉 Inflation Debate Reignites
A renewed debate is underway regarding whether tariffs are "transitory" or persistent inflation drivers. Treasury counselor Joseph Lavorgna argued tariff impacts will be one-off, while others caution long-term price pressures may persist, complicating Fed policy directions
🏛️ Calls for Fed Reform Intensify
Treasury Secretary Scott Bessent suggested structural reforms to the Federal Reserve could have greater long-term impact than removing Chair Powell, highlighting ongoing concerns over central-bank governance amid political criticism
💳 Investors Shift to Corporate Bonds
As equity valuations have surged, investors are reallocating toward investment-grade corporate bonds, reducing credit spreads to the tightest levels since 1998—a sign of elevated risk appetite balanced with caution
📊 Key Data Releases & Events 📊
📅 Wednesday, July 23:
(No major U.S. economic releases)
Market focus remains on tech earnings (Tesla, Alphabet) and Fed signals following Tuesday’s Powell address.
⚠️ Disclaimer:
This information is for educational/informational purposes only and does not constitute financial advice. Please consult a licensed financial advisor before making investing decisions.
📌 #trading #stockmarket #economy #tariffs #Fed #earnings #corporatebonds
USDJPYDate:
July 22,2025
Session:
Tokyo and London session
Pair:
USDJPY
Bias:
Long
1. Clean liquidity pool left unswept from last week's NYC Open (Thursday).
Took this trade earlier today but looks like price wanted to consolidate in the liquid pool its currently in. I still hold the same idea and think the sweep will definitely take place sometime this week. Now looks like the perfect time to enter. If Asia session cant get it done its up to London and New York session.
Entry:147.534
Stop Loss:147.215
Target:148.768
RR:3.89

NZDUSD Is a Short-Term Rebound on the Table?NZD/USD is down nearly 0.4% in Tuesday’s European session, trading near the key support area of 0.5940 — a confluence of the 0.5 Fibonacci retracement and the midline of a descending channel. The pair is pressured by rising expectations that the RBNZ may cut rates in August, while the USD remains volatile amid uncertainty surrounding trade talks between the US and its key partners.
🔍 Technical Overview – Structure & Momentum
✅ Overall Trend: Bearish short-term (descending channel)
✅ Current Structure: Price is testing key technical support at 0.5940
✅ Volume Profile: VPOC and upper supply zones remain key targets on a bounce
NZD/USD continues to respect the bearish channel structure. However, the support zone at 0.5940 (Fibo 0.5 + recent demand) is showing signs of holding. If price sustains above this level, a bullish correction toward the 0.6006 and 0.6040 supply zones is a valid scenario.
🧭 Trade Scenarios
🔸 Bullish Short-Term Scenario (if 0.5940 holds):
Entry: Buy around 0.5940
TP1: 0.60064 (VPOC + supply zone)
TP2: 0.60400 (OBS sell zone)
SL: Below 0.5905 (sell-side liquidity break)
🔹 Bearish Continuation (if support breaks):
A clean break below 0.5905 confirms downside continuation
Look for retest and short entries targeting deeper channel lows (0.586x–0.583x)
⚠️ Macro Risk Drivers
Growing expectations of an RBNZ rate cut in August
Ongoing US trade negotiation uncertainty with key partners
Potential USD volatility around upcoming macroeconomic releases
📌 Key Price Levels to Watch
Technical Support 0.5940 Fibo 0.5 + mid-channel
Sell-Side Liquidity 0.5905 Bearish confirmation if broken
VPOC + Supply Zone 0.60064 First upside target
OBS Sell Zone 0.60400 Final bullish target / resistance
💬 The descending channel remains in control, but 0.5940 could be the key pivot. Wait for confirmation before entering, and watch volume closely.

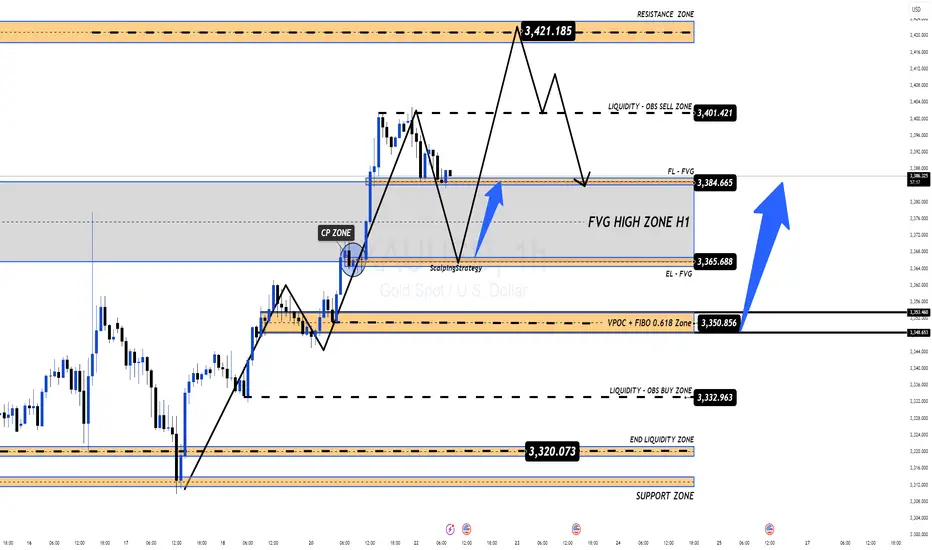
Gold 22/07 – Reversal in Sight After $3400? Watch These Key Zone XAUUSD – Intraday Market Outlook (22/07)
Gold posted a strong rally in the previous session, completing its short-term impulsive wave structure. However, as price approached the psychological resistance at $3400, it began to lose momentum, and a clear reversal candle appeared — a signal that today’s session may favour a pullback or correction.
🔍 Technical Overview
After printing a short-term top, gold is now retracing and has reached a critical support area: the FVG High Zone on the H1 chart. If bearish pressure continues and this level fails to hold, price is likely to drop further in search of deeper liquidity zones.
🔽 Key BUY Zones to Monitor Today
✅ Zone 1 – EL (End Liquidity within FVG): 3367 – 3350
→ A zone with strong potential for short-term rebounds due to previous liquidity sweeps.
✅ Zone 2 – Confluence of FIBO 0.5–0.618 + VPOC (3350 – 3335)
→ A technically significant area where multiple factors align — ideal for medium-to-long term entries.
📌 Trade Setup Ideas
🔸 BUY ZONE: 3351 – 3349
Stop Loss: 3344
Take Profit Targets:
3355 – 3360 – 3365 – 3370 – 3375 – 3380 – 3390 – 3400 – ???
🔸 BUY SCALP ZONE: 3366 – 3364
Stop Loss: 3360
Targets: 3370 – 3375 – 3380 – 3385 – 3390
🔻 SELL ZONE: 3420 – 3422
Stop Loss: 3427
Targets: 3415 – 3410 – 3405 – 3400 – 3390 – 3385
⚠️ Market Risk Reminder
While no major economic data is expected today, that doesn’t mean the market will stay calm. Unexpected volatility can still arise from geopolitical tensions or unscheduled central bank comments. Gold tends to compress and break out aggressively in low-news environments.
📌 Protect your capital with disciplined Stop Loss and Take Profit levels — no forecast is ever 100% certain.
📈 Strategic Outlook
Short-term bias: Market is likely to continue correcting
Medium to long-term plan: A deeper pullback could offer an excellent opportunity to build long positions from key demand zones, especially as markets begin to price in potential Fed rate cuts and gold continues its long-term bullish trend.
💬 Be patient, wait for confirmations, and trade with a clear plan — that’s what separates consistency from chaos.
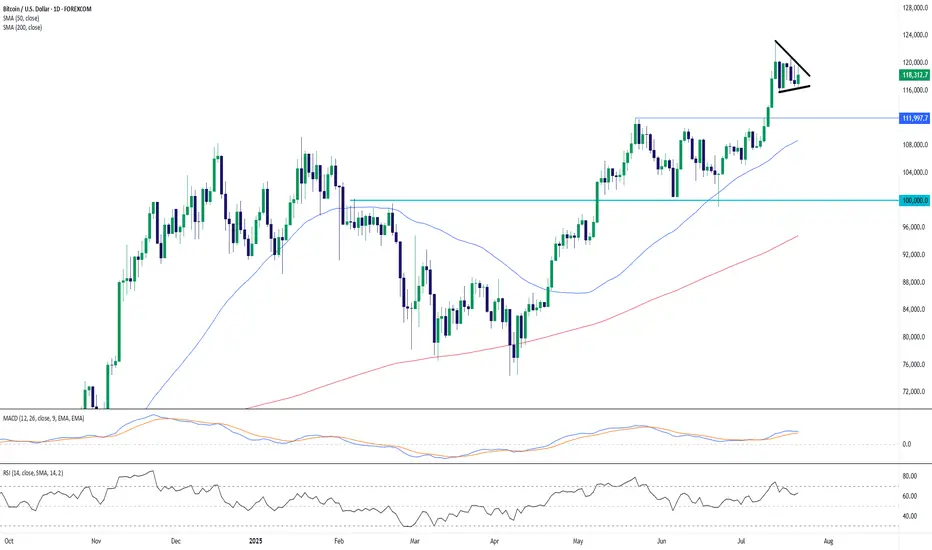
BTC/USD – Bullish Pennant Hints at Potential Continuation >$120KBitcoin remains in a strong uptrend, consolidating just below the $120,000 level after a powerful breakout from the $112K zone earlier this month. Price action has formed a classic bullish pennant pattern on the daily chart, characterized by converging trendlines and declining volume—a textbook setup for trend continuation.
The uptrend remains technically intact, with BTC well above its 50-day SMA ($108.7K) and 200-day SMA ($94.8K), both of which are rising and supportive of bullish momentum. The RSI at 63.2 reflects healthy, but not overbought, conditions, while the MACD maintains a positive crossover above the zero line, though it has started to flatten during the consolidation.
A breakout above the pennant resistance (~$119K) could trigger the next leg higher, potentially targeting a measured move toward the $128K–130K area. However, if sellers manage to push price below the lower pennant boundary and horizontal support at $112K, a deeper correction toward $100K cannot be ruled out.
Bias: Bullish continuation favored as long as price holds above $112K. Watch for a breakout to confirm upside momentum toward new highs.
Time frame: Medium-term (days to a few weeks)
-MW
AUD/USD Channel Breakdown Could Threaten Bullish StructureAUD/USD is currently holding just above the 0.6500 psychological level after retreating from the 0.6558 Fibonacci resistance (61.8% retracement of the October–April decline). Price action has recently broken beneath the lower boundary of a rising wedge pattern—a traditionally bearish signal—raising the risk of deeper downside ahead.
The 50-day SMA (0.6498) and 200-day SMA (0.6399) are converging, with the former now acting as dynamic support following today’s bounce. However, momentum indicators offer limited bullish conviction: the RSI hovers near neutral at 51.5, and the MACD is flatlining just above zero, suggesting a pause in directional bias.
If bears push price back under 0.6500, the rising wedge breakdown could accelerate toward the 200-day SMA and potentially the horizontal support zone at 0.6178. On the flip side, a recovery above 0.6558 would invalidate the wedge and open the door for a run toward the 78.6% retracement near 0.6730.
Bias: Cautiously bearish while below 0.6558, especially if daily closes begin to settle under 0.6500. A loss of the 200-day SMA would confirm a trend reversal.
Time frame: Short- to medium-term (days to weeks)
-MW

S&P500 INDEX (US500): Bullish Trend Continues
US500 updated a higher high this week, breaking a resistance
of a bullish flag pattern on a daily time frame.
I think that the market will rise even more.
Next goal for the bulls - 6359
❤️Please, support my work with like, thank you!❤️
I am part of Trade Nation's Influencer program and receive a monthly fee for using their TradingView charts in my analysis.

USDJPY Correction Complete, Is the Bullish Trend Back in play?After pulling back from the recent high near 149.17, USDJPY has shown signs of strength again, rebounding off the confluence support at the ascending trendline. The bullish narrative is supported by a hawkish FOMC tone and news that a U.S. federal court temporarily blocked Trump-era tariffs. The pair now awaits upcoming U.S. economic data for further directional clarity.
🔍 Technical Outlook – Structure & Momentum
✅ Primary trend: Bullish
✅ Correction phase: Completed near CP zone and trendline
✅ Key structural areas: FVG Zone, CP Zone, and trendline remain intact
Price has responded positively from the CP Zone + OBS Buy Zone around 147.438, aligning with the uptrend line. As long as this structure holds, buyers may push the market toward the next resistance zones.
🧭 Trade Scenarios
🔸 Bullish Bias (preferred scenario):
As long as price holds above 147.438, we expect continuation toward the FVG zone, with immediate targets at the GAP + OBS Sell Zone (148.703) and extended potential to the Buy-side Liquidity zone at 149.122.
A clean breakout above 149.122 opens the door to Fibonacci extensions: 149.72 and 150.05.
🔹 Bearish Scenario (if invalidated):
If price breaks below 147.438 and loses the trendline, we may see a deeper drop toward the Liquidity Buy Zone at 146.825, where strong buying interest is expected to re-enter the market.
⚠️ Macro Risk Drivers
Hawkish FOMC minutes continue to support USD strength
Paused trade tariffs reduce political headwinds, improving risk sentiment
Upcoming U.S. economic data could trigger sharp intraday moves → watch closely
📌 Key Price Zones
Liquidity Buy Zone 146.825 Major long re-entry zone
CP + OBS Buy Zone 147.438 Current active support
FVG Zone 148.20 – 148.68 Intraday bullish target
GAP + OBS Sell Zone 148.703 Short-term resistance
Buy-side Liquidity Zone 149.122 Final bullish objective
💬 Structure remains bullish unless the trendline breaks. Stay patient, wait for confirmations at key zones, and follow your plan with disciplined risk management.

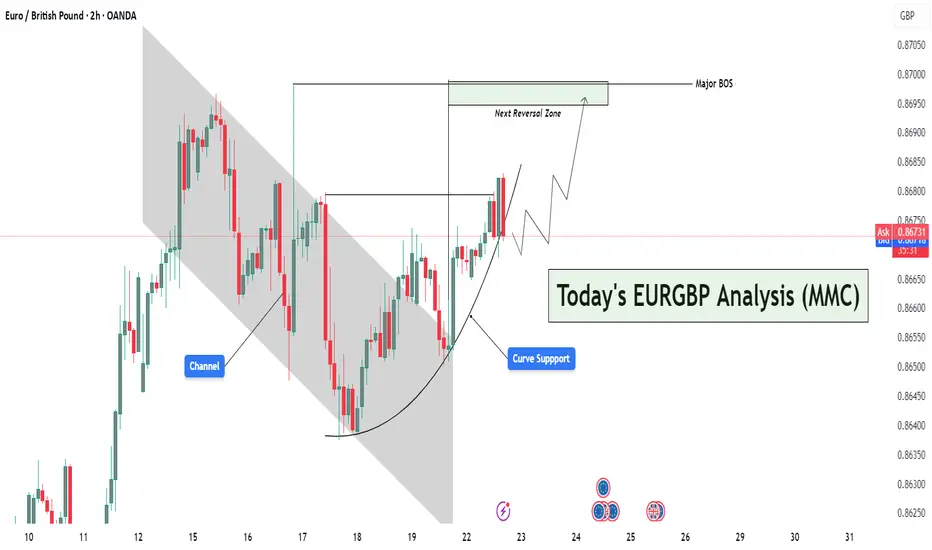
EURGBP Curved Support Breakout – Targeting Reversal Zone🔍 Market Context & Structural Narrative (MMC Style)
The EURGBP pair is currently displaying a textbook MMC structural evolution, transitioning from a bearish trend into a potential bullish leg driven by curve dynamics and trap-break logic.
🔨 Phase 1: Bearish Channel & Trap Formation
The market initially moved within a clearly defined descending channel, which acted as a trap for reactive sellers. Each lower high and lower low within the channel created a perception of sustained bearishness, luring breakout traders and late sellers into short positions.
✅ Key Insight:
This trap zone represents the first step in MMC logic — create a visible structure, generate bias, then prepare for inversion.
🌙 Phase 2: Curve Support – Psychological Accumulation
Around the base of the channel, the market began forming a rounded bottom or curve support. This is a signature MMC accumulation pattern, where market makers gradually absorb sell orders and build long positions without triggering immediate attention.
The curve support has the following implications:
Represents passive accumulation.
Suggests waning bearish pressure.
Builds bullish pressure subtly, often missed by retail traders.
🧠 MMC Mindset Tip:
Curved price action isn't just technical — it's psychological. It represents a controlled shift in sentiment, not an impulsive change, which is what makes it so powerful.
💥 Phase 3: Break of Structure (BOS) – Confirmation of Strength
Price breaks out of both the descending channel and the curved base, leading to a Major Break of Structure (BOS). This BOS is critical, as it confirms the invalidity of the previous bearish narrative and activates a new bullish leg.
📌 This BOS is more than a line — it’s a wall of liquidity getting broken. Price has now closed above key swing highs, which suggests:
Smart money is in control.
Trend shift is validated.
New demand zone created below.
🎯 Projection: The Path to the Next Reversal Zone (NRZ)
Following the breakout, price is projected to:
Possibly retest the breakout level (structure retest) aligned with the curve support — a healthy bullish pullback.
Then move higher towards the Next Reversal Zone (NRZ), which is your defined target area.
📌 NRZ Insight:
This zone is where the market is likely to face:
High liquidity.
Strong previous supply.
Potential profit-taking by early bulls.
Thus, this becomes the make-or-break zone — price either:
Reverses sharply,
Or breaks through and continues the bull rally.
⚠️ Multiple Scenarios Based on MMC Conditions
✅ Scenario 1: Retest & Bounce (Ideal MMC Setup)
Price pulls back to retest the breakout level or the curve support.
Shows bullish confirmation (e.g., pin bar, bullish engulfing).
Targets the NRZ above 0.8700.
❌ Scenario 2: Failed Retest – Fakeout Trap
Price breaks below the curve and structure again.
Suggests that the BOS was a false breakout.
Could re-enter the previous bearish channel structure.
🔄 Scenario 3: Direct Rally Without Retest
Strong momentum buyers push price directly to NRZ.
Wait for reaction at NRZ — could trigger a reversal or continuation depending on price behavior.
🧠 MMC Strategic Takeaways:
Trap → Break → Shift is the psychological framework in play.
The curve is not just support — it's evidence of silent accumulation.
The NRZ isn’t just resistance — it's the battleground where MM logic resolves.
🔐 Trading Insights (Optional Entry Ideas):
Entry: On bullish confirmation near 0.8660–0.8665 (curve/structure support).
SL: Below curve base (e.g., 0.8640).
TP: Near or slightly below NRZ (0.8700–0.8705), partial profits or full exit.
Today's EURUSD Analysis : Channel Break : EURUSD Eyes 1.19056Chart Overview:
The EURUSD pair has broken out of a well-defined descending channel, indicating a potential shift in momentum. Price has now approached a critical Central Zone that acts as a probable reaction or reversal area. This zone lies between minor and major supply levels.
🔍 Key Technical Highlights:
Descending Channel:
Price was previously trapped in a bearish channel. This channel was respected with multiple touches on both upper and lower bounds, showing controlled bearish structure.
Breakout & Momentum Shift:
The recent bullish breakout above the channel suggests buyers are gaining control. A strong candle has closed outside the structure, confirming the breakout.
Major & Minor Zones:
Two levels are marked just above the breakout:
Minor Resistance: First possible supply zone where price may pause.
Major Resistance: A stronger historical level and the top of the Central Zone.
Central Zone Reaction Area (CZRA):
This is the MMC's focus area — price is expected to react here. Either we see a rejection that could confirm a reversal setup, or price slices through, opening the door to the Next Reversal Zone around 1.19056.
📌 Strategic Condition (MMC Logic):
Condition 1:
If price respects the Central Zone and shows bearish signs (e.g., wick rejections, engulfing candles, divergence), we expect a strong pullback or reversal toward previous demand levels.
If Condition 1 Fails:
The annotation clearly states: “If this condition not apply, it will go 100%.”
Meaning: If price breaks and holds above the Central Zone, it confirms bullish strength, targeting 1.19056 — the Next Reversal Zone (NRZ).
📊 Trader's Mindset (MMC Application):
This setup is a classic MMC structure trap-break scenario:
The channel traps sellers,
The breakout invites buyers,
And the Central Zone becomes the battlefield.
Wait for confirmation, not assumption. Whether it's rejection or breakout, risk management and reaction-based trading are key.

USDJPY Analysis : Trendline Breakout, Liquidity Trap & MMC Zone🔍 Full Technical Breakdown:
In today’s USDJPY 2H chart, the market is unfolding exactly as per Mirror Market Concepts (MMC). We’ve identified a clean trendline breakout, and now price is reacting between the Central Zone (50%) and the Next Reversal Zone, where liquidity is expected to be filled. Let's break down each zone and movement to understand how price is being manipulated and where we can take action.
🔵 1. Trendline Confirmation – The First Sign of Strength
The trendline was tested multiple times from the top, acting as resistance. But recently, price broke above this line with strength, signaling a potential bullish reversal. You've rightly marked it as "Trendline Confirmation" — this is where structure shifted from bearish to bullish.
This is a classic MMC principle — breakout above manipulated resistance, followed by a pullback for re-entry.
The breakout wasn’t just a wick; it had body strength, indicating real buyer presence.
Now, price is pulling back to retest the trendline from above, a typical MMC behavior before continuing upward.
⚖️ 2. Central Zone – The 50% Trap
This zone represents the midpoint of the last major impulsive move. It's where most traders get confused, and institutions re-balance their entries.
You've highlighted: “It Can Reverse From Its 50% Zone” – and that’s accurate.
According to MMC, this is where smart money traps late sellers, takes liquidity, and initiates the next bullish leg.
If price holds above the 147.200–147.500 zone, we could see buyers stepping in aggressively.
🟩 3. Liquidity Fill – Next Reversal Zone
If price doesn’t hold the Central Zone, we don’t panic — this is where MMC becomes powerful.
Beneath current structure lies liquidity — previous stop hunts and unfilled orders.
That area is your Next Reversal Zone around 146.200–146.400.
It’s a liquidity trap — market might dip there just to manipulate emotional traders, then reverse with force.
This is exactly where you’ve written “Liquidity Will Fill” — meaning smart money might fill orders there before moving up.
🧭 Possible Price Paths:
🔼 Bullish Scenario (High Probability):
Trendline retest holds as support.
Price bounces from the 50% Central Zone.
Targets: 148.800 – 149.200 (previous highs and clean breakout zone).
Confirmation: Bullish engulfing candle or strong wick rejection at Central Zone.
🔽 Bearish Trap Scenario (MMC-Based):
Price dips below Central Zone into liquidity zone.
Traps sellers and triggers stop-losses.
Reverses sharply from Next Reversal Zone (Liquidity Zone).
This is where smart money positions themselves for the real move up.
🧠 MMC Insight:
This structure is textbook MMC – clean manipulation zones, false breakout traps, and a trending bias powered by smart liquidity plays.
Trendline breakout = initial intent
Central zone = confusion zone
Liquidity trap = entry for smart money
📢 The goal is not to predict, but to react with precision when the market reveals its hand.
🕒 Timeframe: 2H
📌 Strategy: Mirror Market Concepts (MMC) | Trendline + Liquidity + Midpoint Trap
📈 Bias: Bullish, but waiting for confirmation at either Central or Liquidity Zone
🔍 Sentiment: Cautiously Optimistic

GBPUSD Long Trade Alert – Inverted Head & Shoulders BreakoutGBPUSD has confirmed a classic Inverted Head & Shoulders pattern, signaling a strong bullish reversal opportunity on the 2-hour chart. Price has successfully broken above the neckline resistance zone (~1.3490) and has now retested that zone, forming a bullish engulfing candle — an ideal confirmation for long entries.
🟢 Trade Plan:
Entry: After bullish engulfing candle formed on neckline retest (~1.3490–1.3500)
Stop Loss: Just below the right shoulder low / retest swing low (~1.3455)
Risk/Reward Ratio: ~4:1 (High reward with tightly controlled risk)
🎯 Target Levels:
Target 1: 1.3555
Final Target (Projected): 1.3620
These levels align with structure resistance and measured move of the pattern
📌 Why This Trade Matters:
Pattern confirmed ✅
Retest successful ✅
Bullish confirmation candle ✅
Clean invalidation and upside potential ✅
This is a textbook reversal play, offering solid structure, clear stop placement, and attractive upside. Perfect for swing traders or short-term position setups.
📉 Trade what you see, not what you think. Let price action lead your execution.
=================================================================
Disclosure: I am part of Trade Nation's Influencer program and receive a monthly fee for using their TradingView charts in my analysis.
=================================================================
