GOLD SPOT (XAU/USD) 1H ANALYSIS BULLISH STRUCTURE HOLDING STRONG📈 GOLD SPOT (XAU/USD) 1H ANALYSIS – BULLISH STRUCTURE HOLDING STRONG! 🚀✨
🔍 Overview:
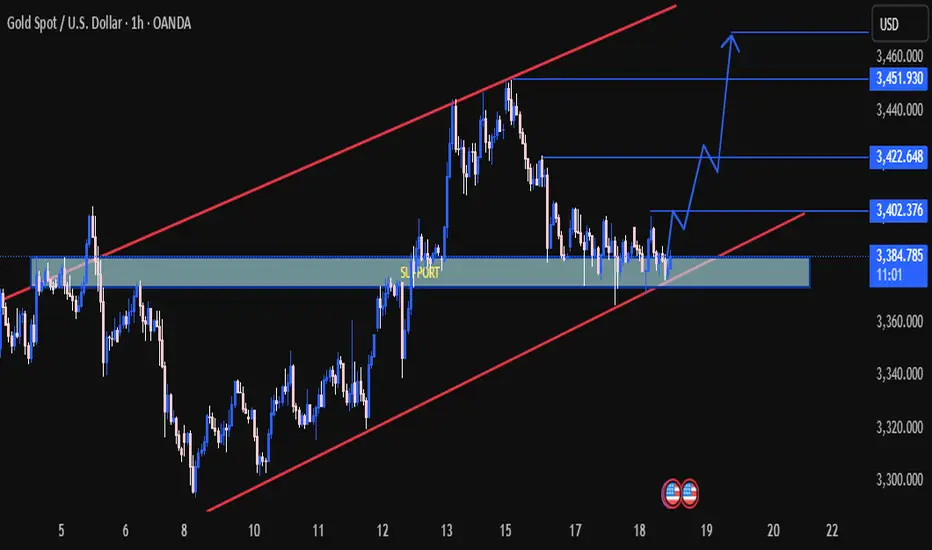
Gold is currently trading within a well-defined ascending channel 📊, showing clear bullish intent. Price action has respected the lower channel support, bouncing strongly from a key demand zone highlighted in blue.
🟦 Support Zone:
The price is consolidating just above the $3,385–$3,390 support zone 🛡️, which has acted as a springboard multiple times in the past. This area aligns perfectly with the lower trendline, increasing its reliability.
📍 Key Price Targets:
🎯 $3,402 – First breakout confirmation and minor resistance.
🎯 $3,422 – Mid-level target, possible resistance.
🎯 $3,452 – High-probability target if bullish momentum continues.
🎯 $3,460+ – Extended target aligning with the channel top.
📈 Technical Structure:
Price is respecting higher lows and higher highs, maintaining bullish momentum.
A breakout above $3,402 could trigger the next leg up.
Market is forming a bullish flag/pennant consolidation—potential breakout pending ⏳.
⚠️ Risk Zone:
A break below the demand zone and the channel could invalidate the bullish setup ❌. Close monitoring of lower structure is essential.
✅ Conclusion:
As long as price holds above the key support zone and within the ascending channel, bullish continuation remains the favored scenario. A breakout above interim resistance levels could send Gold toward $3,450+! 🌟📊
🔔 Watch for bullish confirmation candles or volume spikes before entry!
📅 Chart published: June 18, 2025 | XAU/USD | 1H timeframe
🧠 Strategy: Bullish breakout play 📈
💡 Sentiment: Moderately Bullish ♻️
Technicals
TSLA: Uptrend channel bounce, trading between 50 and 200-day SMAHey guys/gals!
So we all know that Tesla took a massive drop last week. It fell about 14%, and was down even 3% after hours at one point. I think we can all agree this crash wasn't technicals driven - it was clearly headline impacted. This was a clear black swan even t, and even in my case, nothing like this has ever happened to me as a trader. It was unforeseeable, forced me to hedge overnight and I'm still having nightmares (lol). Definitely one to remember as I don't think something like this would happen with any other stock. Tesla is truly unique in this sense.
But looking at the bigger picture, the bounce that we experienced on Friday must've been technicals driven, and psychologically influenced, as I am almost certain that the crash was a massive overreaction. People woke up the next day and thought this was severely discounted over a couple social media tweets (I won't go into the politics of things).
As you see on the chart, Tesla may in a new upward channel. At first I figured this may be a bear flag, however due to the upcoming catalyst like the Robotaxi launch - this would likely only be a bear flag if prices crashes below the lower support trend line.
As long as price is within the channel, I'd say things are holding up. We'd likely see a jump towards the upper side of the channel - however it's important to note that $300 and £360 are major resistance points. Robotaxi launch and any future tweets will definitely move price, and I think those will be a factor in determining whether price goes up or crashes below the trend line.
Another thing to point out is that price is currently trading between the 50-day and 200-day moving averages. The 50-day SMA is acting as vital support, whereas the 200-day SMA is the resistance. If there is a break above the 200-day SMA, price will likely go higher. The opposite may happen if price crashes below the 50-day SMA.
Either way, headlines and technicals mentioned above will continue to influence price.
Note: not financial advice.

Why is ROBINHOOD dropping in afterhours? Robinhood's stock (HOOD) is dropping in after-hours trading due to several factors:
1. Regulatory Scrutiny: The company is facing increased attention from regulators, particularly regarding its expansion into unconventional financial offerings like sports betting-related features.
2. Analyst Downgrade: Wolfe Research recently downgraded Robinhood's stock from "Buy" to "Hold," citing valuation concerns and suggesting that the stock's upside potential has already been priced in.
3. Competitive Pressure: Traditional banks and fintech startups are ramping up their offerings, making it harder for Robinhood to maintain its market dominance.
4 Investor Uncertainty: Some investors are skeptical about Robinhood's new ventures, such as its push into banking services and prediction markets, which blur the lines between trading and gambling.
5. Technical Resistance: A clear parallel channel is bringing Hood back to planet earth. This stock has had a 160% run with minimal pullback, profit taking is highly likely.

EURCAD BULLISH OR BEARISH DETAILED ANALYSISEURCAD is currently consolidating within a clean symmetrical triangle formation on the 8H chart, tightening between dynamic support and resistance. Price is hovering around 1.56200 and coiling at the apex of the triangle, suggesting a breakout is imminent. With this structure developing over several weeks, this setup is primed for a high-probability directional move. The overall technical picture is showing compression, and the bullish bias becomes more likely if price breaks and closes above 1.56900.
From a fundamental perspective, the euro is gaining moderate strength as the ECB is maintaining a cautiously hawkish tone while assessing economic recovery and inflation persistence. Meanwhile, the Canadian dollar is facing downward pressure following the Bank of Canada's recent interest rate cut — a shift that surprised many traders and sparked risk-on flows away from the loonie. Crude oil prices, which often support CAD, have also turned volatile with no sustained bullish momentum, weakening CAD’s support base.
This triangle pattern reflects indecision but also the perfect setup for breakout traders waiting for volatility expansion. A confirmed bullish breakout would likely target 1.59200, with short-term resistance levels offering minor friction around 1.57800. The breakout aligns with a well-balanced risk-reward setup, with a stop area potentially below 1.56000. Price action has respected this structure consistently, adding further confluence for a clean technical move.
As EURCAD inches toward a decision point, traders should be on high alert for breakout confirmation and follow-through momentum. This is a textbook volatility squeeze pattern — when it resolves, it tends to run fast and far. With favorable macro fundamentals, this setup has the potential to deliver a solid trend continuation wave in the coming sessions.

Gold (XAU/USD) 1H Analysis – Potential Breakout Play🟡 Gold (XAU/USD) 1H Analysis – Potential Breakout Play 📈
🔎 Key Levels and Zones
Resistance Zone: Around $3,410 – $3,430.
Midpoint/Key Resistance-Turned-Support: Around $3,360 – $3,370.
Support Zone: Around $3,270 – $3,290.
🔀 Chart Structure & Momentum
The price is in a short-term bullish recovery after finding strong support at the $3,270 – $3,290 level.
The breakout above the midpoint around $3,360 is a significant bullish trigger, suggesting that bulls are taking charge.
📊 Scenario Analysis
Bullish Scenario (Primary Bias) 🟢: If the price holds above the midpoint ($3,360), we expect a push towards the resistance zone ($3,410 – $3,430). This aligns with the “resistance-flip-support” concept, where the previous resistance becomes a new support base.
Bearish Scenario (Alternate Bias) 🔴: If the price fails to hold above $3,360, a re-test of the support zone ($3,270 – $3,290) is likely. From there, bulls will likely try to defend the area and launch another attempt upwards.
📌 Conclusion
The path of least resistance currently favors the bulls while the $3,360 level holds.
Watch for consolidation near $3,360 – $3,370 as a healthy retest before potential continuation to the upside target zone ($3,410 – $3,430).
📅 Near-Term Bias
Remain cautiously bullish while above $3,360.
A confirmed breakout above $3,410 opens room for further bullish momentum, while a breakdown below $3,360 can re-test the key support at $3,270.

Technical Analysis: XAU/USD (Gold) Price Action📊 Technical Analysis: XAU/USD (Gold) Price Action
🕒 Timeframe: 4H (Based on candlestick structure)
📅 Published: May 27, 2025
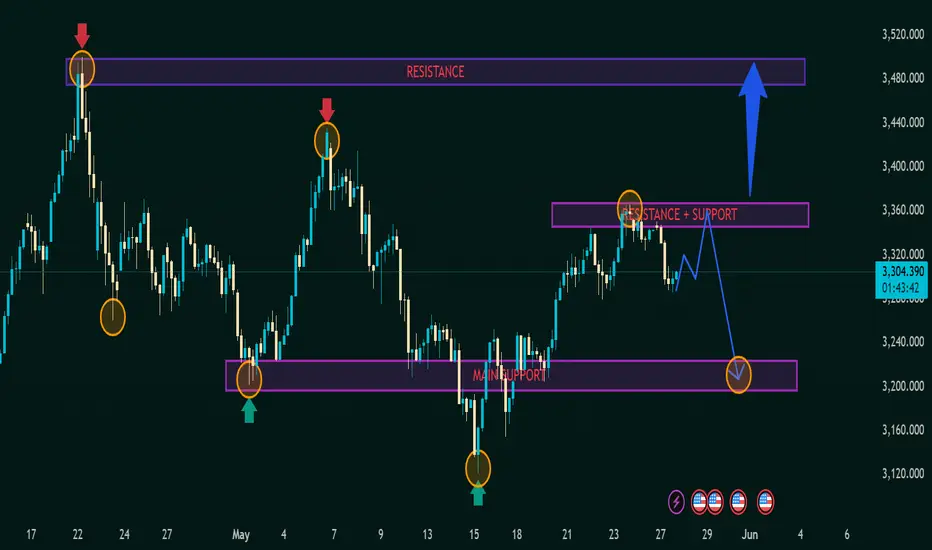
💰 Current Price: 3,303.860
🔴 Major Resistance Zone
📍 3,480 – 3,500
📌 Seen with red arrows and price rejections.
📉 Strong selling pressure has occurred twice from this level (double top-like behavior).
❗ Until price breaks above this, bulls face a major hurdle.
🟣 Key Mid-Level Zone (S/R Flip)
📍 3,340 – 3,360
🔄 This area has flipped between support and resistance.
🔸 Price tested this level recently and pulled back (orange circle), suggesting sellers are active.
🔮 This is the pivot zone – watch for break/rejection to determine next trend leg.
🟪 Main Support Zone
📍 3,180 – 3,220
✅ Multiple bounce reactions visible (green arrows and circles).
💪 This zone has held strong; indicates solid buyer interest.
📉 If price returns here and breaks below, we could see further downside to 3,120 or lower.
🧭 Market Structure Summary
🔁 The market is in a range-bound structure between 3,220 – 3,360, with spikes towards 3,480.
🔃 The recent higher low followed by rejection at mid-resistance suggests potential distribution.
🧠 Forecast Scenarios
🔵 Bullish Scenario (Blue Path)
Break above 3,360 → Retest as support → 📈 Potential rally to 3,480
📍 Target: 3,480+
🟢 Confirmation: Strong bullish engulfing candle + volume surge
🔻 Bearish Scenario (Blue-Arrow + Orange Circle)
Rejection at current resistance → Drop toward 3,220
📍 Target: Main Support zone
❗ Watch for bearish candle pattern confirmation at 3,340
⚖️ Trading Strategy Tips
🔍 Wait for confirmation at the mid-resistance before entering.
🛡️ Place stops below support zones for long positions.
💥 Aggressive short sellers may look to enter near 3,340 with tight stops above.
🧩 Conclusion
The asset is in a critical decision zone. Whether it breaks higher toward the resistance or retraces to support will shape the next directional move. Traders should remain cautious, and let price action confirm bias before committing.
BTC/USD Rebound in Play! | Key Support Holding, Eyes on $112K📊 BTC/USD Technical Analysis
🗓️ Chart Date: May 25, 2025
🔍 Key Levels:
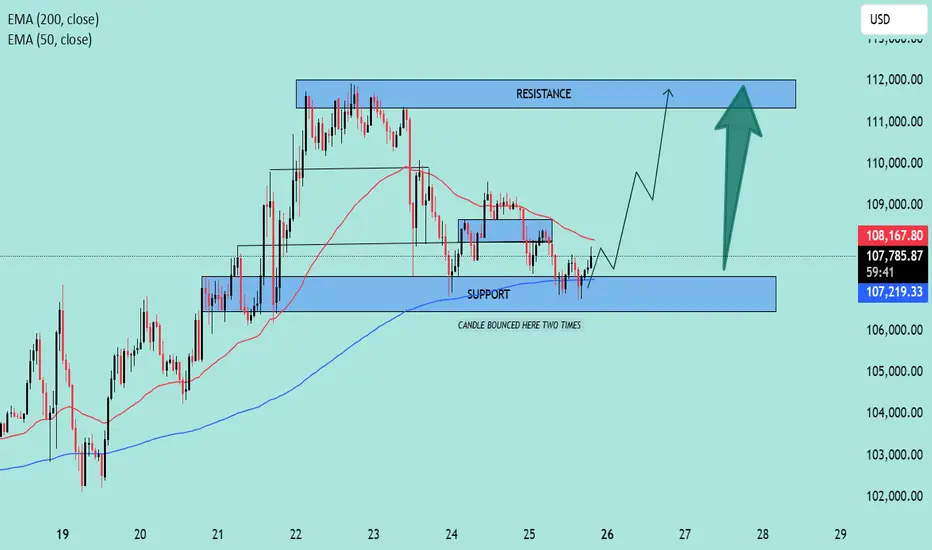
🔵 Support Zone: $106,800 – $107,300
Notably, price bounced twice in this region, indicating strong buying interest.
This area aligns closely with the 200 EMA (currently at $107,213.51), adding further confluence as dynamic support.
🔴 Resistance Zone: $111,800 – $112,300
Previous highs and consolidation make this a significant area where sellers may re-enter the market.
📈 Indicators:
🔵 EMA 200 (Blue): $107,213.51
Acts as a strong dynamic support; price bounced off it recently.
🔴 EMA 50 (Red): $108,182.91
Price is currently below the 50 EMA, suggesting short-term bearish pressure remains until this level is reclaimed.
🧠 Market Structure & Price Action:
After a sharp drop from the resistance zone, price found solid footing at the support zone.
Recent candles show rejection wicks from the downside, hinting at potential bullish reversal.
A breakout above minor consolidation and 50 EMA could trigger a bullish continuation toward the resistance.
📌 Forecast:
✅ If the price holds above the support zone and breaks above $108,200, we can expect a bullish move toward $112,000.
⚠️ However, a failure to break above the 50 EMA could lead to a retest of the support zone.
🧭 Trade Idea (Not Financial Advice):
📥 Long Bias:
Entry: On confirmed breakout above $108,200
SL: Below $107,000
TP: $111,800 – $112,300
📌 Conclusion:
The chart setup suggests a potential bullish reversal 📈 from a key support zone, supported by EMA 200. Watch for a break above the 50 EMA for momentum confirmation.
🧠 Always confirm with volume and wait for confirmation before entering a position.
EUR/CHF Technical Outlook – Potential Bullish Reversal Setup📈 Pair: EUR/CHF
📆 Date: May 27, 2025
📊 Timeframe: Daily (D1)
📌 Technical Highlights:
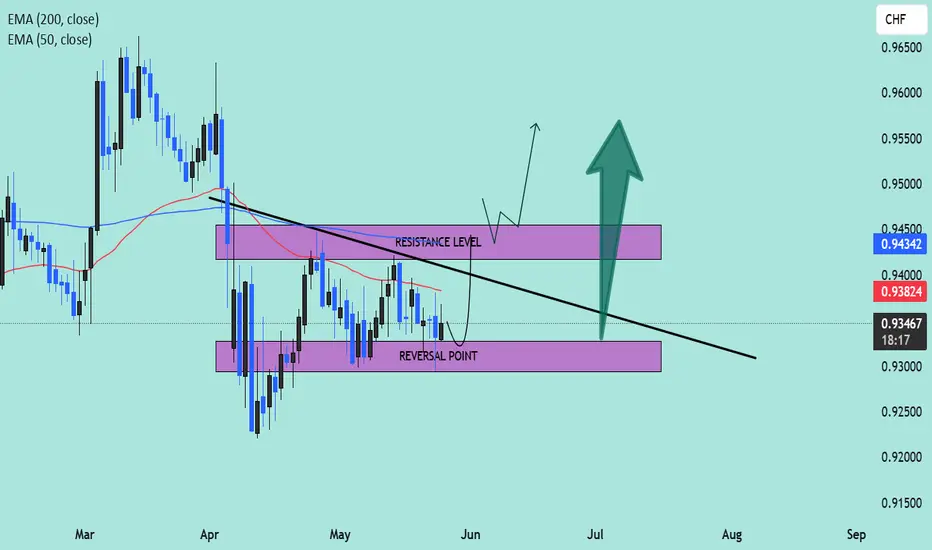
🔹 Current Price: 0.93456
🔹 Key Indicators:
50 EMA (Red): 0.93824
200 EMA (Blue): 0.94342
🧠 Chart Analysis:
🔻 Downtrend Resistance Line: A clear descending trendline is pressing price lower, reinforcing a bearish structure since March.
🟣 Reversal Zone (Support Area):
Price is currently hovering just above the marked Reversal Point, a demand zone between 0.93000–0.93400. Historically, this zone has acted as a launch pad for upward momentum.
🟪 Resistance Level:
Located around 0.94300–0.94600, this zone is reinforced by the 200 EMA, making it a critical breakout area. A strong bullish close above this region could invalidate the downtrend.
🔄 Two Scenarios to Watch:
✅ Bullish Breakout Scenario:
Price may bounce from the reversal zone.
A break and retest above the resistance level could lead to bullish continuation toward 0.9500–0.9550.
Confirmation above the 200 EMA will add confidence to the breakout.
📈 Potential Buy Entry: On breakout and retest of 0.9450
🎯 Target: 0.9550
🛡️ Stop Loss: Below 0.9320
❌ Bearish Continuation Scenario:
If price fails to hold above the reversal point, sellers may regain control.
A breakdown below 0.9300 could trigger further downside toward 0.9200 or lower.
📉 Sell Setup Invalid Until: Price closes below 0.9300 on strong volume.
🧭 Conclusion:
This chart suggests a critical decision point for EUR/CHF. A bounce from the reversal zone followed by a confirmed break above resistance could signal the start of a medium-term uptrend. Traders should monitor price action closely for confirmation signals near the trendline and EMA zones.
🚦 Bias: Neutral to Bullish, awaiting confirmation
🧠 Tip: Watch for candlestick patterns (like bullish engulfing or pin bars) near the support zone for early entries.
EUR/USD Forming Double Top –Bearish Reversal Toward Key Support?📉 EUR/USD Technical Outlook – Bearish Bias Developing 🔍
🟪 Key Resistance Zone:
📍 1.1350 – 1.1450
Price has tested this resistance zone multiple times, forming a double-top pattern (🔄) within the highlighted circle. This signals buying exhaustion and potential reversal pressure. The recent failure to break above confirms the zone’s strength.
🔴 EMA Confluence:
🧭 50 EMA (red): ~1.1242
🧭 200 EMA (blue): ~1.0961
The price is currently hovering just above the 50 EMA but well above the 200 EMA, which is acting as a dynamic support. The crossover has already occurred, so if price breaks below the 50 EMA decisively, momentum could shift bearish.
🔻 Support Breakdown Risk:
A breakdown from the 1.1200 neckline area (highlighted in red oval) would confirm the double-top pattern 🎯. That opens downside potential toward the strong demand zone below.
🟪 Strong Support Zone:
📍 1.0700 – 1.0800
This area aligns with prior consolidation (March lows) and the 200 EMA, making it a high-probability reversal zone 📈 if the bearish scenario plays out.
📌 Trade Setup Insight:
✅ Bearish confirmation below 1.1200 neckline 📉
🎯 Target: 1.0800 zone
❌ Invalidation: Break above 1.1350 resistance
🔵 Summary:
The chart is hinting at a classic double-top reversal below a key resistance zone. If price breaks the neckline, sellers are likely to gain control, targeting the strong support near the 200 EMA.
📊 Bias: Bearish 👇
📅 Timeframe: Daily
🛑 Risk Management: Watch for fake-outs near neckline; volume confirmation preferred.

Technical Levels Respected – BTC Reaches $108K Target what next?📍 BTC Target Hit with Precision!
✅ As predicted in the previous analysis, Bitcoin has successfully tapped the $108K resistance zone — clean and technical execution!
📊 My chart spoke in advance... and the market listened.
🎯 Why miss out on these accurate forecasts?
📉 My strategies are not just random lines — they’re built on solid market structure, EMAs, and key price action zones.
📢 Let’s stay connected!
🧠 I’m committed to sharing educational content and professional trading insights to help you grow as a trader.
💡 Whether you're a beginner or seasoned trader, there’s always something new to learn with me.
📚 Join the journey — learn, trade, and win!
📩 DM or follow to get consistent updates and chart breakdowns.
🚀 Let’s trade smart, not hard!
Key Rejection Zone Approaching – Bearish Setup in PlayChart Summary:
Asset: Unspecified (USD-based)
Timeframe: Short-term (likely 1H or 4H)
Indicators:
EMA 50 (red): 3,245.772
EMA 200 (blue): 3,223.635
Key Zones:
Resistance Zone (Red box): ~3,310–3,360
Target/Support Zone (Red box): ~3,110–3,160
Mid Support Zone (Blue box): ~3,200–3,230
Trendline: Downward sloping resistance connecting major highs
---
Technical Breakdown:
Trend Analysis:
Primary Trend: Bearish ⬇️
Confirmed by the downtrend line (black) which has been respected multiple times (3 clear touches).
Current Price: 3,290.090
Price is approaching a key confluence zone: resistance area + trendline.
This area has previously acted as strong supply.
Moving Averages:
EMA 50 > EMA 200: Minor bullish signal (Golden Cross), but price action is still below major resistance.
However, this cross may be a false signal if price gets rejected here.
---
Price Action:
Current Move: Strong bullish push toward resistance after rebounding from the target zone ✅
The resistance zone and trendline are likely to act as a rejection point unless broken decisively.
---
Bearish Scenario (High Probability):
If price fails to break above the resistance zone:
Expect a rejection and move back toward:
Blue mid-support: ~3,220
Target zone: ~3,130 (major demand area)
Confirmation: Bearish candlestick pattern or strong wick rejections near resistance.
🔵 Entry Idea: Short near 3,310–3,350
🎯 Target: 3,130 zone
✋ Stop-Loss: Above 3,360 (above trendline + resistance)
---
Bullish Scenario (Less Likely):
If price breaks above the resistance zone with strong volume:
Could signal trend reversal
Next target levels: ~3,400+
---
Conclusion:
Bias: Bearish near resistance zone
Key Level to Watch: 3,310–3,360 (critical for direction)
Trading Approach: Wait for confirmation, don't preemptively short without rejection signals.

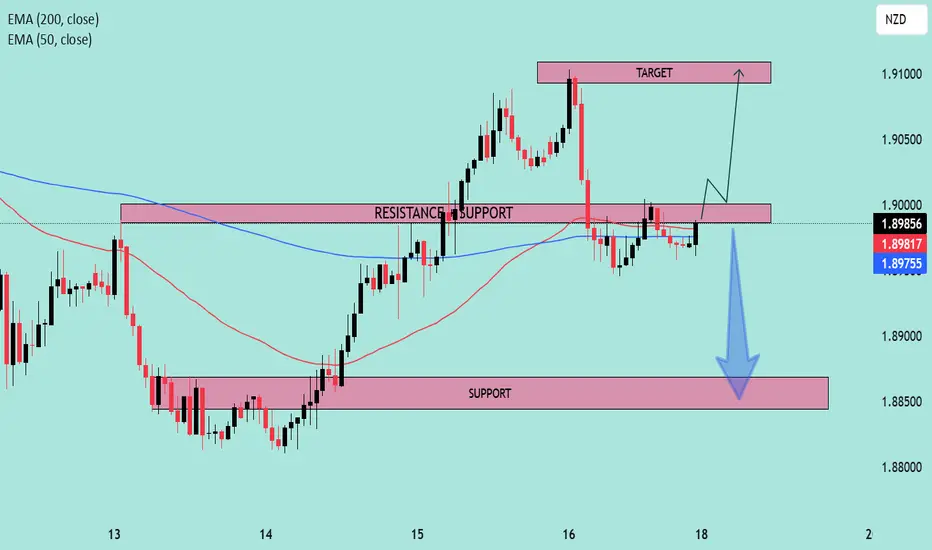
EURNZD at Key Decision Zone | Breakout or Breakdown?📊 Pair: EURNZD
🕒 Timeframe: Likely H1 or H4
📅 Date: May 18, 2025
🔍 Technical Analysis
🔁 Key Zones
🔴 Resistance-Turned-Support (RTS):
1.8975 – 1.8990
This area was previously a resistance level that price broke above, and is now acting as a critical support zone (flip zone). Price is currently retesting this area.
🎯 Target Zone (Resistance):
1.9085 – 1.9110
This is the next projected bullish target if price successfully rebounds from current support.
🛑 Major Support Zone:
1.8840 – 1.8860
Strong buying interest was seen here previously, acting as a safety net in case of bearish rejection from the current level.
🔄 EMA Confluence
📘 EMA 200 (Blue): 1.8975
📕 EMA 50 (Red): 1.8981
Price is hovering around the EMAs, indicating a moment of decision. A decisive move above these EMAs could trigger bullish momentum. 📈
🔮 Scenario Outlook
🟢 Bullish Scenario (Preferred Setup)
✅ Confirmation above 1.8990
➡️ Retest and continuation could push price toward the 1.9100 target zone.
🔼 Momentum supported by prior breakout and higher lows.
📌 Entry Idea: Above 1.8995
🎯 Target: 1.9100
🛡️ Stop: Below 1.8950
🔴 Bearish Scenario
❌ If price fails to hold the 1.8970–1.8990 zone, a breakdown could follow.
⬇️ Likely move toward 1.8850 support zone.
🚨 Watch for bearish engulfing or rejection candles near resistance.
🧠 Summary
Price is at a key decision point.
✅ Bullish bias is slightly stronger due to market structure (higher highs & higher lows).
⚠️ But a clean break below support would shift focus to the downside.
📈 Strategy: Wait for confirmation ⚖️
Bullish: Break + retest of 1.8990
Bearish: Breakdown below 1.8950 and close under EMAs
Critical Reversal or Breakdown? | XAU/USD at Make-or-Break Zone📉 Chart Overview:
Instrument: XAU/USD (assumed from chart context)
Timeframe: 4H or Daily (based on candlestick size)
Indicators Used:
📏 EMA 50 (Red): 3,247.86
📏 EMA 200 (Blue): 3,221.42
🔍 RSI (14): Currently at 45.90 (below midline, showing weak momentum)
🔎 Key Zones:
🧱 Support Zone: ~3,180 – 3,220
Price is currently sitting on this key demand zone.
Price previously bounced here sharply ➡️ indicating buyer interest.
📦 Resistance Block: ~3,260 – 3,280
Short-term resistance, price has been repeatedly rejected from here.
🎯 Target Zone: ~3,420 – 3,460
If price breaks out from the support-resistance squeeze, this is the potential bullish target 🎯.
🧭 EMA Analysis:
EMA 50 is still above EMA 200 ➡️ Golden Cross formation (medium-term bullish bias) ✅
However, price is currently below both EMAs, signaling short-term weakness ❌
📉 Bearish Scenario (📍Blue Arrow Down):
If price breaks below the support zone at ~3,180, we could see a sharp drop toward the next support at ~3,032 🔻.
RSI is trending down near 40, close to oversold territory ⚠️
🚀 Bullish Scenario (📈 Blue Arrow Up):
A successful retest and bounce from this support area (currently forming a rounded bottom 🥄) could lead to a bullish move toward the target zone.
This is further supported by the potential RSI bounce from the 40 area, signaling renewed momentum 🔋.
✅ Bias & Conclusion:
Neutral-to-Bullish Bias 🤝: As long as the price holds above the major support zone (~3,180), buyers have a chance to reclaim higher levels.
Look for confirmation breakout above the local resistance (~3,260) for a move toward 3,400+ 🚀.
A breakdown below support would invalidate the bullish thesis and target 3,030 instead 📉.
🛠️ Trading Plan (not financial advice!):
Long Entry: On bullish breakout & retest of ~3,260 ✅
Stop-Loss: Below ~3,180 ⚠️
Target: ~3,420 – 3,460 🎯

Solana - This just faked out literally everybody!Solana - CRYPTO:SOLUSD - just faked out literally everybody:
(click chart above to see the in depth analysis👆🏻)
Over the course of the past 25 days, Solana dropped a significant -30% and wiped out a ton of bulls before creating a complete reversal. Especially with the current horizontal support level, bulls are taking over again, offering us another major crypto trading opportunity.
Levels to watch: $120, $250
Keep your long term vision!
Philip (BasicTrading)

XAUUSD Price Outlook – Bearish Setup in Play ??Asset Overview
The chart represents a price action analysis with support and resistance zones, along with EMA indicators (50 and 200), likely on a 4H or 1H timeframe.
Key Technical Levels
Resistance Zone: ~3,400 to 3,450
First Support Zone: ~3,230 to 3,250
Second Support Zone: ~3,090 to 3,130
Indicators
EMA 50 (Red): Currently around 3,340, acting as dynamic resistance.
EMA 200 (Blue): Positioned near 3,232, reinforcing the first support zone.
Price Action Insight
Price had a strong uptrend, peaking above 3,440 before pulling back.
A lower high may be forming, suggesting possible trend exhaustion.
The current bounce appears to be a retracement back toward resistance or EMA 50.
Projected Move (As Illustrated on Chart)
Short-term bullish move into the resistance zone (~3,400–3,450).
Failure to break above resistance leads to sharp rejection.
Price retraces to first support zone (aligned with EMA 200).
If support fails, deeper drop expected toward the lower support zone (~3,100).
Strategic Notes
📉 Bearish Bias if price fails to break above resistance.
🔍 Watch for bearish candlestick patterns or divergences near resistance.
🛡️ First support aligns with EMA 200, making it a critical level for bulls to defend.
🔻 Breakdown below 3,230 opens room for larger correction to 3,100–3,090.
Conclusion
Currently, the chart suggests a potential short opportunity if price confirms rejection at resistance. The EMA cross structure remains bullish long-term, but momentum is weakening, and failure to reclaim highs could shift sentiment bearish in the short to mid-term.

NASDAQ Bullish Breakout Above Channel;📈 Technical Analysis Overview
1. Breakout from Downtrend Channel
The price has clearly broken out of a descending channel, confirmed by a clean breakout above the upper trendline.
This is a bullish signal, indicating the end of the prior downtrend and the start of a possible uptrend or reversal.
2. Moving Averages (EMA 50 & EMA 200)
EMA 50 (Red): 18,965
EMA 200 (Blue): 19,409
Price is currently trading above both EMAs, which is another strong bullish indicator.
A bullish crossover (where EMA 50 crosses above EMA 200) is likely imminent if upward momentum continues—this would form a Golden Cross, further confirming bullish sentiment.
3. Structure and Market Behavior
After the breakout, price retested the breakout zone and showed a bounce, forming a higher low, which is characteristic of a bullish structure.
The chart includes projected price action with higher highs and higher lows—suggesting a bullish continuation pattern.
4. Volume & Momentum (Not shown but implied)
Breakouts are typically validated by volume. Although volume is not shown, the sharp upward movement and breakout above resistance suggest strong buying pressure.
🔍 Key Levels to Watch
Resistance: 20,000 psychological level; above that, 20,500–21,000 may act as resistance.
Support: 19,400 (near EMA 200), and 18,965 (EMA 50); a break below may invalidate the bullish setup.
📊 Conclusion
The chart shows a clear breakout from a descending channel, supported by the price moving above both key EMAs. The structure favors bullish continuation, especially if price holds above the 19,400–19,500 support zone. Upside targets lie around 20,500 to 21,000.

US30 Approaching Key Resistance Within Rising Channel:🧠 Chart Context & Overview
Chart Type: Candlestick
Time Frame: Appears to be Daily (based on price action and spacing of dates)
Current Price: ~$40,798.4
Indicators:
EMA 50 (Red): ~40,065.2
EMA 200 (Blue): ~41,475.6
Trend Structure: Ascending channel with higher highs and higher lows forming since early April.
🔍 Technical Breakdown
📈 Trend Analysis
The price is moving within a rising parallel channel, respecting both upper and lower boundaries.
The recent bullish candles indicate momentum building towards a breakout or test of resistance.
🔄 EMA Confluence
Price is above the 50 EMA, showing short-term bullish momentum.
EMA 200 is acting as overhead resistance (~41,475), aligned with the top of the channel—a key decision zone.
📊 Support & Resistance Levels
Immediate Resistance: ~41,475 (EMA 200 & upper channel boundary).
Support Levels:
~40,065 (EMA 50)
~39,000 (mid-channel support zone)
~38,000 (lower channel boundary)
📌 Scenarios to Watch
✅ Bullish Case:
A clean breakout above the channel and the 200 EMA (~41,475) with strong volume could trigger a trend continuation toward:
42,500 – next psychological and historical resistance
Potentially higher if macro sentiment aligns
⚠️ Bearish Case:
Rejection at 200 EMA or the upper channel could lead to:
A pullback to the mid-channel zone (~39,800–40,000)
Further downside to retest the lower channel support (~38,000)
📅 Outlook
The chart currently supports a bullish bias within an uptrend structure, but the key resistance zone (41,475) must be broken decisively for confirmation. Watch for volume and candle structure near that level to assess breakout validity.

USD/CHF Reversal Setup (Read-Caption)🧠 Professional Technical Analysis – USD/CHF 💱
🗓️ Date: May 6, 2025
🕰️ Timeframe: Likely 4H or Daily
📊 Current Price: ~0.82218
🔍 Technical Indicators
🔵 EMA 20: 0.84190 (short-term trend)
🔴 EMA 50: 0.82524 (mid-term trend)
❗ Bearish crossover: EMA 20 is below EMA 50 → short-term bearish bias 🐻
📉 Support Zone Analysis 🛡️
🟥 Key Demand Zone (Support): 0.82084 – 0.81437
🔁 Price has bounced here before 🪃
🕯️ Candles with long lower wicks = buyers stepping in 🧍♂️💪
🟠 This is the “bounce zone” 📈
🧭 Trade Idea
✅ Long Entry: Around 0.82084–0.82200
🛑 Stop Loss: Below 0.81437 ❌
🎯 Take Profit: Around 0.83600 🟢
⚖️ Risk/Reward: Excellent (>2:1) if bounce holds 🚀
🔄 Price Action Outlook
📉 Downtrend approaching major support
🕯️ Looking for bullish candlestick confirmation (engulfing, hammer, etc.)
📈 Target area aligns with mean reversion to EMA 20
📌 Conclusion
👀 Watching for bullish reversal signs 🔄
🛒 Buy zone is clearly defined ✅
⛔ Setup is invalidated if price closes below 0.81437

EURNZD Bearish Reversal Confirmed: Break and Retest Below Key Su🧠 Market Context & Structure:
Trend Analysis: The pair is currently in a bearish structure. This is evident from lower highs and lower lows forming after a failed bullish breakout attempt.
Key Zone: A supply zone (highlighted in red) around 1.90198 – 1.90750 has acted as a strong resistance. Price was rejected here after retesting.
Break of Structure (BoS): A clear bearish breakout below the ascending trendline and the horizontal support confirms a shift in sentiment.
📉 Indicators & Confluences:
EMA Analysis:
EMA 50 (red): 1.90757
EMA 200 (blue): 1.90728
Price is trading below both EMAs, which confirms bearish momentum. Also, a bearish EMA crossover (50 crossing below 200) may be forming or has just occurred — a death cross, which further supports downside bias.
🎯 Trade Setup Breakdown (Bearish Bias):
Entry: Around 1.89760 (current price)
Stop Loss: Above the supply zone (~1.9020 - 1.9070)
Take Profit Target: Around 1.86035 (highlighted in green), aligning with previous demand zone or measured move.
Risk-to-Reward Ratio (RRR): Estimated at ~3:1, making this a favorable setup.
🔽 Technical Patterns:
Bear Flag / Rising Wedge: The broken ascending pattern suggests a bearish continuation.
Retest Confirmation: Price retested the broken structure before continuing down — classic bearish retest behavior.
✅ Conclusion:
This is a textbook bearish setup supported by:
A failed breakout and structure shift
Resistance at a key supply zone
Break and retest of support
Price under both EMAs (bearish confirmation)
📌 Bias: Bearish
📌 Invalidation Level: Close above 1.9075
📌 Next Support Zone: 1.8600–1.8550 range

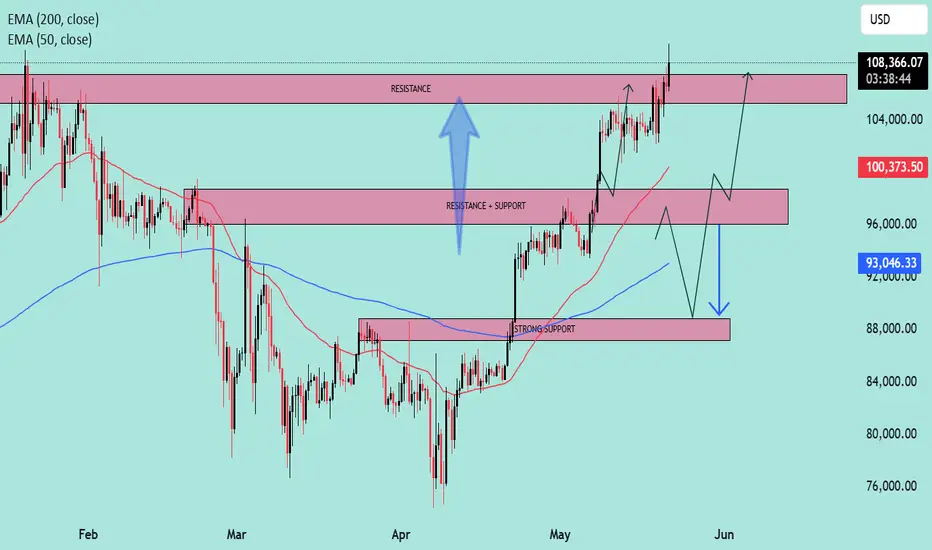
BTC at Key Inflection Zone – Breakout or Rejection Ahead?Asset: BTC/USD
Timeframe: 4H or Daily (based on visual pattern structure)
As of: May 6, 2025
Indicators:
50 EMA (Red): $91,615.79
200 EMA (Blue): $89,305.75
Key Technical Zones:
🔴 Resistance Zone: ~$104,000 – $108,000
This area has historically acted as a major supply zone.
Price has been rejected from this level multiple times, indicating strong selling pressure.
🔁 Flip Zone (Resistance turned Support/Support turned Resistance): ~$95,500 – $100,000
The current price ($95,234.23) is testing this zone from below.
A confirmed break and hold above could signal continuation toward the higher resistance.
🟢 Strong Support Zone: ~$88,000 – $91,000
Confluence of 50 EMA and 200 EMA adds strength to this demand zone.
Previous breakout level and accumulation area.
EMA Outlook:
50 EMA > 200 EMA: Short-term bullish crossover is active, indicating bullish momentum.
Both EMAs are sloping upward slightly, suggesting trend strengthening.
Price is currently above both EMAs, which acts as dynamic support.
Potential Scenarios:
✅ Bullish Scenario:
If price reclaims the $95,500–$100,000 resistance-turned-support zone:
Expect upward momentum to continue.
Target: $104,000–$108,000 zone.
Break of $108K could lead to a macro bull continuation.
⚠️ Bearish Scenario:
If price rejects the current zone and fails to hold above the $91,000 support:
Look for retest of $88,000–$89,000 area (confluence with EMAs).
Breakdown below that zone would invalidate bullish structure and signal potential deeper correction.
Summary:
Bias: Bullish above $91K, Neutral between FWB:88K –$91K, Bearish below $88K.
Key Confirmation Needed: Daily close above $100,000 for strong bullish continuation.
Risk Management: Watch for fakeouts within the $95K–$100K range due to past volatility.

XAUUSD at Critical Support – Bullish Continuation or Pullback 🔍 Market Overview
The chart shows a technical setup with clear support and resistance zones, alongside key Exponential Moving Averages (EMAs) to guide directional bias.
📊 Key Technical Levels
Resistance Zone: ~$3,445–$3,460
This is a historically reactive area where price has reversed sharply in the past. A breakout above this zone would suggest strong bullish continuation.
Strong Supporting Zone: ~$3,375–$3,390
Currently being tested. If the price holds here, it could act as a launchpad for a bullish move toward resistance.
Support Zone: ~$3,320–$3,340
If the strong support breaks, the next downside target would be this zone, which aligns with the 200 EMA (blue line) — a dynamic support level.
📈 Moving Averages
50 EMA (Red): Currently at $3,345.60, serving as a short-term dynamic support.
200 EMA (Blue): Currently at $3,304.13, marking a critical longer-term support. Price staying above this EMA reflects a bullish bias.
🔀 Probable Scenarios
Bullish Case (Preferred Scenario)
If price holds the strong supporting zone and breaks above current highs (~$3,395), it could rally toward the resistance zone at $3,445–$3,460.
Break and close above resistance may open the door for further upside continuation.
Bearish Case
A rejection from current levels or a break below $3,375 would likely lead to a retracement toward the support zone ($3,320–$3,340).
A break below the support zone and the 200 EMA would shift the structure into bearish territory.
✅ Bias & Recommendation
Current Bias: Cautiously Bullish
As long as the price remains above the strong supporting zone and 50 EMA, bulls have the upper hand.
Look for confirmation with a higher low or bullish engulfing candle before entering long.
Trade Idea:
Long Entry: On bullish confirmation above $3,395
Target: $3,445–$3,460
Stop Loss: Below $3,375 (support break)

XAUUSD Bullish Continuation Setup (read-caption)📊 Chart Overview:
Asset: Unspecified (likely XAUUSD or a crypto asset).
Timeframe: Looks like 4H or Daily.
Tools Used:
EMA 50 (🔴 Red Line) — 3,283.978
EMA 200 (🔵 Blue Line) — 3,185.603
Resistance & Support Zones (🔴 Highlighted boxes)
Price: 3,335.415
🔍 Technical Analysis:
🟩 Trend Direction:
📈 Uptrend Confirmed: Price is above both EMA 50 and EMA 200 → Strong bullish momentum.
✅ Golden Cross: EMA 50 is above EMA 200, confirming long-term bullish bias.
📌 Key Levels:
🧱 Main Support Zone (🟥 Bottom Box - ~2,950–3,050):
Historical strong bounce zone.
Acts as a bullish base in case of a deeper pullback.
🔄 Mid Resistance/Support (~3,180–3,260):
Now acting as support after price bounced above it.
Also aligns with EMA 200 ➕🟦 – adds confluence.
📌 Main Resistance Zone (~3,300–3,380):
Current area of consolidation.
If broken, price likely to retest upper resistance.
🚧 Top Resistance Zone (~3,450–3,500):
Target area if bullish breakout continues.
✈️ Next take-profit zone for bulls.
🧭 Market Forecast:
🔁 Retest Expected: Price might pull back slightly to the main resistance area (~3,300), retesting previous resistance as support.
🚀 Upside Potential: Upon successful retest, price is projected to head toward the upper resistance (~3,480).
📉 Bearish Scenario: If price breaks back below 3,260 and EMA 50, expect a dip toward 3,180 or even the main support zone.
📈 Summary:
Bias: ✅ Bullish
Watch for:
🔍 Retest of 3,300 zone
✅ Breakout above 3,380
❌ Breakdown below 3,260 invalidates bullish scenario

Silver Analysis: Bearish Continuation Toward $31 Support ?🧠 Chart Context & Setup
Chart Type: Candlestick
Timeframe: Likely 4H or Daily
Indicators Used:
EMA 50 (Red) — 32.814
EMA 200 (Blue) — 32.559
🔍 Key Technical Levels
Resistance Zone: 33.600 – 33.950
Price faced repeated rejection in this zone, confirming it as a valid supply/resistance area.
Support Zone: 30.600 – 31.100
Marked as the next potential demand zone, aligning with previous accumulation and reaction levels.
Current Price: ~32.618
Just below the 50 EMA and slightly above the 200 EMA.
🔄 Market Structure
The market experienced a strong bearish impulse in early April, followed by a bullish correction that reclaimed the 200 EMA.
Multiple internal liquidity (INT.LQ) sweeps were taken before forming a potential lower high (LH) at the resistance zone.
The recent bearish move broke below the EMAs and previous structure, indicating a possible shift back to bearish momentum.
📉 Bearish Scenario Outlook (Most Probable as of Now)
The chart shows a projected lower high formation, likely leading into a continuation of the bearish move.
If price fails to break back above 32.800–32.900, we could expect a sell-off toward the support zone (30.600–31.100).
This move aligns with:
Breakdown below EMAs
Failed bullish continuation
Rejection from a strong resistance zone
🧭 EMA Analysis
EMA 50 > EMA 200, but the price is now sandwiched and showing signs of weakness.
If price sustains below both EMAs, momentum is likely to favor bears in the short to medium term.
⚠️ Risk Factors to Watch
Any strong bullish engulfing candle reclaiming the 33.000 zone could invalidate the bearish thesis.
Fundamentals like USD volatility, inflation data, or geopolitical tension could impact Silver drastically.
✅ Conclusion
The chart currently suggests a bearish continuation setup, with the potential for price to revisit the $31.00–$30.60 support zone after rejecting resistance. A retest of broken structure around 32.700–32.800 might provide an ideal entry for sellers.
