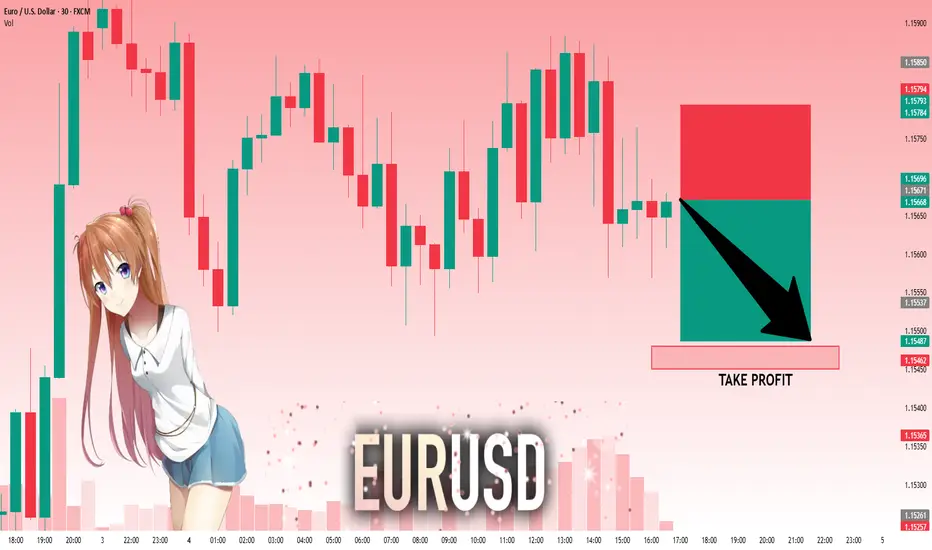
EURUSD: Target Is Down! Short!
My dear friends,
Today we will analyse EURUSD together☺️
The recent price action suggests a shift in mid-term momentum. A break below the current local range around 1.15671 will confirm the new direction downwards with the target being the next key level of 1.15480.and a reconvened placement of a stop-loss beyond the range.
❤️Sending you lots of Love and Hugs❤️
Tecnicalanalysis
SILVER: Move Up Expected! Long!
My dear friends,
Today we will analyse SILVER together☺️
The in-trend continuation seems likely as the current long-term trend appears to be strong, and price is holding below a key level of 37.330 So a bearish continuation seems plausible, targeting the next low. We should enter on confirmation, and place a stop-loss beyond the recent swing level.
❤️Sending you lots of Love and Hugs❤️

EURUSD: Bearish Continuation
Remember that we can not, and should not impose our will on the market but rather listen to its whims and make profit by following it. And thus shall be done today on the EURUSD pair which is likely to be pushed down by the bears so we will sell!
Disclosure: I am part of Trade Nation's Influencer program and receive a monthly fee for using their TradingView charts in my analysis.
❤️ Please, support our work with like & comment! ❤️

GBPCHF: Short Signal with Entry/SL/TP
GBPCHF
- Classic bearish setup
- Our team expects bearish continuation
SUGGESTED TRADE:
Swing Trade
Short GBPCHF
Entry Point - 1.0741
Stop Loss - 1.0754
Take Profit - 1.0714
Our Risk - 1%
Start protection of your profits from lower levels
Disclosure: I am part of Trade Nation's Influencer program and receive a monthly fee for using their TradingView charts in my analysis.
❤️ Please, support our work with like & comment! ❤️

USDJPY My Opinion! BUY!
My dear friends,
My technical analysis for USDJPY is below:
The market is trading on 147.23 pivot level.
Bias - Bullish
Technical Indicators: Both Super Trend & Pivot HL indicate a highly probable Bullish continuation.
Target - 148.77
About Used Indicators:
A pivot point is a technical analysis indicator, or calculations, used to determine the overall trend of the market over different time frames.
Disclosure: I am part of Trade Nation's Influencer program and receive a monthly fee for using their TradingView charts in my analysis.
———————————
WISH YOU ALL LUCK

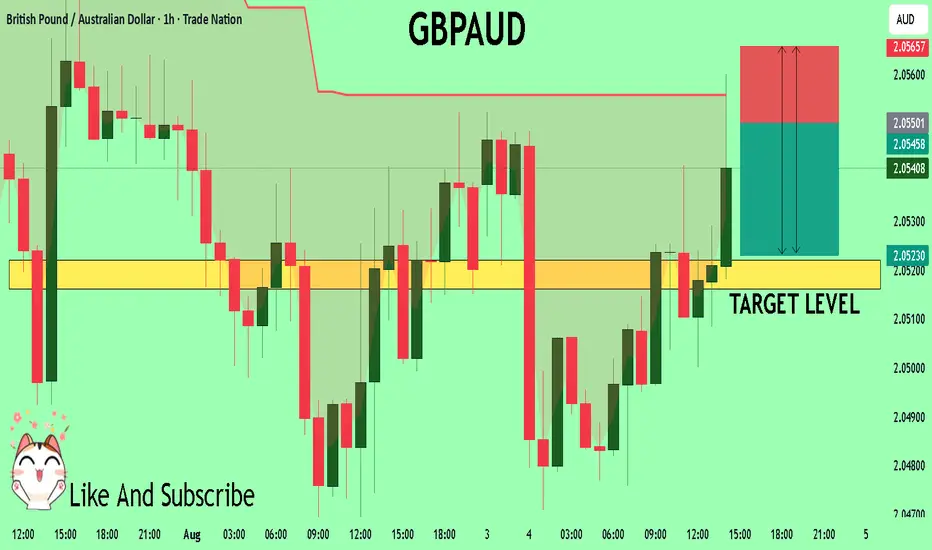
GBPAUD Technical Analysis! SELL!
My dear friends,
Please, find my technical outlook for GBPAUD below:
The instrument tests an important psychological level 2.0550
Bias - Bearish
Technical Indicators: Supper Trend gives a precise Bearish signal, while Pivot Point HL predicts price changes and potential reversals in the market.
Target - 2.0522
Recommended Stop Loss - 2.0565
About Used Indicators:
Super-trend indicator is more useful in trending markets where there are clear uptrends and downtrends in price.
Disclosure: I am part of Trade Nation's Influencer program and receive a monthly fee for using their TradingView charts in my analysis.
———————————
WISH YOU ALL LUCK
CADJPY: Bullish Continuation is Expected! Here is Why:
Balance of buyers and sellers on the CADJPY pair, that is best felt when all the timeframes are analyzed properly is shifting in favor of the buyers, therefore is it only natural that we go long on the pair.
Disclosure: I am part of Trade Nation's Influencer program and receive a monthly fee for using their TradingView charts in my analysis.
❤️ Please, support our work with like & comment! ❤️

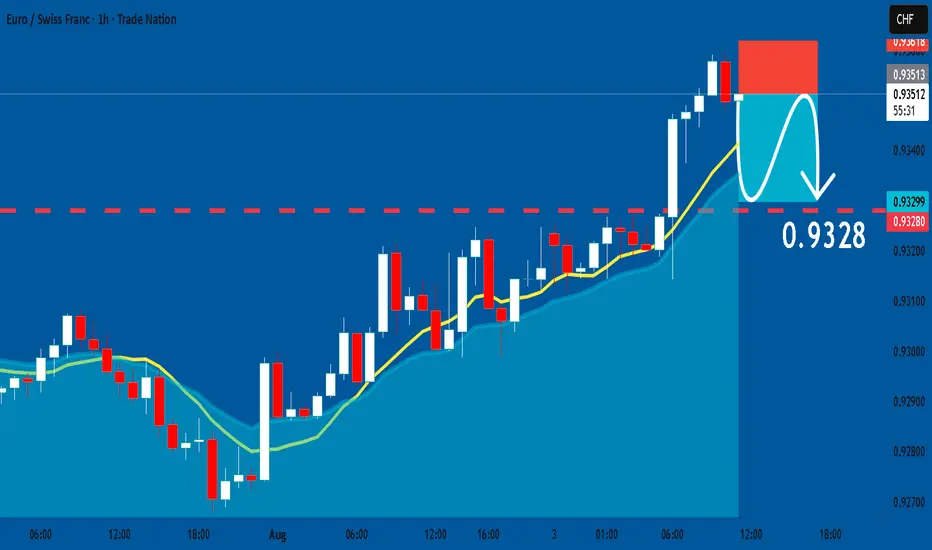
EURCHF: Short Signal Explained
EURCHF
- Classic bearish formation
- Our team expects fall
SUGGESTED TRADE:
Swing Trade
Sell EURCHF
Entry Level - 0.9350
Sl - 0.9361
Tp - 0.9328
Our Risk - 1%
Start protection of your profits from lower levels
Disclosure: I am part of Trade Nation's Influencer program and receive a monthly fee for using their TradingView charts in my analysis.
❤️ Please, support our work with like & comment! ❤️
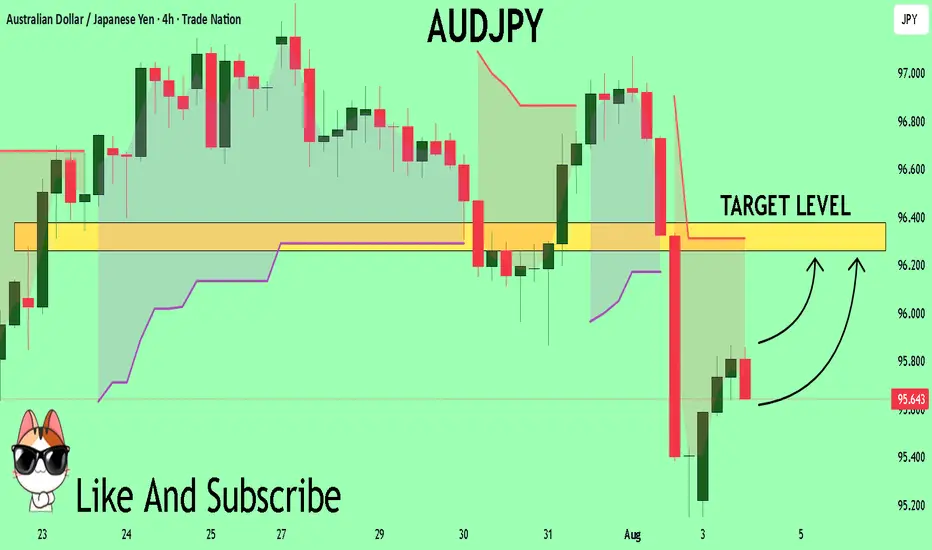
AUDJPY Set To Grow! BUY!
My dear subscribers,
AUDJPY looks like it will make a good move, and here are the details:
The market is trading on 95.649 pivot level.
Bias - Bullish
Technical Indicators: Both Super Trend & Pivot HL indicate a highly probable Bullish continuation.
Target - 96.260
About Used Indicators:
The average true range (ATR) plays an important role in 'Supertrend' as the indicator uses ATR to calculate its value. The ATR indicator signals the degree of price volatility.
Disclosure: I am part of Trade Nation's Influencer program and receive a monthly fee for using their TradingView charts in my analysis.
———————————
WISH YOU ALL LUCK
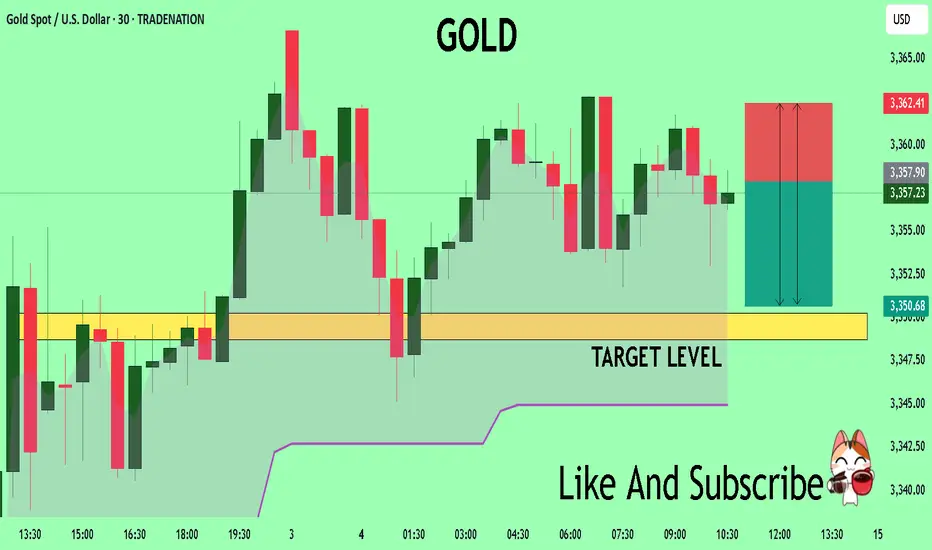
GOLD A Fall Expected! SELL!
My dear subscribers,
My technical analysis for GOLD is below:
The price is coiling around a solid key level - 3358.0
Bias - Bearish
Technical Indicators: Pivot Points Low anticipates a potential price reversal.
Super trend shows a clear sell, giving a perfect indicators' convergence.
Goal - 3350.7
My Stop Loss - 3362.4
About Used Indicators:
By the very nature of the supertrend indicator, it offers firm support and resistance levels for traders to enter and exit trades. Additionally, it also provides signals for setting stop losses
Disclosure: I am part of Trade Nation's Influencer program and receive a monthly fee for using their TradingView charts in my analysis.
———————————
WISH YOU ALL LUCK
USD/JPY 4H –analysis Buy setupUSD/JPY (U.S. Dollar / Japanese Yen)
Timeframe: 4-Hour (4H)
Trend: Bullish Trendline Support – Price is respecting a strong ascending trendline.
Indicators: Ichimoku Cloud is visible; current price is above the cloud = bullish bias.
Current Price: Around 147.95.
---
✅ Buy Entry:
Entry Zone: Between 147.90 – 148.10
(As price is bouncing from the trendline support and Ichimoku cloud.)
🎯 Buy Targets:
1. Target 1: 148.99 (Previous structure resistance)
2. Target 2: 150.50 (Next resistance level)
3. Target 3 (Swing): 152.00+ (If momentum continues)
🛑 Stop Loss:
Below trendline + Ichimoku support = 146.80 (safe zone)
---
🔖 Chart Title Suggestion:
"USD/JPY 4H – Trendline Rebound with Bullish Momentum Targeting 150+"

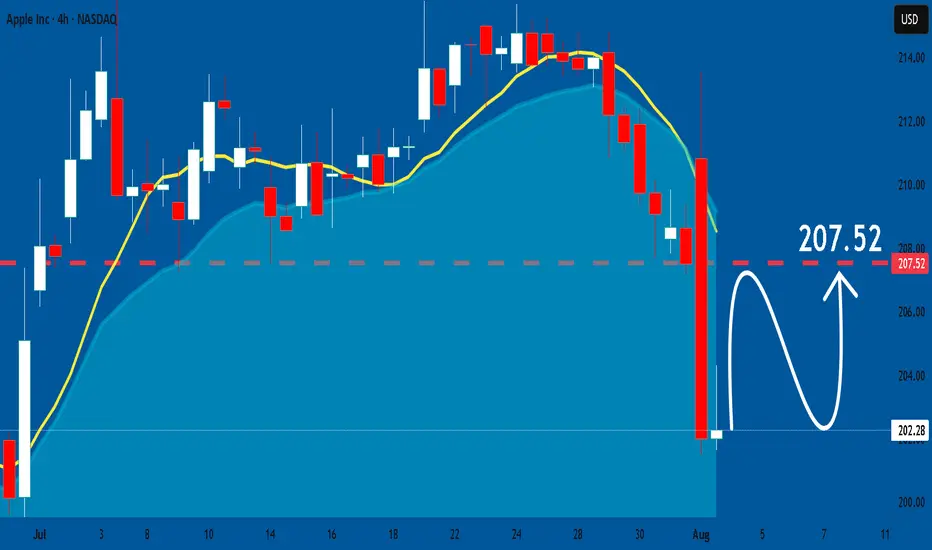
APPLE: Bullish Forecast & Bullish Scenario
The charts are full of distraction, disturbance and are a graveyard of fear and greed which shall not cloud our judgement on the current state of affairs in the APPLE pair price action which suggests a high likelihood of a coming move up.
Disclosure: I am part of Trade Nation's Influencer program and receive a monthly fee for using their TradingView charts in my analysis.
❤️ Please, support our work with like & comment! ❤️
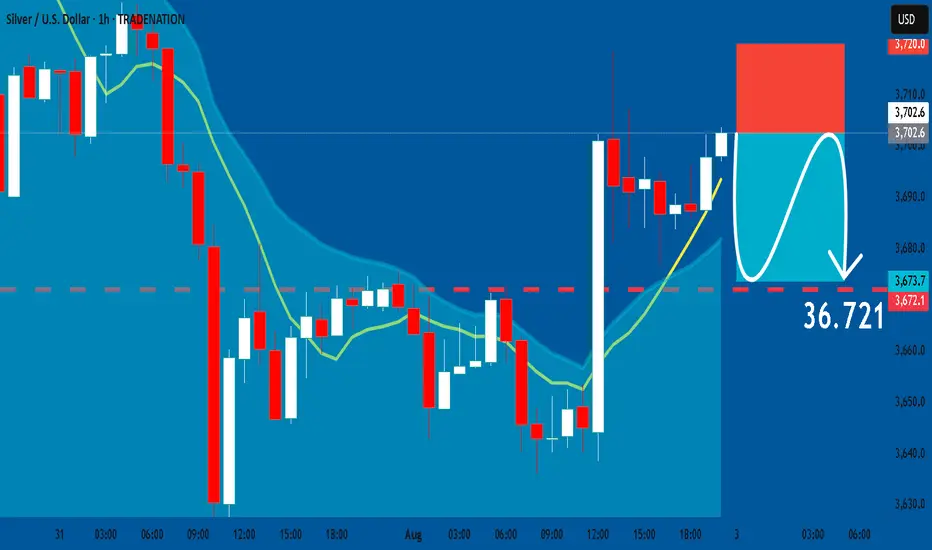
SILVER: Short Trade with Entry/SL/TP
SILVER
- Classic bearish formation
- Our team expects pullback
SUGGESTED TRADE:
Swing Trade
Short SILVER
Entry - 37.026
Sl - 37.200
Tp - 36.721
Our Risk - 1%
Start protection of your profits from lower levels
Disclosure: I am part of Trade Nation's Influencer program and receive a monthly fee for using their TradingView charts in my analysis.
❤️ Please, support our work with like & comment! ❤️
EURUSD Trading Opportunity! SELL!
My dear followers,
This is my opinion on the EURUSD next move:
The asset is approaching an important pivot point 1.1585
Bias - Bearish
Technical Indicators: Supper Trend generates a clear short signal while Pivot Point HL is currently determining the overall Bearish trend of the market.
Goal - 1.1497
About Used Indicators:
For more efficient signals, super-trend is used in combination with other indicators like Pivot Points.
Disclosure: I am part of Trade Nation's Influencer program and receive a monthly fee for using their TradingView charts in my analysis.
———————————
WISH YOU ALL LUCK

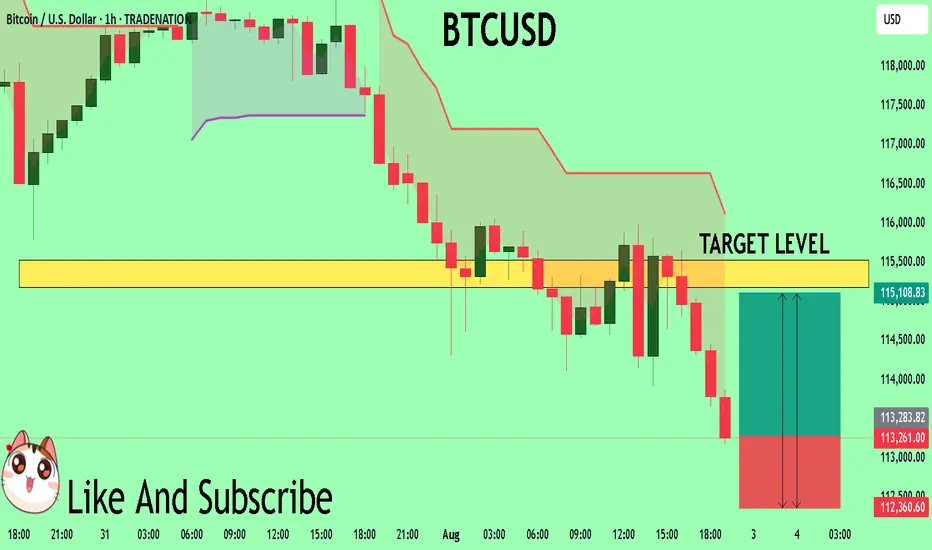
BTCUSD Will Explode! BUY!
My dear followers,
I analysed this chart on BTCUSD and concluded the following:
The market is trading on 11326 pivot level.
Bias - Bullish
Technical Indicators: Both Super Trend & Pivot HL indicate a highly probable Bullish continuation.
Target - 11517
Safe Stop Loss - 11236
About Used Indicators:
A super-trend indicator is plotted on either above or below the closing price to signal a buy or sell. The indicator changes color, based on whether or not you should be buying. If the super-trend indicator moves below the closing price, the indicator turns green, and it signals an entry point or points to buy.
Disclosure: I am part of Trade Nation's Influencer program and receive a monthly fee for using their TradingView charts in my analysis.
———————————
WISH YOU ALL LUCK
SPY: Growth & Bullish Forecast
The price of SPY will most likely increase soon enough, due to the demand beginning to exceed supply which we can see by looking at the chart of the pair.
Disclosure: I am part of Trade Nation's Influencer program and receive a monthly fee for using their TradingView charts in my analysis.
❤️ Please, support our work with like & comment! ❤️

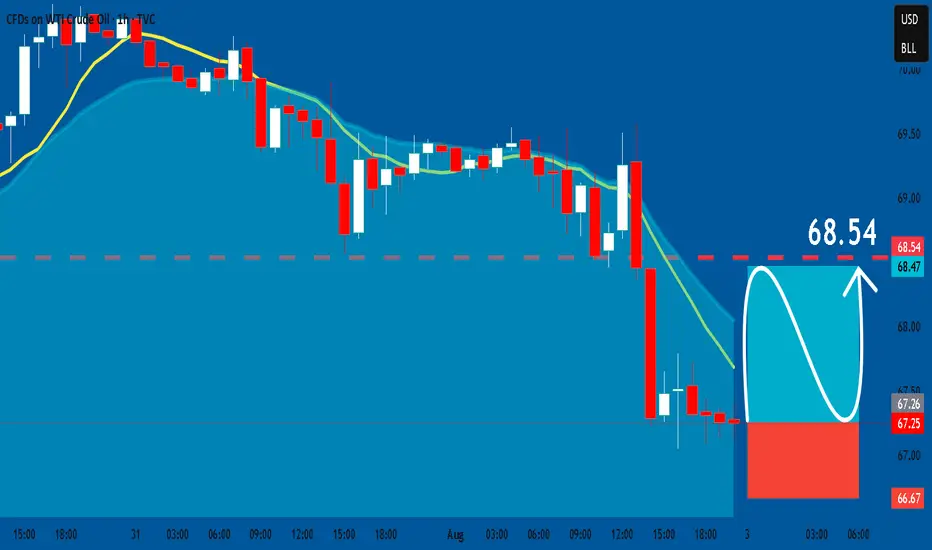
USOIL: Long Trade with Entry/SL/TP
USOIL
- Classic bullish pattern
- Our team expects retracement
SUGGESTED TRADE:
Swing Trade
Buy USOIL
Entry - 67.25
Stop - 66.67
Take - 68.53
Our Risk - 1%
Start protection of your profits from lower levels
Disclosure: I am part of Trade Nation's Influencer program and receive a monthly fee for using their TradingView charts in my analysis.
❤️ Please, support our work with like & comment! ❤️
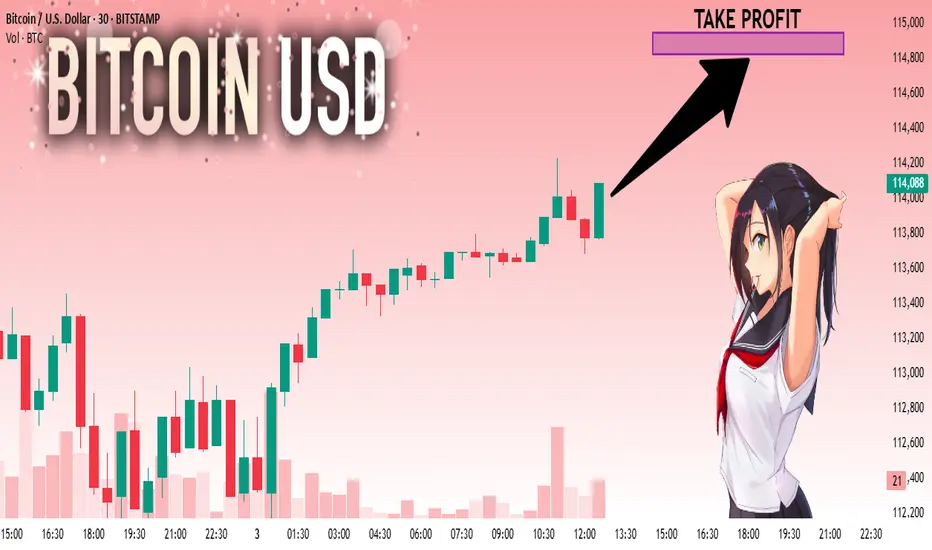
BTCUSD: Local Bullish Bias! Long!
My dear friends,
Today we will analyse BTCUSD together☺️
The market is at an inflection zone and price has now reached an area around 114,020 where previous reversals or breakouts have occurred.And a price reaction that we are seeing on multiple timeframes here could signal the next move up so we can enter on confirmation, and target the next key level of 114,821.Stop-loss is recommended beyond the inflection zone.
❤️Sending you lots of Love and Hugs❤️
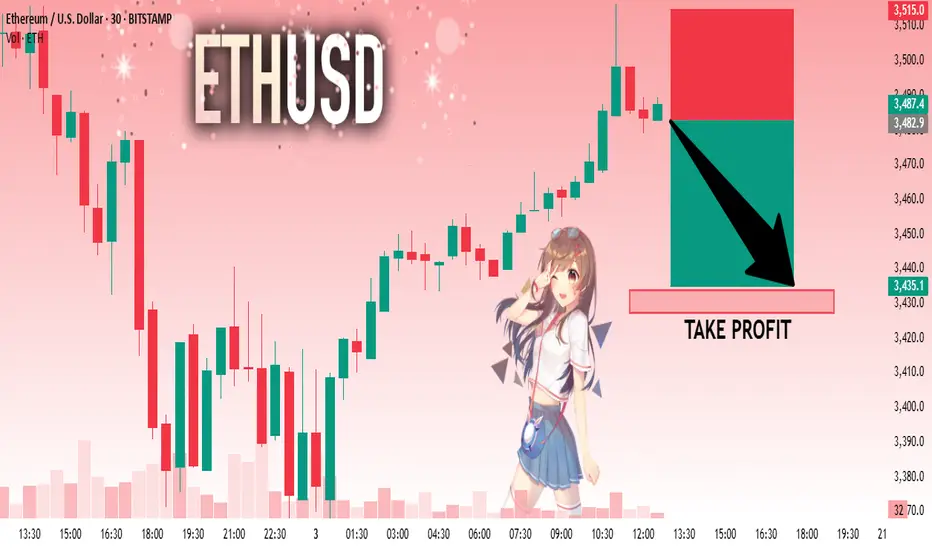
ETHUSD: Absolute Price Collapse Ahead! Short!
My dear friends,
Today we will analyse ETHUSD together☺️
The price is near a wide key level
and the pair is approaching a significant decision level of 3,482.9 Therefore, a strong bearish reaction here could determine the next move down.We will watch for a confirmation candle, and then target the next key level of 3,433.9..Recommend Stop-loss is beyond the current level.
❤️Sending you lots of Love and Hugs❤️
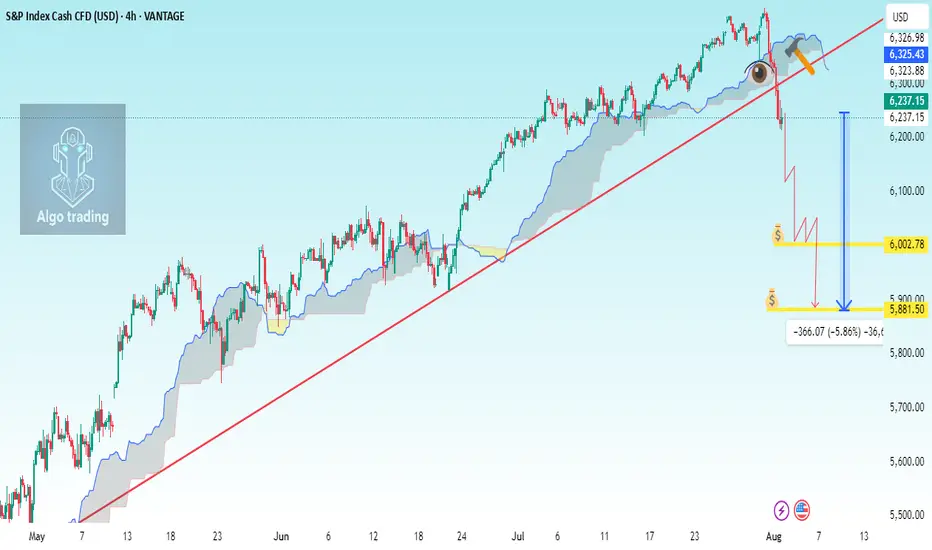
SP500 H4 analysis Breakdown TrendlineChart Components Observed:
Ichimoku Cloud: For trend and support/resistance visualization.
Uptrend line (manually drawn): Connecting higher lows since early May 2025.
Support break: Price has recently broken below the trendline and below the Ichimoku cloud.
Current Price: 6,237.15 (▼ -1.64%)
---
📉 Analysis Summary:
The trendline and Ichimoku cloud were acting as major dynamic support.
A bearish breakdown has occurred — price closed below the trendline and the cloud.
This suggests a potential trend reversal or correction underway.
---
🎯 Trade Setup Suggestion (Short Entry)
🟢 Entry Target (Short Position):
Sell Entry: Around 6,237 – 6,245 (current zone or slight pullback)
If price retests the underside of the broken trendline/cloud, that's a better entry confirmation.
📉 Take Profit Levels:
1. TP1: 6,130 (recent consolidation zone)
2. TP2: 6,000 (psychological + historical support)
3. TP3: 5,880 (next major support based on previous consolidation in early June)
🛡 Stop Loss:
SL: 6,300 – 6,310 (above the cloud and broken trendline for safe buffer)
---
📊 Risk Management:
Position size should be based on your account size, using 1–2% risk per trade.
Watch the S&P futures and macro news (e.g., U.S. data, Fed news) to avoid whipsaw.
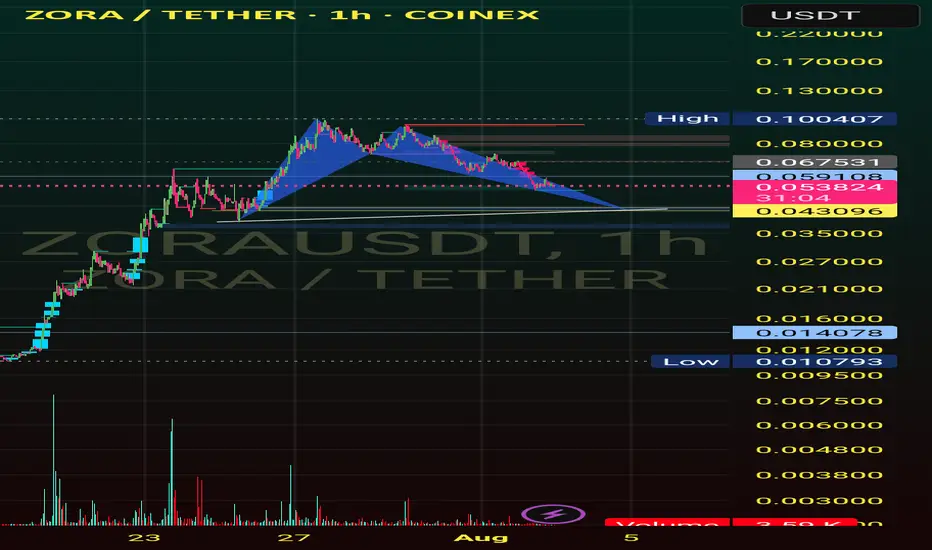
Cypher patternI see a Cypher Pattern on this chart, which could correct to lower areas for now. Again, please trade with your own analysis, I am not responsible for your profits or losses.📉
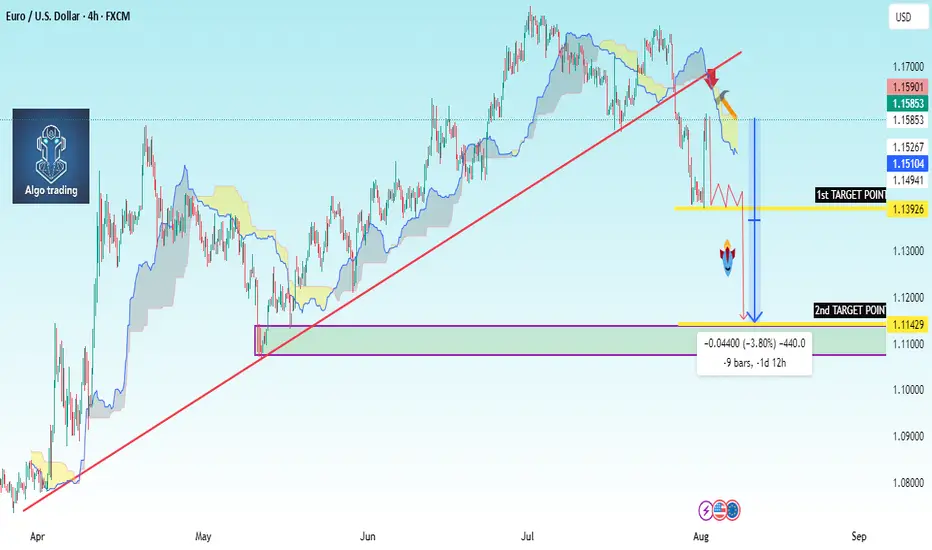
EUR/USD Chart Summary (Bearish Setup):Trendline Break: A long-term bullish trendline has been broken.
Price below Ichimoku Cloud: Indicates bearish momentum.
Bearish Retest: Price pulled back to retest the broken trendline and is now forming a bearish continuation pattern.
Double Target Zones Identified:
1st Target Point: ~1.1329
2nd Target Point: ~1.1144
---
🟠 Suggested Trade Setup:
🔹 Entry (Sell):
Around 1.1585 (where price is hovering now; or on a small pullback).
🔻 Take Profit (TP):
🎯 TP1: 1.1329 (short-term target)
🎯 TP2: 1.1144 (main target if bearish momentum continues)
🛑 Stop Loss (SL):
Place above the recent swing high or cloud resistance — around 1.1670
---
📊 Risk-Reward:
TP1 = ~250 pips
TP2 = ~440 pips
SL = ~85 pips
This gives you a favorable risk-reward (1:3+ to TP
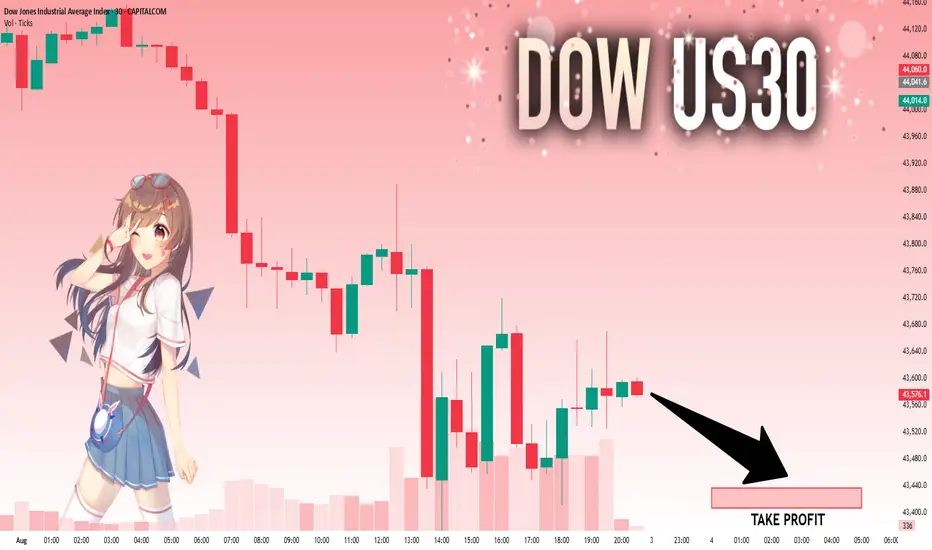
US30: Will Go Down! Short!
My dear friends,
Today we will analyse US30 together☺️
The recent price action suggests a shift in mid-term momentum. A break below the current local range around 47,577.1 will confirm the new direction downwards with the target being the next key level of 43,436.6 .and a reconvened placement of a stop-loss beyond the range.
❤️Sending you lots of Love and Hugs❤️