DXY I Short-term Short from Resistance Welcome back! Let me know your thoughts in the comments!
**DXY - Listen to video!
We recommend that you keep this pair on your watchlist and enter when the entry criteria of your strategy is met.
Please support this idea with a LIKE and COMMENT if you find it useful and Click "Follow" on our profile if you'd like these trade ideas delivered straight to your email in the future.
Thanks for your continued support!
Brian & Kenya Horton, BK Forex Academy
TERM

SHIBUSDT Analysis - 30 OctoberSHIBUSDT Analysis - 30 October
Hello Guys, Today's Analysis is on the SHIBUSDT Symbol in a 1H Time frame, I Hope it Will be Useful for You, Don't Forget to Like, Follow, Comment

xxxUSD ShortInflation is just at corner ...
We should be expecting 5th wave completion ...
This excitement might be temporal.
Dollar index is still bullish ...
Looking for shorting entry will be much safer ..

Testing Crypto Trading EMA 200, RSI and QQE MODTesting Crypto Trading
Using 200 EMA
RSI
QQE MOD
15mins scalping
Following youtuber strategy so let's see if it works
I will show you the result in my next video
Thank you

COTI long - soon break weekly trend?I belive in this scenario. And I try to find good short time trend break 1h/4h. I look for the perfect entry (with small leverage) that I could hold until and after COTI break the weekly trend.

Armónico Bear TrendInteresting stock, Armonic trend, the stock is in obviously bear Market, and it seems will continue in this way. The earnings were below the expectation. The price is continuing its downtrend and the price is using the moving average of the 50 periods as resistance that push down the price. Let's in the coming weeks if the trend will reach the area of attention between levels 152.15 and 119.88.

EUR/USD Idea Short Term and Long Term Hey! Hope you doing well!
We see EUR/USD like this...
What you think?
Enjoy! Follow us! And give a look to our website down there!
Nice profits to all!

Daily review of BTC interval 4HHello everyone, let's take a look at the BTC to USDT chart over the 4 hour timeframe. As you can see, the price is moving above the local downtrend line.
Let's start with the designation of the support line and as you can see the first support in the near future is $ 20,329, if the support breaks down, the next supports are $ 19,917, $ 19,561 and $ 19,211.
Now let's move to the resistance line as you can see the first resistance is $ 21006, if you can break it the next resistance will be $ 21796 and $ 22838.
Looking at the CHOP indicator, we can see that in the 4-hour interval the energy has been used, and the MACD indicator shows a local upward trend.

PolkaDot - A Good Opportunity in Long term? Current trading values are similar to the ones in 2020 December when the coin was first launched.
I believe we will see Polka rising to its former Higher Highs before the end of this year.

EURGBP LONG IDEAIf this triggers as planned I'll be risking 1% and aiming at September's high. Expecting 20:1 reward to risk.

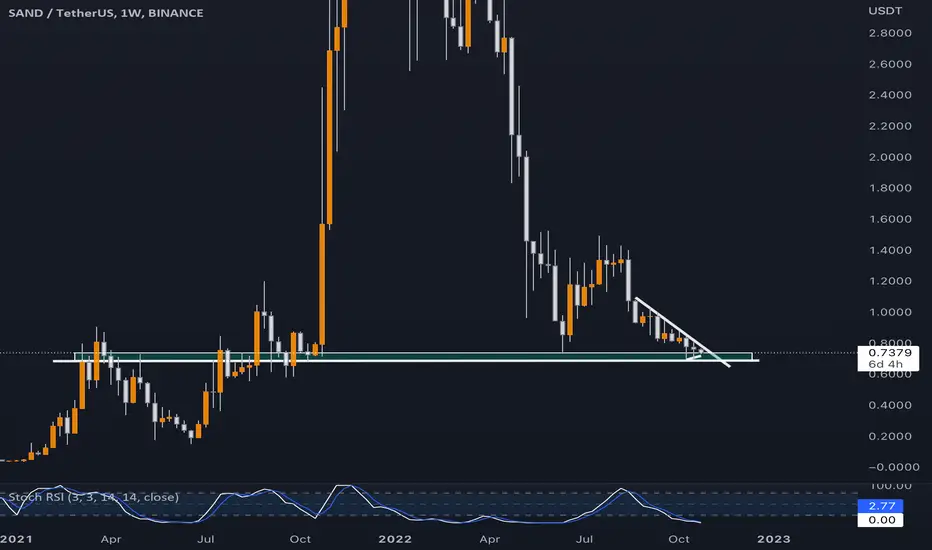
SAND long - 11 x from all time highOn weekly basis - RSI "screams" oversold . It's look like the right time to DCA - no financial advice :) . I'm not sure we will see much cheaper SAND than now. This "trade" is only about fundamentals and long time hold. 0.70-0.72 it's a great buy for me.
BTC adoption speculation/idea(max pain)Just and idea based on tech adoption that fits an upcoming recession combined with wave analysis on price with in house tools.
This is the worst case (most painful and profitable) scenario that I can imagine if more than 50% of the world adopt BTC.
More of a qualitative chart than a quantitative chart!
Let me know your opinion!
Author Dimitrios Michos

Triangle Pattern Breakout in 1 WTF!!!>Good Triangle Break -Out
>Wait for the Break-Out from Mid-Term Resistance
Diwali Pick ... Hold long term followed by the Momentum!!!

BTC/USDT Revive 1D IntervalHello everyone, I invite you to the BTC to USDT review for 1 day.
First, with yellow lines, we can mark the triangle in which the price has been moving for a long time,
then, using the blue lines, we can similarly calculate a triangle for the price, taking into account the shorter time period.
Now let's check what support we should take into account and as you can see, in the first place we have a support zone from eighteen thousand six hundred ninety three dollars to eighteen thousand one hundred twenty nine dollars, then we can mark the support lines at a price of seventeen thousand five hundred ninety five dollars.
Then, using the Trend Based Fib Extension tool, we will set the points of resistance that BTC must overcome in order to exit the current downward triangle upwards. We have the first resistance at nineteen thousand one hundred and seventy-seven dollars, the second at nineteen thousand five hundred and sixteen dollars, the third at nineteen thousand eight hundred and two dollars, another at twenty thousand seventy-nine dollars, and twenty thousand four hundred and sixty-four dollars.
Finally, let's pay attention to the CHOP index which indicates that the energy is rising again, and the MACD indicator shows a local downward trend.

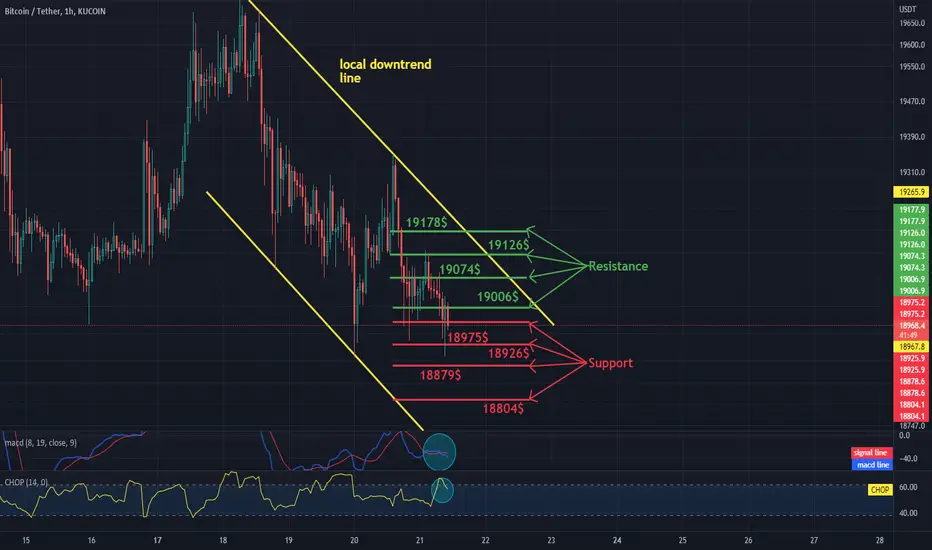
Daily review of BTC interval 1H short-termHello everyone, let's take a look at the BTC to USDT chart over the 1 hour timeframe. As you can see, the price is moving in the downtrend channel.
Let's start with the designation of the support line and as you can see the first support in the near future is $ 18,975, if the support breaks down, the next support is $ 18,926, $ 18,879 and $ 18,804.
Now let's move from the resistance line as you can see the first resistance is $ 19,006, if you can break it the next resistance will be $ 19,074, $ 19,126 and $ 19,178.
Looking at the CHOP indicator, we can see that we still have a lot of energy in the 1-hour interval, and the MACD indicator shows a local downward trend.
ADA will retest the supportada was fallen by breaking strong daily support and it now it reacted for strong weekly support now the previous support will become resistance soon(SBR)

#BTCUSDT LONGBitcoin in weekly Time Frame Volume shows that they are big buyers coming to the market. What I'd like to see in the coming months is a quick price manipulation towards 14-16K and then a 3 to 6 months rally to start for BTC. Targets are shown in the chart for this move

Long terme Double bottom + W Monthly + cup and handle pattern?Bullish Cup with Handle is a bullish continuation pattern that marks a consolidation period followed by a breakout. There are two parts to the pattern: the cup and the handle. The cup forms after an advance and looks like a bowl or rounding bottom. It's very similare to double bottom or even W monthly. The more the figure is in long time frame, the more the impulse will be strong.

8300 Minimum Pips reward for SWING TradersUS Dollar index has been in an overall BULLISH since double bottom chart formation formed at price level 90.00 and it will likely continue in same direction over the next couple of months painting a picture of a repeat of 01 Feb 1985 historical price action, leading the price to 164.50 target
Consequently, that will play out if price will be able to Break the minor resistance yellow line at 120.50 giving a take away of about 8300 Pips over the next few months.
Swing traders will pose for hopping on the pull backs as the trend continues higher

Buy for CADJPYAs the is preparing to take another try.
The pullback is done and the daily trend is launching again.

all time bitcoin analysisall time bitcoin analysis fort the next 3 years
all time bitcoin analysis fort the next 3 years
all time bitcoin analysis fort the next 3 years
all time bitcoin analysis fort the next 3 years

BTC bottom range based RSI indicator, 24-period based on highsINDEX:BTCUSD
RSI is a trend indicator...
Based on the RSI period 24 based on the high of each candle, being oversold at 30 and overbought at 90, we have incredible results in anticipating bull runs, and always buying in the bottom range, As well as taking the operation to optimal sales values
In 2017, the sale indication was at the exact top, in 2020/2021, on the other hand, the sale was well anticipated, but still very profitable, but the repurchase came at much better values than the sale is soon a success.

Daily review of BTC interval 4HHello everyone, let's take a look at the BTC to USDT chart over the 4 hour timeframe. As you can see, the price is moving in the sideways trend channel marked with white lines.
Let's start with the support designation, and as you can see, we first have support zones ranging from $ nineteen thousand fourteen to $ eighteen thousand seven hundred eighty-two, then we have support zones of about eighteen thousand four hundred and sixty-eight dollars, right on the lower end of our channel.
Now let's move on to the resistance, and we are the first to have zones of resistance from nineteen thousand two hundred and eight dollars to nineteen thousand three hundred and forty-six dollars. In contrast, the second zone is from nineteen thousand five hundred and seventy-nine dollars to nineteen thousand seven hundred and thirty-nine dollars.
Looking at the CHOP indicator, we can see that in the 4-hour interval the energy has been depleted, while the MACD indicator shows that we are close to entering the local upward trend.
