Tesla Stock Lifts 2025 Gains to 20% as Traders Eye Santa RallyA megacap squeezing in one more rally before year-end? Yes, please.
🚗 A Holiday Glide Higher for Tesla Shares
Tesla NASDAQ:TSLA is heading into December with solid momentum. Coming into Monday, the stock has risen 20% since January, putting it on track for a third straight annual gain .
Investors will gladly take it. Tesla isn’t exactly a low-volatility cuddle toy — this is a stock that fell 65% in 2022, then turned around and doubled in 2023, then tacked on another 63% in 2024.
Still, the long arc is impressive: since Tesla's 2010 IPO, the stock has only posted annual declines twice — in 2016 and that infamous crash year of 2022. This year’s 20% gain looks tame by Tesla standards, but context matters: tame is good.
🎅 Santa Rally Season: Will Tesla Join the Party?
This is the time of year when traders start looking for that special year-end swing called Santa rally.
Fortunately, December has been good to Tesla shares. Really good. The stock has risen in more than half of all Decembers since its flotation 15 years ago, with nine monthly gains and six declines over its life as a public company.
Why does the Santa rally happen?
• Some say it’s psychology: investors in a good mood tend to buy.
• Some say it’s portfolio managers smoothing out their year-end reports.
• Others point to tax strategies, retail flows, or just holiday optimism.
No one really knows — which makes it the perfect market myth. But if Santa does show up this year, Tesla benefits. A few cheerful sessions could be enough to lock in another positive annual finish.
Just don’t confuse December with easy money. Historically, it’s just as volatile as every other month — and sometimes worse.
🔥 When December Isn’t So Jolly
Want a reminder that Tesla can rewrite the script in both directions? Look no further than December 2022, when the stock plunged 37% in a single month.
Back then, investors worried CEO Elon Musk’s bold acquisition of Twitter (now X) was consuming far too much of his attention — at the cost of Tesla’s market cap.
The 2025 backdrop is far calmer. Today’s concerns are more traditional Tesla fare:
• How many cars will it deliver?
• What will margins look like?
• Is the growth runway intact?
• What type of robots will Elon talk about on the next call?
December can still swing.
📦 Deliveries: The Real Catalyst on Deck
But traders love a year-cap rally. Even more so when there’s something to bet on.
Expectations for Tesla’s Q4 2025 deliveries sit between 507,000 and 512,000 vehicles, a number that would help confirm a steady, if not explosive, growth narrative.
More importantly, full-year 2025 deliveries are projected to exceed 2 million units, aligning with Elon Musk’s long-term growth target of 20–30% year-over-year production.
In Tesla’s world, hitting numbers is the difference between “Tesla has momentum” and “Tesla is broken again.”
That means Q4 data — arriving Thursday, January 1 or Friday, January 2, 2026 — will be key for this year’s narrative. The numbers drop early in the morning while everyone is still recovering from celebrations, and suddenly your phone buzzes with either joy or existential dread.
Earnings are a big factor, too. The next report date, as per the earnings calendar , is set for January 28.
🎁 The Takeaway: A Rally Within Reach
Tesla’s 20% gain in 2025 looks solid heading into the final stretch, and seasonality is on its side.
• December tends to be kind.
• Santa rallies tend to lift boats.
• Analysts are optimistic about deliveries.
• The stock has historical resilience.
But this is still Tesla — a stock with a personality, a fanbase, a fierce opposition , and a volatility profile that can make your stomach churn.
Off to you : How do you see Tesla stock performing in December? Share your views in the comments!
Tesla

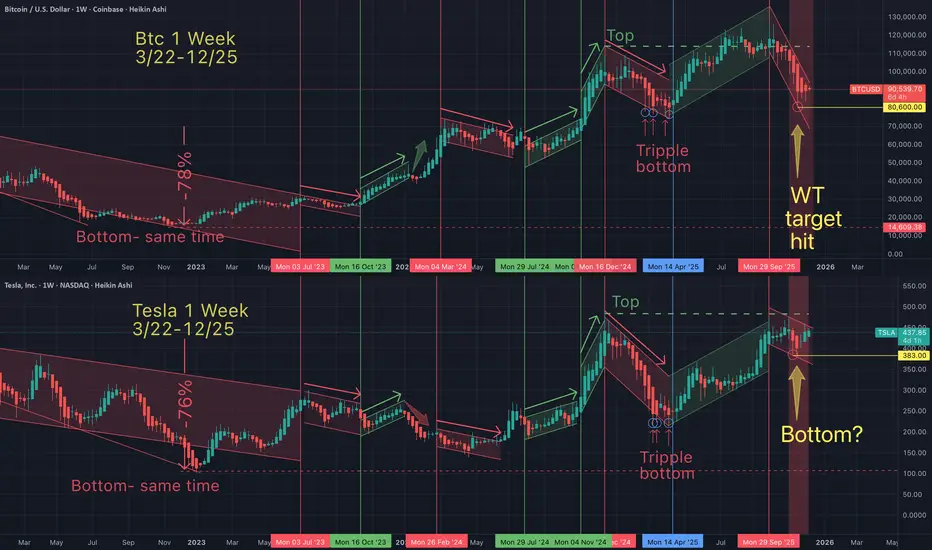
Another (New) Fractal? - Tesla vs Bitcoin What does it mean that 2 completely unrelarted assets are moving simultaneously?
Several of you have asked me how we can capitalize on fractals. So after 50 days of tracking Tesla vs palantir, we learned how one asset can be a leading indicator for the other (pls refer to previous charts). That pattern was identical for over 2 months, except that fractal suggested that Tesla would also break to new all time highs. That hasn't happened yet, but I believe today's Btc vs Telsa chart (above) confirms last week's low as the anticipated Btc bottom ($80K-$84K). This Btc bottom confirmation (of a highly correlated assest), adds further conflunce to my ongoing Tesla buy zone charts that have called for a max bottom of $373.
Note: So far Tesla's retrace came within 2% of that target on Nov 14. Today, Tesla is up 16% from that target low.
So is this further confluence that Tesla has reached it's bottom?
But back to the original question. If these charts are graphs, with "coordinates" x and Y...and linear equations seem to govern how "price action respects trandlines"...then can any of you math nerds out there explain how price action follows strangley predictable trendlines.
More importantly, please explain how two completely indepent assests can have this same trendline phenomenom simulateneously...for months ("a fractal")?
May the (universal mathematical) truth be with you.
Cue in song: "Wake Up" - By Rage Against The Machine
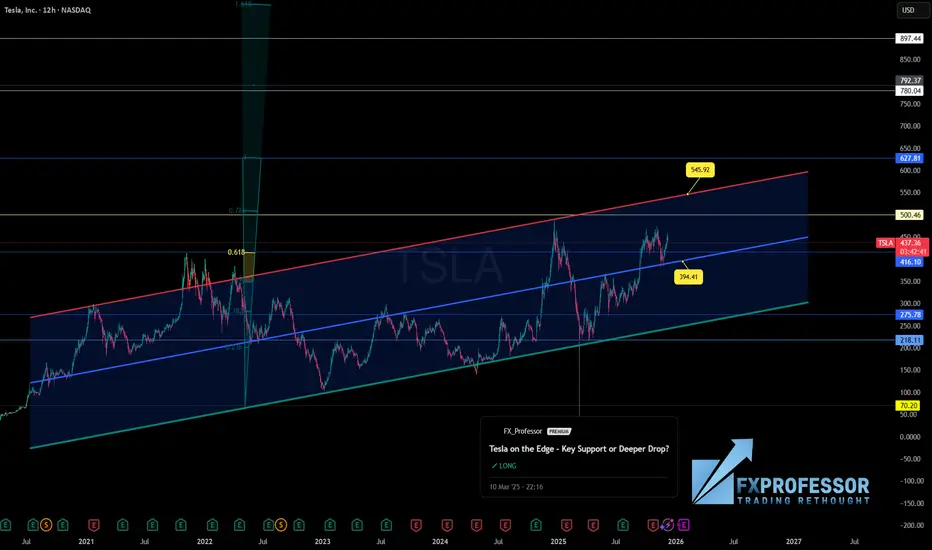
Key Support Worked, but What’s Next for TSLA? 📈 Tesla on the Edge — Key Support Worked, but What’s Next for TSLA? 🔍
Earlier this year, we tagged a textbook support at $218, right on the lower boundary of this macro regression channel — and price respected it beautifully. We’re now trading +100% above that level, just below the $500 psychological barrier and brushing the 0.618 retracement from the all-time high.
Current Key Levels:
• Support: $394.41 and $380.55 — both dynamic mid-channel
• Resistance: $500.46 and upper channel at $545.92
• Fib Golden Ratio: 0.618 zone still acting as macro resistance
Price is clearly in a pause zone — not bearish yet, but no longer early either. The rally from $218 to $440+ matured fast. Momentum may need to cool off unless we get new catalyst fuel.
🔋 Enter the newsflow:
Tesla is pushing hard on a dual front — lower vehicle prices (Model 3 Standard) to protect sales volume, and ambitious bets on AI + autonomy (FSD 14.2, robotaxi rollout). Musk’s recent push to allow "texting while driving" under FSD has regulators watching closely — and so are we.
This means Tesla isn’t just reacting — it’s recalibrating. The market’s trust in these moonshots (robotaxi, Optimus, autonomy) could define the next leg.
Bull Path? Break $500–545 and Tesla could target $627 or even $780+
Bear Path? Lose $394–380 and we likely retest the $275 zone
📉 For now, I expect sideways compression between $380–500 as macro narrative battles chart structure.
Thought of the Day 💡
Most traders get stuck chasing late moves. But if you map the macro channel, learn to wait for value zones, and stay calm when price goes vertical — you’ll separate yourself from the herd. TSLA’s big move already happened. Now comes the patience game.
Disclaimer: What you read here is not financial advice — it’s high-level market philosophy from the FXPROFESSOR himself. Risk is real, and your capital is your responsibility. Learn, adapt, evolve.
THIS TESLA / BTC FRACTAL - IS A MAPThis is an expanded view of today's chart (posted earlier). I wanted to offer a broader context. On this "channel", I'm trying to focus on Tesla & related charts. Since I'm not posting anymore Tesla (single asset) charts, until a new all time high has been reached, I thought I would continue to pose questions in the meantime. Like "what is a fractal, mathematically?"...to encourage you to pull the curtain to the side and see the wizzard behind the curtain.
This isn't OZ, this is a digital casino, that has a casino agenda. If you don't know WHAT that is, and HOW that works, then should you really be investing your money. Until newbies figure that out & learn what is truly governing price action...I will try and provide some maps and share some of my *basic trading ideas with you. Most of all encourage you to educate yourselves and LEARN TA!
For those of you that have & will private message me with requests for shortcut secrets to success, I will ONLY say this.
1-Pick 1 asset
2-Start learning TA now, and apply it ONLY to your 1 asset
3-Study it's price action for 10,000 hrs (about 5 yrs full time)
4-Realize that the same patterns are repeating across all assets.
For those of you that are too busy or unmotivated to study:
If you dont want to work for your money, then how can you expect your money to work for you?
May the Trades be with you.

Tesla Rejected at Key Breakout — Bullish Structure Still Intact NASDAQ:TSLA just got rejected at a major breakout level, but the bigger picture remains bullish. Price action shows a healthy uptrend with momentum building, suggesting this could just be a pause before continuation. As volume trends higher on dips, it hints that buyers are still active—just waiting for cleaner levels.
📅 With the FOMC coming up, expect potential de-risking or volatility across markets. That could drag TSLA lower short term, but it also opens the door for a cleaner entry near strong support. Watching the $421–$428 range for signs of a bounce or consolidation.
🔽 Trade Plan
Entry Zone: $421 – $428
Take Profit 1: $456
Take Profit 2: $488
Stop Loss: $408
TESLA TO BTC & TOTALThis analysis compares NASDAQ:TSLA performance relative to BINANCE:BTCUSDT .
As you can see, Tesla’s stock is showing a bullish stance against Bitcoin and appears to be at the beginning of its Elliott Wave 3.
This chart delivers Four key messages:
1.Bitcoin is expected to decline while Tesla moves higher
2.Bitcoin is expected to drop while Tesla moves into a range
3.Both are expected to decline, but Tesla is likely to fall less than Bitcoin
4.Both rise, but Tesla gains more.
I’d be happy if you shared your thoughts.
NASDAQ:TSLA
BINANCE:BTCUSDT
CRYPTOCAP:TOTAL
BINANCE:BTCUSD

Tesla Reversal Signal Triggered at the 200 SMA!TSLA 🚗 Bullish Pullback Playbook — Smart Layered Entry Setup!
📈 Asset:
TSLA — Tesla Inc. (NASDAQ)
Swing Trade Playbook | Trend-Continuation Setup
🧠 Market Thesis
TSLA shows a bullish pullback into the 200-Day Simple Moving Average, a level historically respected by trend-followers. The latest Heikin-Ashi Doji Reversal signals buyers regaining momentum ⚡ — suggesting the pullback is stabilizing and demand is stepping back in.
This combination of trend support + reversal confirmation forms the core of this structured swing setup.
🎯 Plan Overview
A clean bullish continuation strategy using a refined layered entry method (professionally framed as “scaled limit entries”). This maintains your signature thief-style energy, but aligned with TradingView rules and presentation standards. 😎
🟢 Entry Plan (Layered / Scaled Limit Orders)
Using a scaling approach allows better average pricing during volatility.
Proposed buy-limit layers:
Buy Limit 1 → $420.00
Buy Limit 2 → $410.00
Buy Limit 3 → $400.00
👉 Traders may increase or reduce the number of layers based on risk tolerance and personal strategy.
🔻 Stop-Loss (Risk Control)
A defensive stop-loss is placed near $380.00, below recent liquidity pockets and under the 200 SMA structure.
⚠️ This level is optional — traders should select their own SL based on personal risk management.
🎯 Take-Profit Zone
Target area sits around $470.00, where:
Major historical resistance awaits
Overbought conditions often develop
High-volume sellers tend to re-enter
This zone is treated as a profit-taking escape point, but traders can exit based on their own judgment.
📡 Related Markets to Watch (Correlation Insight)
Keeping the global view helps improve trade confidence:
NASDAQ:QQQ — High correlation with mega-cap tech, TSLA often follows Nasdaq momentum.
NASDAQ:NDX — Strong tech index correlation; strength supports TSLA continuation.
SP:SPX — Broad-market risk sentiment gauge.
NASDAQ:NVDA / NASDAQ:AMD — Momentum flow in growth-tech impacts liquidity rotation into TSLA.
AMEX:XLY — Consumer Discretionary ETF (TSLA is a major component).
Key takeaway:
Strong tech-sector momentum + risk-on environment = enhanced TSLA bullish continuation probability 📊⚡
🧰 Notes for the Community
Dear Traders (Thief OG-style Family 😄) —
SL/TP levels shared here are only examples for educational purposes. You’re always free to manage your own positions using your own risk preferences. Trade smart, trade safe, trade stylish. 💼✨
✨ “If you find value in my analysis, a 👍 and 🚀 boost is much appreciated — it helps me share more setups with the community!”
This is a thief-style trading strategy presentation strictly for fun and educational purposes. Not financial advice.
#TSLA #Tesla #SwingTrade #BullishSetup #LayeredEntries #HeikinAshi #200SMA #NASDAQ #MomentumTrading #TechnicalAnalysis #TradingView #RiskManagement #TraderLifestyle #StockMarket

TESLA: Weak Market & Bearish Forecast
Remember that we can not, and should not impose our will on the market but rather listen to its whims and make profit by following it. And thus shall be done today on the TESLA pair which is likely to be pushed down by the bears so we will sell!
Disclosure: I am part of Trade Nation's Influencer program and receive a monthly fee for using their TradingView charts in my analysis.
❤️ Please, support our work with like & comment! ❤️

Tesla $TSLATesla (TSLA) has launched new, more affordable "Standard" versions of its Model 3 and Model Y vehicles across Europe, a strategic move aimed at countering a sharp decline in sales within the region. This decline is attributed to intensifying competition from rival automakers and the polarizing political commentary of CEO Elon Musk, which has alienated some potential buyers.
Pricing and Product Details
In key European markets like the Netherlands, Tesla has significantly reduced entry prices. The Model 3 Standard is now listed at 36,990 euros ($43,130), a notable discount compared to the 45,990 euros ($53,620) for the Premium Long Range version. Similarly, the Model Y Standard is priced at 39,990 euros ($46,630), versus 50,990 euros ($59,450) for its Premium Long Range counterpart.
These Standard models are "de-contented," meaning they come with reduced specifications to achieve the lower price point. Key omissions and changes include:
The use of cloth seats instead of premium materials.
The removal of the rear passenger infotainment screen.
The absence of a glass roof.
Simplified interior lighting.
Less powerful electric motors and a decreased driving range per charge.
Both the Model 3 and Model Y Standard variants are available for delivery as soon as December. For context, in the United States, the Model 3 Standard starts at $36,990 and the Model Y Standard at $39,990.
European Sales Slump and Contributing Factors
The introduction of these budget-friendly models comes at a critical time for Tesla in Europe. According to data from the European Automobile Manufacturers' Association (ACEA), Tesla's vehicle registrations—a proxy for sales—plummeted by 48.5% year-over-year in October 2024, to just 6,964 units.
This decline starkly contrasts with the broader market trends. In the same period, total electric vehicle registrations across the European Union, UK, and European Free Trade Association surged by 32.9%, while overall vehicle registrations (across all powertrains) grew by 4.9%.
Analysts point to a confluence of factors behind Tesla's regional struggles:
Fierce Competition: The European EV market is becoming increasingly crowded with compelling offerings from both established European brands and new Chinese entrants.
Economic Headwinds: As CEO Elon Musk has noted, higher interest rates and an uncertain economic outlook are dampening consumer demand for big-ticket items.
CEO Polarization: A significant, albeit harder-to-quantify, factor is the backlash from some European consumers against Musk's public embrace of far-right political figures in the region and his contentious relationship with former U.S. President Donald Trump. This has led to a reputational challenge that may be affecting brand consideration.
Market Reaction and Technical Outlook
Tesla's stock (TSLA) showed little immediate movement on the news of the Standard model launch. However, shares are up approximately 6% for the week, largely buoyed by a recovery in the broader technology sector.
From a technical analysis perspective, the stock has identified two key support zones: the first at the 0.236 Fibonacci level (around $406) and a secondary, stronger support at the 0.382 Fibonacci level (around $354.94). On the upside, two primary take-profit targets have been established at $500 and $520 per share.
A Potential Catalyst: Regulatory Progress on Full Self-Driving
In a potentially positive development, the Netherlands' RDW vehicle authority has established a formal schedule for Tesla to demonstrate its Full Self-Driving (FSD) technology in February 2025. The purpose is to assess whether it meets European regulatory requirements. It is crucial to note that FSD has not yet been approved for use in Europe.
Securing approval from even a single European national regulator would represent a monumental step forward for Tesla. It could serve as a powerful differentiator in the market and a significant catalyst to help reverse the company's sales decline on the continent.
Conclusion
The launch of the Standard Range Model 3 and Model Y is Tesla's direct countermeasure to reignite demand in a critical but challenging European market. While the lower price point may attract more budget-conscious buyers, it remains uncertain whether this move alone can overcome the headwinds of competition, economic conditions, and brand perception. The upcoming FSD demonstration to Dutch regulators in February presents a separate, high-stakes opportunity that could substantially alter Tesla's trajectory in the region in the medium to long term.

TSLA — [2D] WEEK 49 TREND REPORT | 12/04/2025TSLA — WEEK 49 TREND REPORT | 12/04/2025
Ticker: NASDAQ:TSLA
Timeframe: 2D
This is a reactive structural classification of TSLA based on the weekly chart as of this timestamp. Price conditions are evaluated as they stand — nothing here is predictive or forward-assumptive.
⸻
1) Current Trend Condition [ Numbers to Watch ]
Current Price @ 447.66$
• Trend Duration : +7 Days (Bullish)
• Trend Reversal Level ( Bearish ): 418.70$
• Trend Reversal Level ( Bearish Confirmation ): 428.42$
• Pullback Support : 413.70$
• Correction Support : 354.94$
⸻
2) Structure Health
• Retracement Phase:
Uptrend (operating above 78.6%)
• Position Status:
Healthy (price above both structural layers)
⸻
3) Temperature :
Warming Phase
⸻
4) Momentum :
Bullish
⸻
Author’s Note
UPWARD STRUCTURAL ALIGNMENT
This mark reflects a point where market behavior supported the continuation of the existing upward direction. It does not imply forecasting or targets — it simply notes where strength became observable within the current trend. Its meaning holds only while price continues to respect the broader structural levels that define the trend.
⸻
Methodology Overview
This classification framework evaluates directional conditions using internal trend-interpretation logic that references price behavior relative to its structural layers. These relationships are used to identify when price movement aligns with the framework’s criteria for directional phases, transition points, or regime shifts. Visual elements or structural labels reflect these internal interpretations, rather than explicit trading signals or preset indicator crossovers. This framework is observational only and does not imply future outcomes.

Tesla - The triangle is still valid!🎀Tesla ( NASDAQ:TSLA ) can still confirm the breakout:
🔎Analysis summary:
Just two months ago, Tesla perfectly broke out of the major ascending triangle pattern. In the meantime we just witnessed a major consolidation at the all time high. Quite likely that Tesla will soon confirm the breakout, launching another parabolic rally from here.
📝Levels to watch:
$400
SwingTraderPhil
SwingTrading.Simplified. | Investing.Simplified. | #LONGTERMVISION

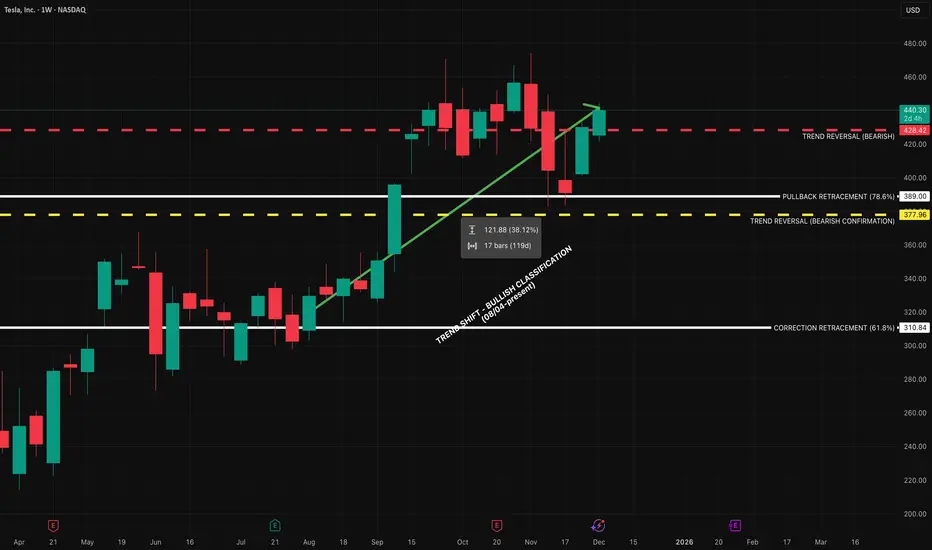
TSLA — WEEK 49 TREND REPORTTSLA — WEEK 49 TREND REPORT
Ticker: NASDAQ:TSLA — 12/03/2025 @ 440.31$
Timeframe: WEEKLY
This is a reactive structural classification of TESLA based on the weekly chart as of this timestamp. Price conditions are evaluated as they stand — nothing here is predictive or forward-assumptive.
⸻
1) Current Trend Condition
• Trend Duration: +17 weeks (Bullish)
• Trend Reversal Level (Bearish): 428.42$
• Trend Reversal Level (Bearish Confirmation): 377.96$
• Pullback Support : 389$
• Correction Support : 310.84$
⸻
2) Structure Health
• Retracement Phase:
Uptrend (operating above 78.6%)
• Position Status:
Healthy (price above both structural layers)
⸻
3) Temperature :
Cooling Phase
⸻
4) Momentum :
Bullish
⸻
5) Market Sentiment (RETAIL TRADER LINE)
Bullish
⸻
Author’s Note
This analysis is fully reactive, not predictive. Market conditions, trend structure, and behavior are classified as they appear in real time. The objective is to identify where directional shifts first occurred, where structural integrity remains intact, and where it would begin to weaken if key levels were breached.
Predictive analysis projects outcomes that do not exist yet. Without price confirmation, prediction is built on baseless assumptions. This framework avoids that entirely by responding only to verified structural changes and live conditions.
The levels shown simply identify where the current trend structure first shifted and where it would begin to lose integrity if breached. Recognizing these boundaries allows for clearer interpretation of market behavior without relying on forward guarantees, speculative projections, or unsupported assumptions.
⸻
Methodology Overview
This classification framework evaluates directional conditions using internal trend-interpretation logic that references price behavior relative to its structural layers. These relationships are used to identify when price movement aligns with the framework’s criteria for directional phases, transition points, or regime shifts. Visual elements or structural labels reflect these internal interpretations, rather than explicit trading signals or preset indicator crossovers. This framework is observational only and does not imply future outcomes.
Going Short TESLA HereTrading Fam,
I'm taking my first ever short here since implementing my new indicator. It has been killing it on the long side. We've exited our last 17 trades, all for wins, with an average profit of 30% per trade and our portfolio is up over 86% on the year. Now, it's time to test the short signals. We received two here on TSLA. I've taken a small entry since this is my first short, representing around 9% of the portfolio total. I'm going to target $350 but will not take more than a 7% loss, thus my stops are set at $476 bring the rrr on this trade entry to 1:3. Let's see how this goes.
✌️Stew

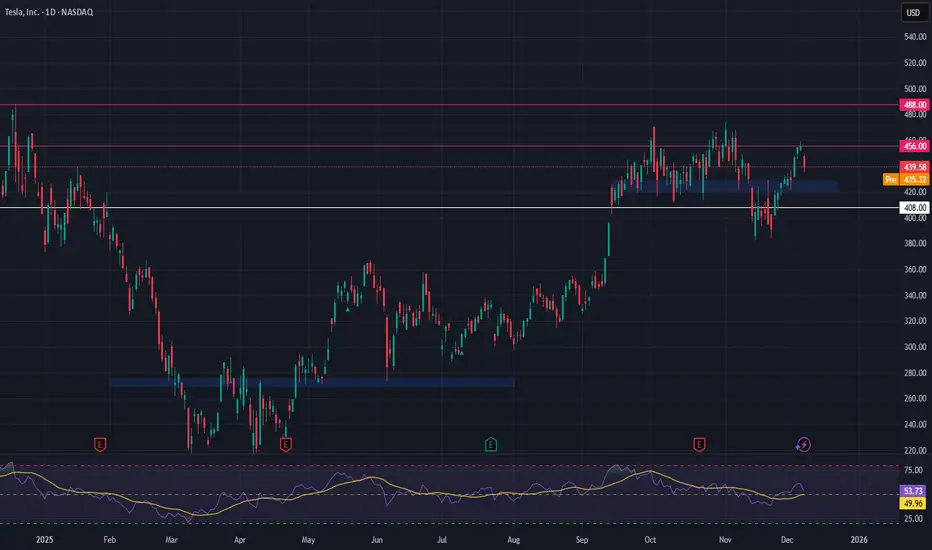
TSLA Range Breakout SetupTesla on the daily chart is stuck in a tight battleground between structure and momentum. Price is consolidating below the 20- and 60-day moving averages after a bearish Market Structure Shift in early November, while still holding above the long-term 120-day moving average. The result is a classic Bear Flag look: a sharp downside pole followed by a choppy, upward-sloping consolidation between the $400 demand zone and $440 supply zone.
As long as TSLA trades inside this band, it’s a range game. The primary path is continuation lower if the Bear Flag resolves as expected. A daily close below roughly $415 would put pressure on the $400 support and open the way toward the $385 area, aligning with the flag breakdown logic and recent downside momentum. For this bearish continuation view, a sustained close back above $430–440 would effectively invalidate the pattern and suggest sellers are losing control.
On the flip side, a clean daily close above $440 would flip the script, clearing both key moving averages and turning the zone into support. That breakout could unlock a move toward the prior October swing region around $470, with the idea invalidated if price drops back into the range and especially below $400. This is a study, not financial advice. Manage risk and invalidations.
Thought of the Day 💡: Often the edge is in letting the market show its hand at the extremes of the range, not in guessing the next candle.
-------------------------
Thanks for your support!
If you found this idea helpful or learned something new, drop a like 👍 and leave a comment, I’d love to hear your thoughts!
$TSLA: $350 Target - $380 Short (Support Breaking)The support for Tesla seems to be breaking, and the oscillators are due for a negative downtrend along with the RSI close being too high. The analysts at the same time are neutral and this has been given a buy over a strong buy target with catalysts like lower earnings in some countries and a lack of competitive advantage over BYD for actual output of vehicles produced and sold. Management is also unsure of Musk who has a huge multitrillion dollar pay package incentive which will make the company even lower on cash. Therefore, the next target for a NASDAQ:TSLA short in my opinion, is $380 or less within Q1 of 2026. As always, none of this is investment or financial advice. Please do your own due diligence and research.

TSLA daily bullish divergenceNASDAQ:TSLA is consolidating below all-time high resistance, suggesting a breakout is coming.
Wave (2) appears complete at the High Volume Node support and 0.5 Fibonacci retracement with a bullish structre flip.
📈 Daily RSI hit oversold with bullish divergence
👉 Continued downside has a target of the daily 200EMA $362
Safe trading

Tesla preparing for all time highs?NASDAQ:TSLA Price is ranging below all all-time high, well above the weekly pivot and 200EMA, which is bullish.
Wave © of C appears to be underway into price discovery with a target of $730, the R2 weekly pivot. This is because it has been printing a series of 3 wave structures. Wave B printed a triangle, which is a pattern found before a terminal move, reinforcing the Elliot wave count.
🎯 Terminal target for the business cycle could see prices as high as $730 based on Fibonaci extensions
📈 Weekly RSI is just below overbought so has room to grow
👉 Analysis is invalidated if we close back below wave (B), $280
Safe trading

TSLA: Hold or SellHello Traders,
Regarding the technical point of view!
Telsa have been previously overbought. there are two resistances on its way! 1st the dynamic and 2nd the static one!
A triangle shape has been formed!
If you have it right now, I'm more with keeping it!
But you may find more profitable stocks to buy!

10? May be for December?It's clear its bearish. Most likely it will go down this December as well. Maybe I will buy it around 10 and DCA on it if it goes down further. I think in the next 6 months this could hit $24 based on technical analysis.
Happy trading and not a financial advice.

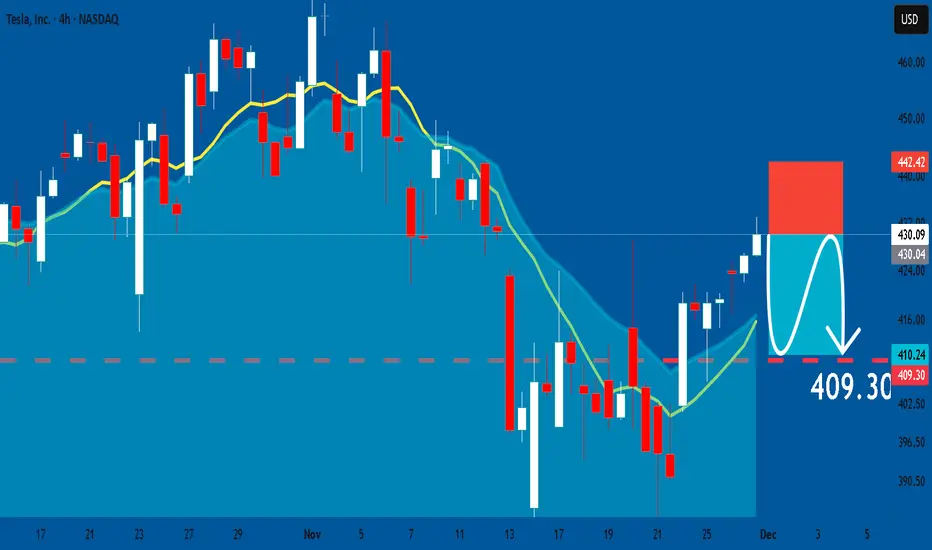
TESLA: Short Signal with Entry/SL/TP
TESLA
- Classic bearish setup
- Our team expects bearish continuation
SUGGESTED TRADE:
Swing Trade
Short TESLA
Entry Point - 430.09
Stop Loss - 442.42
Take Profit - 409.30
Our Risk - 1%
Start protection of your profits from lower levels
Disclosure: I am part of Trade Nation's Influencer program and receive a monthly fee for using their TradingView charts in my analysis.
❤️ Please, support our work with like & comment! ❤️
TSLA — Bullish Above 317.77, Targeting 544.53TSLA maintains a bullish structure as long as price holds above the key zone at 317.77.
This level represents the foundation of the current upward leg and serves as the invalidation point for the broader trend. As long as buyers protect 317.77, upside continuation remains the dominant scenario.
Price is currently reclaiming the 0.5 Fibonacci level at 424.43. A sustained close above this area strengthens bullish momentum toward 452.77 (0.618), followed by 472.47–484.48 (0.7–0.75). A breakout above these mid-range levels would open the path toward the major extension target at 544.53.
In a bearish scenario, price cannot break above the key support zone; any rally into it while trading below would be considered only a corrective bounce.
But as long as 317.77 holds, the primary outlook remains bullish.

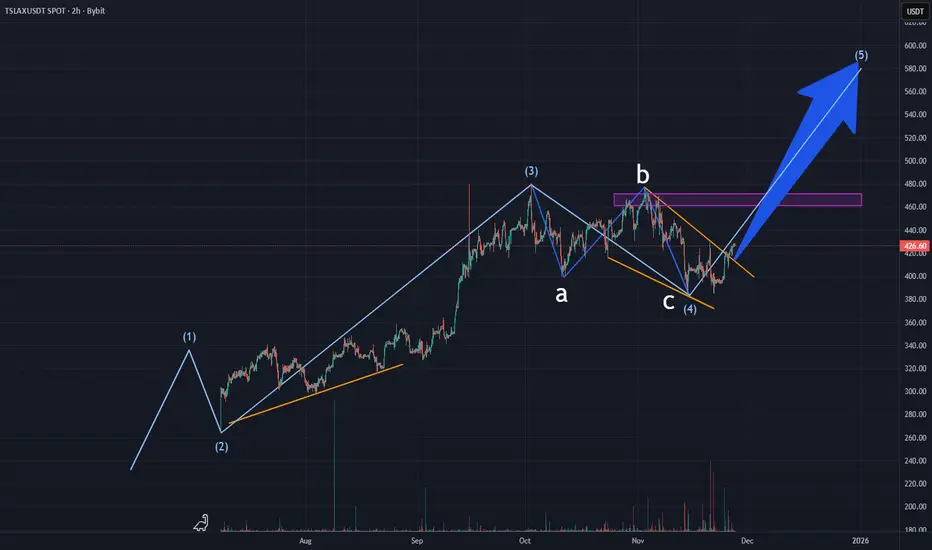
Tesla stock analysis based on Elliott WaveTesla (TSLAX, TSLA) is forming its 5th full wave of growth according to Elliott Wave Theory.
Unfortunately, the chart on TradingView is incomplete; it was created based on other sources and then transferred to TV.
ABC corrective waves (marked in blue) were most likely formed.
Above, we also see an area of liquidity that is more likely to be taken.
According to wave 3, we can predict the length of wave 5 to be around 20%.
As is well known, stock movements last somewhat longer than cryptocurrencies, and this should be kept in mind.
If the price forms a low lower than the start of wave 4, this wave structure will be considered broken, and the price may move downward.
Full breakdown on website
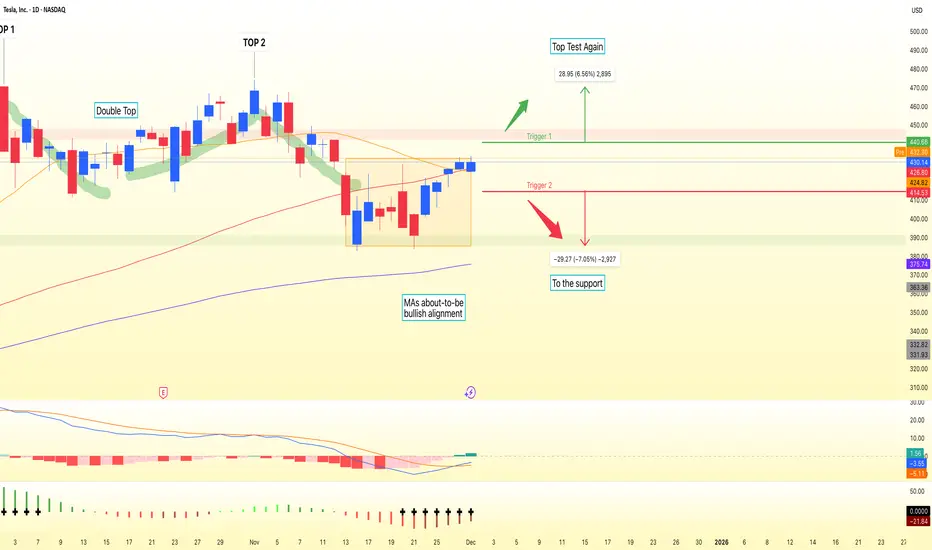
Tesla: A overview of itHi!
Trend Analysis:
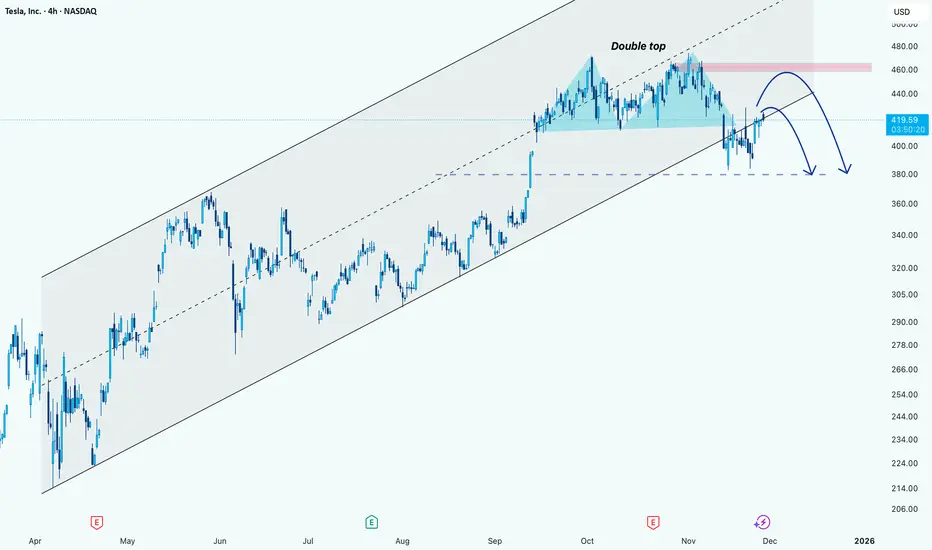
TSLA has been trading in an ascending channel for several months, with higher highs and higher lows visible since April.
The recent price action broke above the midline of the channel but is currently consolidating near the $420-$425 area.
Pattern Formation:
A Double Top pattern near the $460 level formed.
This pattern signals a potential reversal if the price fails to break above the resistance zone (marked in pink).
The neckline of this double top appears around $400, which is also a key support zone.
Potential Price Action:
Short-term rebound:
TSLA could retest the resistance zone near $455-$460.
If it fails to break this area convincingly, the double top pattern could trigger a reversal.
Medium-term correction:
If the reversal occurs at the resistance zone, price may fall toward the neckline/support area near $380.
This aligns with the lower boundary of the channel and previous support levels.