Tesla - Here comes the third breakout!🚀Tesla ( NASDAQ:TSLA ) is finally breaking out:
🔎Analysis summary:
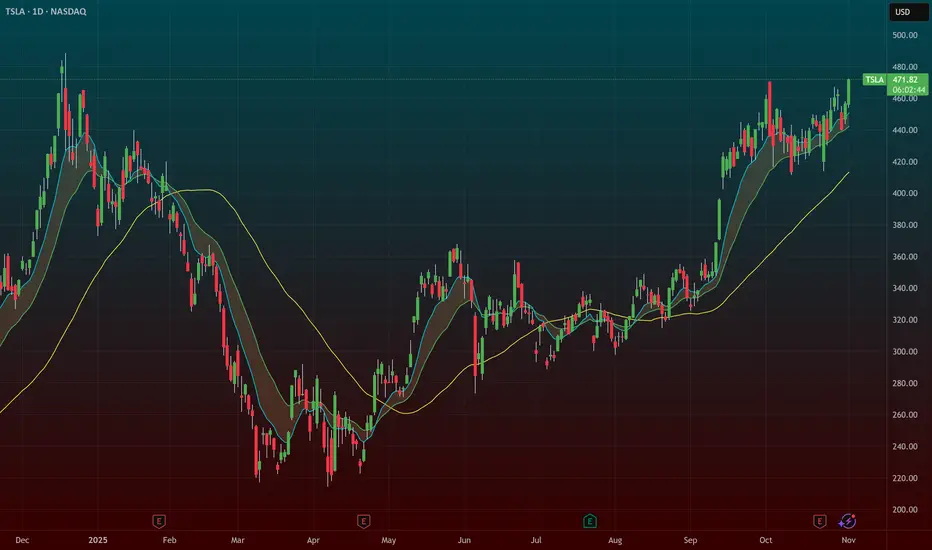
For the past four years, Tesla has been trading in a very clear ascending triangle pattern. But just last month, we finally saw the expected bullish triangle breakout. Considering all of the previous triangle breakouts, Tesla is setting up for another parabolic rally soon.
📝Levels to watch:
$450
SwingTraderPhil
SwingTrading.Simplified. | Investing.Simplified. | #LONGTERMVISION
Tesla

Musk Could Earn a Trillion: How Are Tesla (TSLA) Shares ReactingMusk Could Earn a Trillion: How Are Tesla (TSLA) Shares Reacting?
According to media reports, earlier this month Tesla shareholders approved a new 10-year compensation package for Elon Musk worth up to $1 trillion. But is this good or bad news for TSLA shares?
→ On the plus side, Musk is now firmly “tied” to the company and highly motivated to achieve extraordinary goals — such as reaching a market capitalisation of $8.5 trillion and launching mass production of Optimus robots.
→ On the downside, the price of this decision could be high. The targets appear almost fantastical, and their achievement would mean dilution of existing shareholders’ stakes through the issuance of new options.
As a result, Tesla’s share price has been fluctuating, reflecting market indecision and consolidating after the news. A closer look at the TSLA chart offers clues as to what may happen next.
Technical Analysis of TSLA
From a bullish perspective, Tesla’s share price remains within an upward-sloping trend channel, where:
→ the median line is showing signs of acting as support;
→ the sharp rally in September formed a demand zone, where an imbalance between buyers and sellers triggered a strong move higher — the upper boundary of this channel, around the psychological $400 mark, could act as a support level going forward.
From a bearish point of view, the key barrier remains the current all-time high, which continues to cap the ongoing rally (roughly +100% from this year’s low).
Given these factors, it is reasonable to assume that TSLA is currently in a consolidation phase. The situation could eventually resolve in favour of the bulls if the price holds the lower boundary of the channel — as seen previously, when a similar consolidation period preceded a breakout above the $360 resistance level.
This article represents the opinion of the Companies operating under the FXOpen brand only. It is not to be construed as an offer, solicitation, or recommendation with respect to products and services provided by the Companies operating under the FXOpen brand, nor is it to be considered financial advice.
tesla is bulish ...Two bullish scenarios are conceivable for Tesla: 1. A return to the broken level and a price pump 2. A move upwards without a return due to the intense buying pressure resulting from hitting the strong demand level.
lets see ....

TESLA BIG SELL PROBABILITY SETUP SOON!!!🚨 TESLA HIGH PROBABILITY SELL SETUP 🚨
* Here We Can See Clearly The Next Potential Moves For TSLA Coming Hours/Days.
* Keep Your Eyes Close On Your Trading Positions.
* Happy PIP Hunting Traders.
FXKILLA.

Tesla / Palantir FRACTAL - When will it endTodays 14% Palantir bounce was followed by Tesla...at the same time...in the same ratio.
Learn to spot patterns.
May the trends be with you.

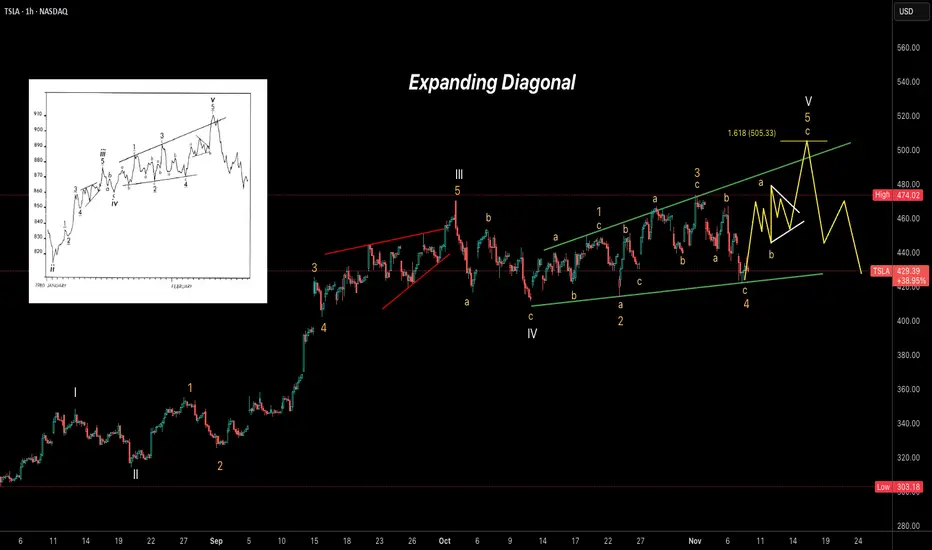
TSLA – Expanding Diagonal in Progress Tesla (TSLA) appears to be forming an Expanding Ending Diagonal pattern on the 1-hour chart, suggesting the final stages of a larger impulsive structure. Wave (V) seems to be unfolding with internal subdivisions visible, possibly targeting the 1.618 Fibonacci extension near 505 before a sharp reversal.
Key observations:
Structure resembles a textbook expanding diagonal (5-3-5-3-5).
Wave 4 found support near the lower trendline.
Wave 5 projection aims toward the 500–505 area.
Expecting a potential pullback or reversal once the diagonal completes.
TSLA 3-Drive & ABCD Pattern – Path to $500 Before a PullbackThis chart highlights multiple harmonic and Elliott structures aligning for a potential bullish extension in Tesla (TSLA). A well-defined ABCD pattern and 3-Drive pattern suggest momentum building toward the $500 zone, supported by Fibonacci projections and channel resistance.
The current wave structure points to an imminent 5-wave advance, likely completing the “Drive 3” and pattern D confluence area near $500–505. Following that move, a corrective pullback (ABC) is anticipated, possibly retesting prior support near $440–400.
Key elements featured:
ABCD completion zone: around $500
3-Drive pattern: confirming exhaustion at upper trendline
Elliott 5-wave projection: short-term bullish continuation
Possible corrective phase: after the final wave up
📈 Watching for confirmation of Wave iii and potential exhaustion signals near $500 before considering downside setups.

TESLA Sellers In Panic! BUY!
My dear subscribers,
My technical analysis for TESLA is below:
The price is coiling around a solid key level - 429.39
Bias - Bullish
Technical Indicators: Pivot Points Low anticipates a potential price reversal.
Super trend shows a clear buy, giving a perfect indicators' convergence.
Goal - 446.44
About Used Indicators:
By the very nature of the supertrend indicator, it offers firm support and resistance levels for traders to enter and exit trades. Additionally, it also provides signals for setting stop losses
Disclosure: I am part of Trade Nation's Influencer program and receive a monthly fee for using their TradingView charts in my analysis.
———————————
WISH YOU ALL LUCK

$TSLA - Reaching $1050 in 2026 is NOT a Dream!I can't ignore how bullish Tesla stocks chart looks right now. A massive ascending triangle with horizontal resistance ($430) was broken upwards and currently the price is consolidating above it, the resistance also perfectly correlates with the 0.786 lvl by Fibo.
Taking into account the overall company's plan regarding its growth (talking about recent news that 75% of shareholders voted in favour of a compensation plan that could award Musk up to $1T in stock if Tesla could achieve $8.5T market capitalization) , we can easily expect NASDAQ:TSLA to reach point 1 by Fibo ($1050 mark) .
By the way, by pointing out to the news about providing $1T, I don't mean that Tesla could really achieve $8.5T market capitalization any time soon, if only in 10 years as the overall money supply is drastically increasing. This news highlights the plan, in other words - creative way of sharing what is their "plan maximum" in terms of 10 years.
I believe Tesla will cost $2T in 2026.

Last Tesla (Macro) chart before ATHATH NEXT!
If I'm wrong, then I have "strict invalidations" with minimal loses...because of "proper risk management".
If I'm right then I'm taking an extended vacation.
May the trends be with you.
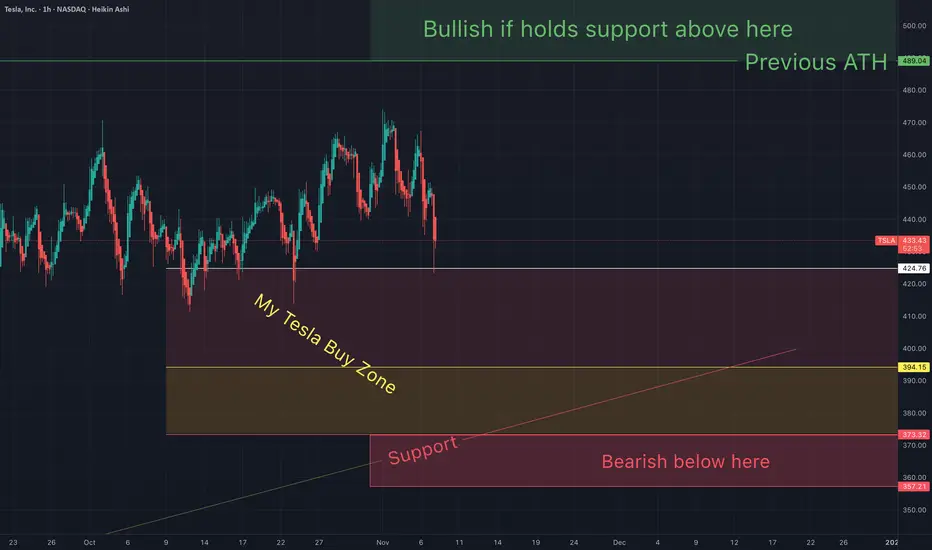
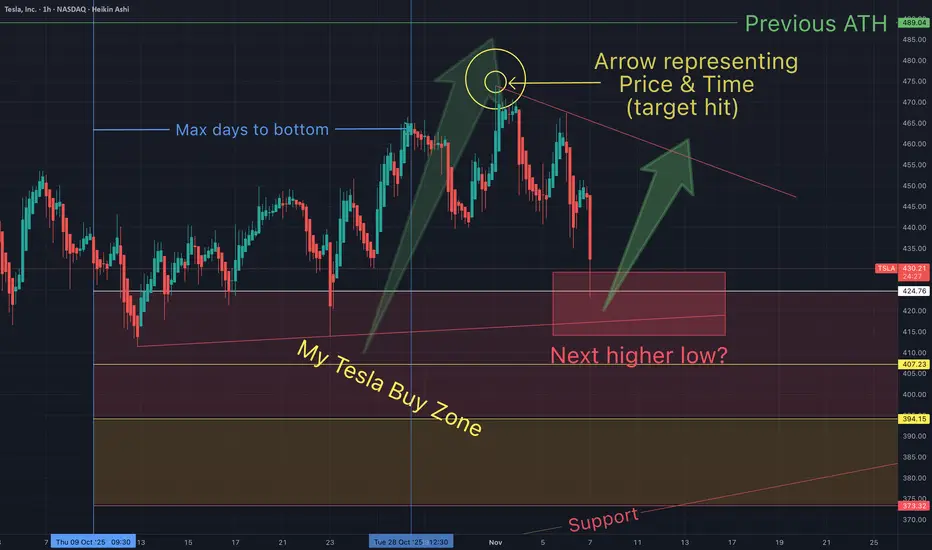
My Last Tesla post before ALL TIME HIGHOn Oct 21st I said I was adding to my positions (price at the time below):
Some of my target hit. We may even go lower.
What do you think?
After 30 Days- Telsa is STill following Palantir fractal
On Oct 7th (30 days ago) I suggested that Tesla and palantir were in a "fractal" pattern.
Oct 7th - macro look
On Oct 27th - I wrote: "Fractals are a mathmatical anomaly, if you understand linear equations (and believe the market is "random"). All assets are doing the same patterns over and over, on all time frames. You just need to see it for what it is.
Oct 28th - "What is a fractal mathmatically?"
All asset charts are graphs, governed by coordinates on an x-axis and y-axis "chart". Where there exist trendlines that price action "respects". These trendlines and ratios are dictated by equations with several variables. If variables were by definition "random", then what would be the chance of 1 fractal appearing in a random assortment of buyers and sellers, in all different time zones (and countries)... all buyin in different amounts...at different times...
*Regardless the fractal seems to remain intact.
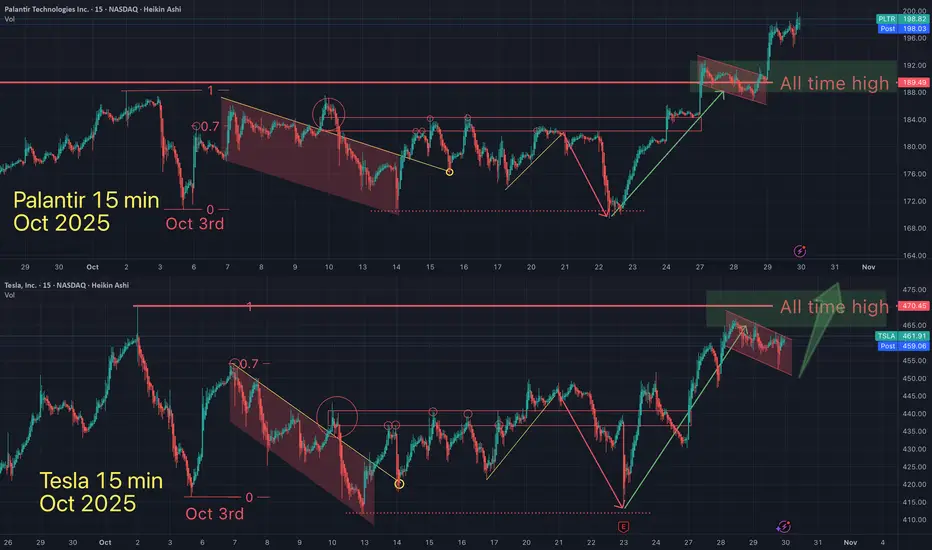
Oct 29th - "On Oct 7th I suggested that Palantir & Tesla were in a very bullish long term pattern and were both about to *soon break out into new all time highs (ATH). Palantir just did...is Tesla next?
Oct 29th - macro look "What do you think? Is Tesla primed for an all time high (soon)...and a blow off top?"
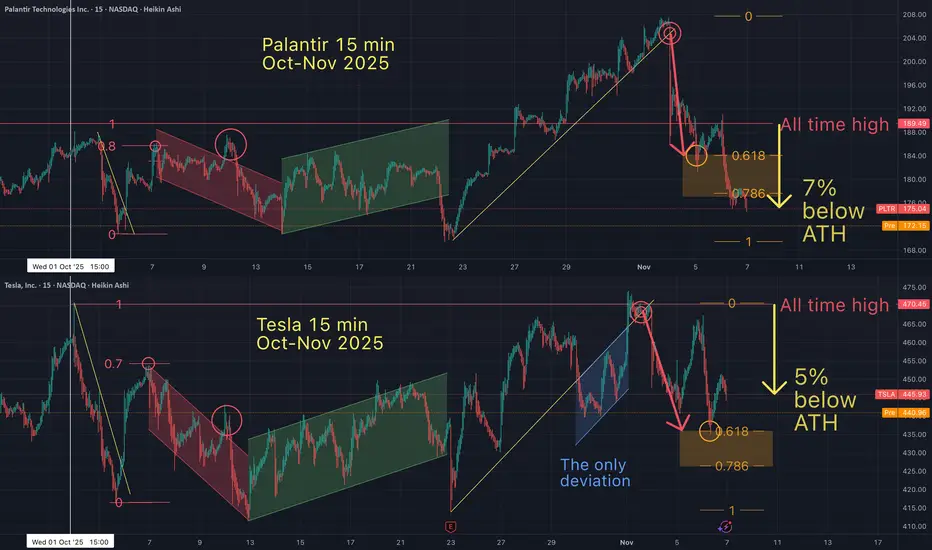
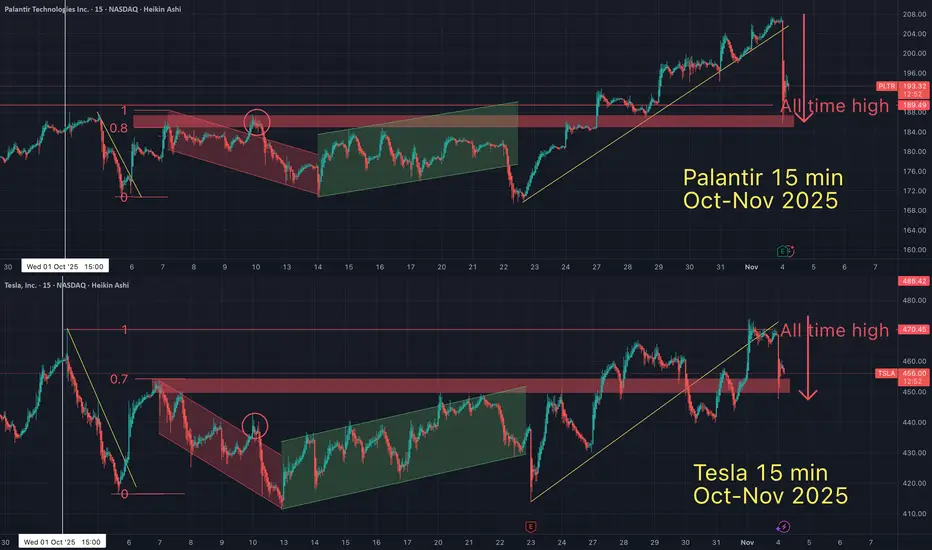
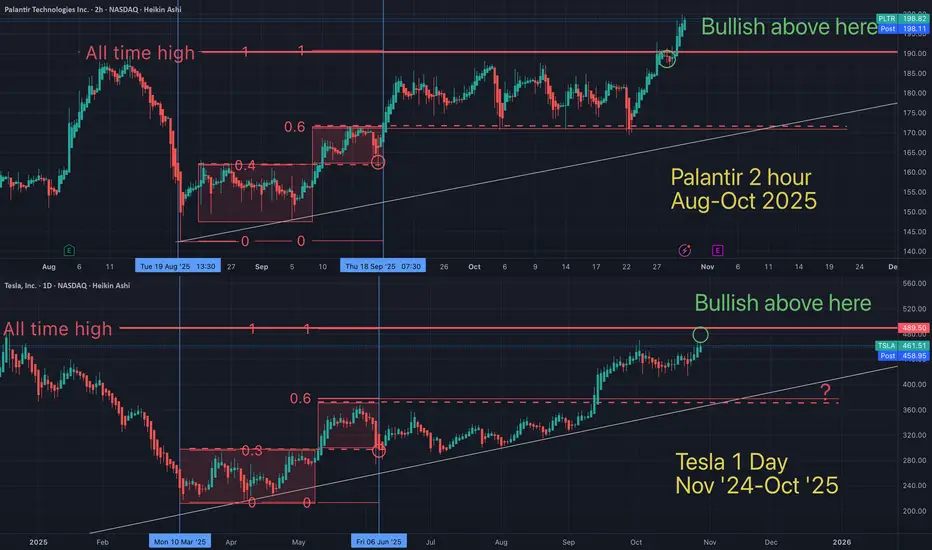
Nov 4th - "On Oct 7th I suggested the Palantir / Tesla "fractal" would lead them both to an all time high. Fast forward to today (1 month later), Palantir has recently hit a new ATH and Tesla is still following the fractal closely. I believe Tesla is days or weeks away from an ATH.
Tesla will move very quickly in 3rd angle fashion, once it breaks ATH & holds support.
If the fractals continues at this pace, how soon do you think Tesla will HOLD SUPPORT above ATH?"
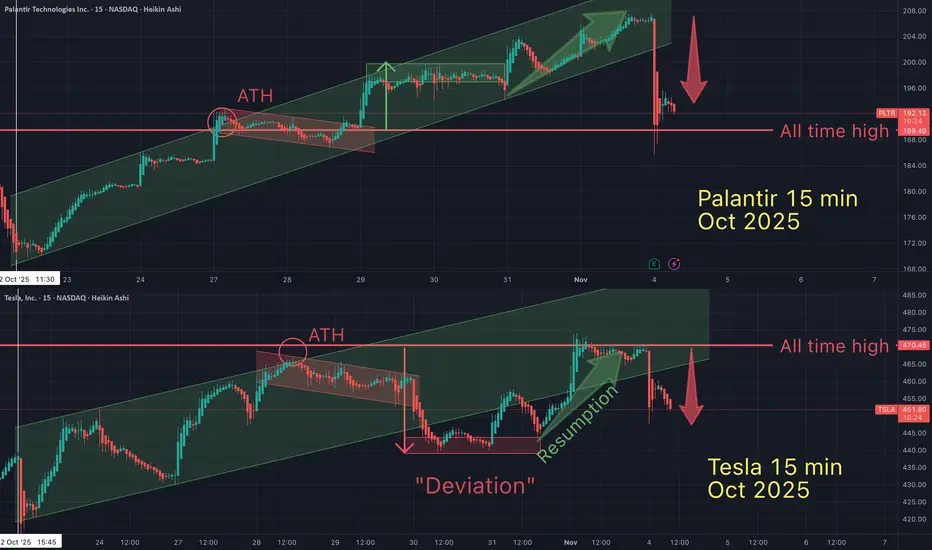
Nov 4th - A different way of looking at this fractal. I wrote "Even when there is a 'deviation' from the pattern, the overall agenda prevails. There's no stoping this moving train. Hopefully you're on board...and know when to get off.
Tesla / Palantir Fractal STILL playing out STRANGELY ACCURATEMillions of people
...buying Trillions of dollars of assets
...at random times
...on random days
but somehow these 2 assets move together on the x-axis & the y-axis??
Cansomeone explain this to me mathematically?
May the Truth be with you.

TESLA PT-2 TRILLION DOLLAR PAY CHECKI hope everything is clear now. I have exited all positions here and I am not going into news.
Elon is not going to tell me where my money is going
NOTE:NOT TRADING TSLA

$TSLA – Breakout Setup Targeting ATHs → $500 ZoneTesla ( NASDAQ:TSLA ) looks ready for liftoff. After months of absorbing negative headlines and post-earnings volatility, it’s finally setting up for a major breakout that could take it back to all-time highs — and possibly the $500 level.
🔹 The Setup:
NASDAQ:TSLA has shaken off every piece of bad news — earnings, delivery headlines, margin fears — all absorbed without breaking trend.
The stock is now coiling under major resistance, and the tape is showing accumulation.
The narrative has flipped from “EV slowdown” to autonomous driving and robotics, giving the stock new life.
🔹 Why This Setup Has Juice:
It’s the last major leader yet to make a big move — the rotation setup is real.
Market sentiment is improving, and NASDAQ:TSLA is showing relative strength.
Volume expansion here could mark the start of the next major leg higher.
🔹 My Trade Plan:
1️⃣ Position: Added $500 calls (2 weeks out) at the open this morning.
2️⃣ Stop: If the stock goes under $450, I’m out — keeping risk tight.
3️⃣ Targets: First stop at ATHs, then a potential run toward $500 if momentum holds.
Why I Love This Chart:
The structure is perfect — long base, trendline reclaim, sector rotation lining up.
NASDAQ:TSLA has flipped from “bad news reaction” to “no sell reaction,” a clear sentiment shift.
Risk/reward is ideal here with a tight stop and clear upside roadmap.
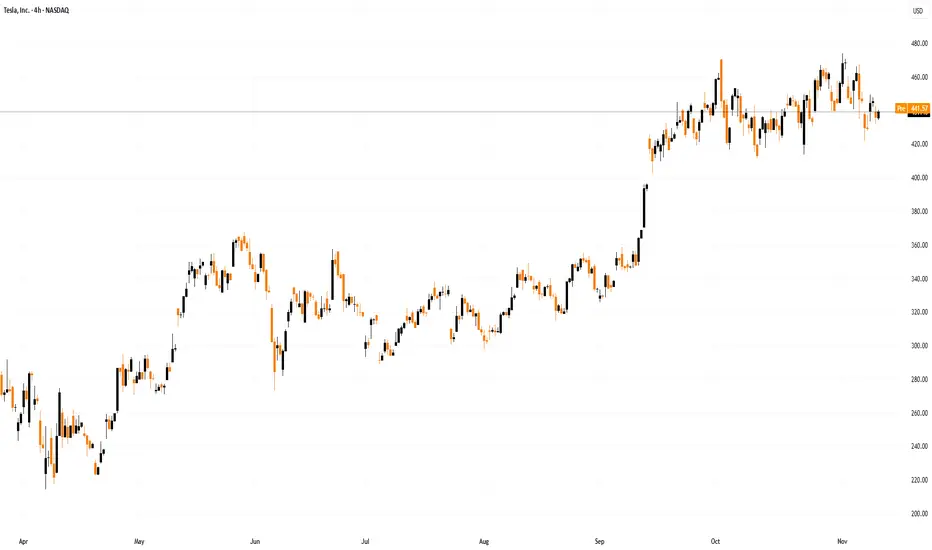
Tesla Inc. (Nasdaq: $TSLA) Eyes Breakout Above $490Tesla Inc. (Nasdaq: NASDAQ:TSLA ) is approaching a critical technical juncture as price action consolidates near the upper end of its ascending trendline. After rebounding strongly from the $180–$200 demand zone earlier this year, Tesla has maintained a steady uptrend, forming higher lows and higher highs — a classic bullish structure.
Currently trading near $440, Tesla has encountered resistance below the $490–$492 zone, which marks the previous swing high. The chart shows a clear ascending support line extending from the April low, reinforcing the overall bullish sentiment. As long as the stock holds above $420, bulls remain in control. A confirmed breakout above $492 could ignite the next leg higher, targeting the $520–$540 region in the medium term.
Volume analysis shows healthy participation during recent rallies, while the RSI hovering around 50 suggests moderate strength without signs of overbought conditions. This balance indicates potential for further upside before exhaustion sets in.
The projected path shown on the chart outlines a short-term pullback toward support, followed by a continuation rally through resistance. Such a move would confirm bullish momentum and possibly trigger a new wave of investor confidence as Tesla heads into the next earnings season.
However, if Tesla fails to maintain the ascending trendline, a dip below $410 could expose the stock to deeper retracement toward $380, testing previous breakout levels.
Overall, Tesla’s structure remains technically constructive. The uptrend is intact, supported by volume and strong higher-lows formation. Traders are closely watching for a decisive breakout above $492, which could mark the beginning of a fresh rally phase as market sentiment leans bullish on tech and EV momentum.

Tesla / Palantir "fractal" - Why do fractals exist?Even when there is a "deviation" from the pattern, the overall agenda prevails. There's no stoping this moving train. Hopefully you're on board...and know when to get off.
May the trends be with you.
FRACTALS are like maps. This one is STILL working.On Oct 7th I suggested the Palantir / Tesla "fractal" would lead them both to an all time high. Fast forward to today (1 month later), Palantir has recently hit a new ATH and Tesla is still following the fractal closely. I believe Tesla is days or weeks away from an ATH.
Here was the 15min chart at that time:
Tesla will move very quickly in 3rd angle fashion, once it breaks ATH & holds support.
If the fractals continues at this pace, how soon do you think Tesla will HOLD SUPPORT above ATH?
TSLA, consolidation below ATH often leads to a breakout..Tesla sentiment was very negative in April as Trump and Elon argued online causing a lot of whipsaw volatility and scaring out investors. The bottom quickly followed.
Price is ranging below all time high. Price is above the weekly pivot and 200EMA which is bullish and has momentum.
Wave © of C appears to be underway into price discovery with a target of $693 the R2 weekly pivot. This is because it has been printing a series of 3 wave structures. Wave B printed a triangle which is a pattern found before a terminal move reinforcing the Elliot wave count.
🎯 Terminal target for the business cycle could see prices as high as $690 based on weekly pivots
📈 Weekly RSI is just below oversold with no divergence and can remain here for months as price keeps increasing.
👉 Analysis is invalidated if we close back below wave (B), $280

TSLL accumulation before impulse, growth targets at 31 and 50TSLL continues to move within an ascending channel, forming a price accumulation zone between 17 and 21. After a confirmed breakout above 21, the price is expected to rise towards Target 1: 31.03 and
Target 2 : 49.78.
The 50 and 100 EMA are sloping upward, confirming a strong bullish structure. A short-term correction toward 17.17 remains possible this area acts as key buyer interest and previous support.
TSLL performance is tied to Tesla’s stock. Recent quarterly results from Tesla show margin recovery and revenue growth driven by new model sales. Lower interest rate expectations and renewed appetite for U.S. equities support inflows into leveraged ETFs like TSLL.
TSLL remains in a bullish structure. As long as the price stays above 17, buying remains preferable. Medium-term targets 31 and 50. Pullbacks toward 17 can be used to add to long positions.

TSLA Bullish Breakout? Flag Resolution Toward 525–530Hello, traders. TSLA’s 1D chart has been trending higher since the early-September breakout, then cooling into a neat bull flag. Price is holding above the MA20, MA60, and MA120, with the MA20 around ~$440 acting as first dynamic support. Volume expanded on the run-up and faded during the flag—classic continuation behavior—while volatility has eased but remains elevated.
The key battleground is the resistance at $481, the early-October peak and upper boundary of the flag. A daily close above $482 would confirm the breakout and put the psychological $500 on the table, with extension toward the $525–$530 supply zone if momentum and volume expand. If buyers don’t force the break immediately, a dip toward the $430–$440 area (near MA20) is a constructive retest zone before another attempt at the highs.
The idea fails on a decisive daily close below $415. That would break the flag support, flip the short-term structure, and expose downside toward the MA60 region near $390. Until then, the primary path favors continuation: breakout entries on a daily close >$482, with partial profits near $500 and runners into $525–$530; conservative stops live below $415–$417 depending on tolerance.
This is a study, not financial advice. Manage risk and invalidations.

A broader look at the Palantir / Tesla Fractal (Tesla ATH Next?)What do you think? Is Tesla primed for an all time high (soon)...and a blow off top?
May the trends be with you
You will ask yourself, "how did he know Palantir would do that"?On Oct 7th I suggested that Palantir & Tesla were in a very bullish long term pattern and were both about to *soon break out into new all time highs (ATH). Palantir just did...is Tesla next?
Blow off top next?
May the trends be with you.