TSLA - Important!🔥 Tesla Analysis (Daily Structure) 🔥
Alright, let’s break this one down 👇
🧱 Structure Overview
Tesla’s price is currently hovering around $452, sitting right below a major resistance zone between $455 – $470 (highlighted in orange). This area has acted as a strong ceiling multiple times — every approach has been met with rejection pressure.
Below, the support floor sits clean around $420 – $425, which has been holding the range low for a while. We’re essentially trapped in a sideways consolidation box — a range between that $420 low and the $470 resistance cap.
🧭 Bias
Current structure = Neutral to Bearish
Price just wicked into resistance, showing signs of rejection. Unless we see strong follow-through above $470 with clean volume, this is likely a reaction zone for shorts.
💡 Key Zones
Resistance (Sell Zone): $455 – $470
Strong supply — expect sellers to defend this area.
Support (Buy Zone): $420 – $425
Range demand base — liquidity resting below.
🎯 Scenarios
Bearish Setup (Higher Probability for Now)
If Tesla fails to break and close above $470, look for a move back down to $420 — possibly a liquidity grab under the range. Confirmation would be bearish engulfing or a strong rejection candle from resistance.
Bullish Setup (Breakout Play)
If price cleanly closes above $470 and retests it as support, we could open the door toward $500 (measured move target). That’d be a breakout from the range and continuation of the larger bullish channel.
⚖️ Risk Management
Bears: Stop above $475 – $480
Bulls: Stop below $445 if entering after breakout retest
Keep R:R ≥ 1:2
🧠 Summary
Tesla’s in a tight range — smart money likely accumulating or distributing near these highs. Watch for rejection signs around $470 for short plays, or confirmation above it for the next leg to $500.
This is the make-or-break zone — the next move will define Tesla’s mid-term direction. ⚡️
Tesla
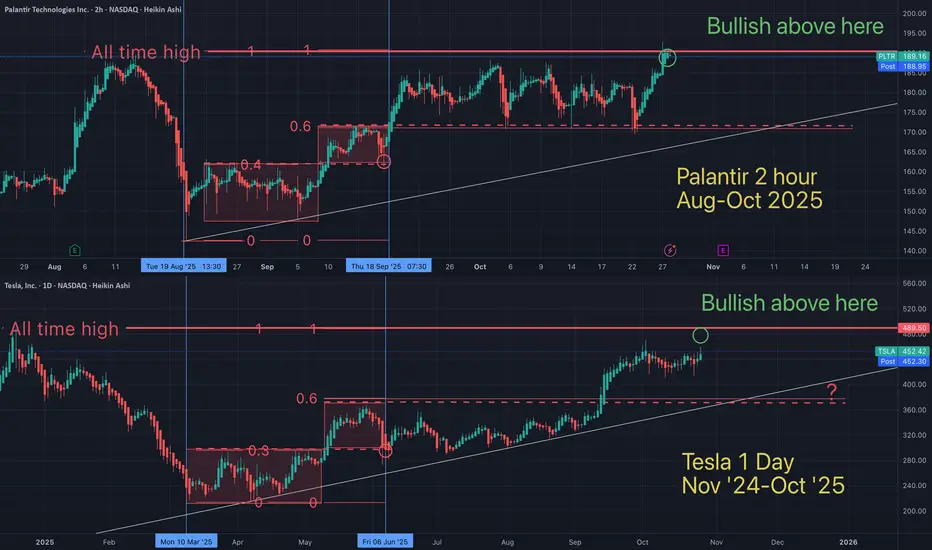
Tesla / Palantir fractal showing both will hit ATH soonFractals are a mathmatical anomaly, if you understand linear equations (and believe the market is "random"). All assets are doing the same patterns over and over, on all time frames. You just need to see it for what it is.
May the trends be with you.
TESLA On The Rise! BUY!
My dear followers,
This is my opinion on the TESLA next move:
The asset is approaching an important pivot point 433.50
Bias - Bullish
Safe Stop Loss - 429.07
Technical Indicators: Supper Trend generates a clear long signal while Pivot Point HL is currently determining the overall Bullish trend of the market.
Goal -440.74
About Used Indicators:
For more efficient signals, super-trend is used in combination with other indicators like Pivot Points.
Disclosure: I am part of Trade Nation's Influencer program and receive a monthly fee for using their TradingView charts in my analysis.
———————————
WISH YOU ALL LUCK

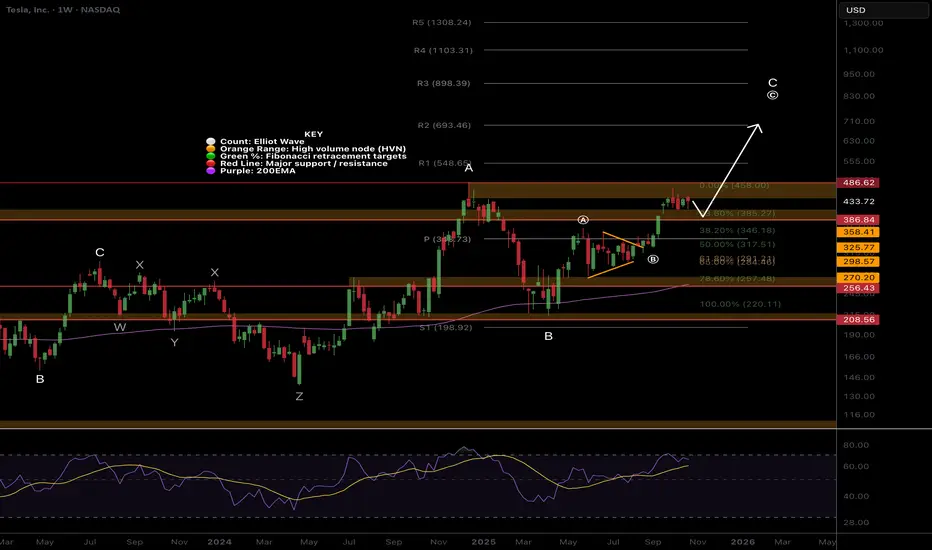
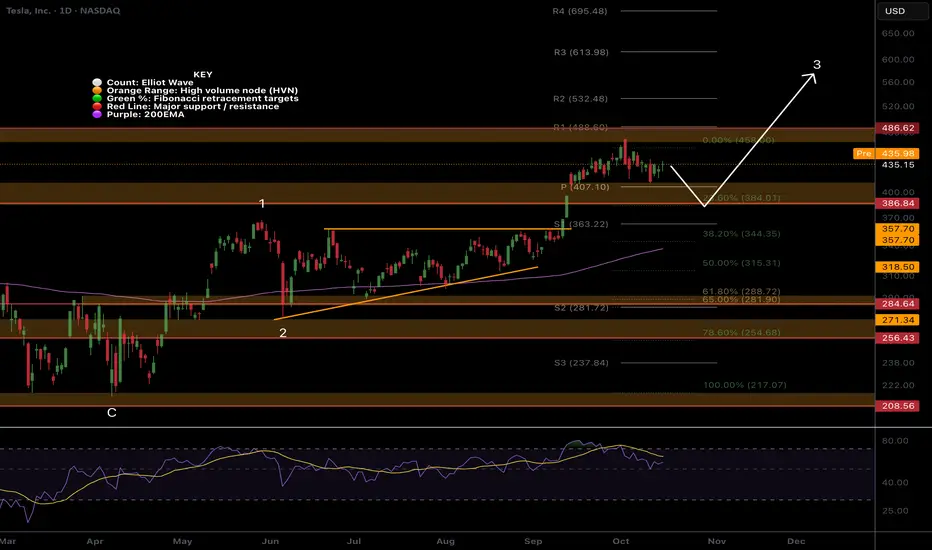
$TSLA higher to go!Price continues towards price discovery finding resistance at the previous all time High Volume Node. Price is above the weekly pivot and 200EMA which is bullish and has momentum.
Wave © of C appears to be underway into price discovery with a target of $693 the R2 weekly pivot. This is because it has been printing a series of 3 wave structures. Wave B printed a triangle which is a pattern found before a terminal move reinforcing the Elliot wave count.
RSI is not yet overbought.
Safe trading
Tesla Stock Wobbles as Profit Dives 37%, Revenue Pops. Now What?Tesla NASDAQ:TSLA posted a 12% jump in revenue on Wednesday, reaching $28.1 billion, well above Wall Street’s $26.37 billion estimate. And yet, the stock slipped nearly 1% on the day before paring back that loss with a 2.3% Thursday gain.
Why? Because profits fell faster than Cybertruck’s reputation — a 37% plunge year over year, with adjusted earnings per share at 50 cents versus the expected 54 cents.
It’s a classic Tesla paradox: sales are booming, but margins are thinning, and Wall Street can’t decide whether to cheer the top line or cry over the bottom one.
🏎️ The Cost of Staying in the Fast Lane
Tesla’s secret sauce has always been scale — crank out more cars, dominate market share, and let profits follow. But this quarter, the recipe’s a bit off. Automotive revenue rose 6% to $21.2 billion, yet net income plunged to $1.37 billion from $2.17 billion a year earlier .
What happened? Price cuts. Lots of them. Musk has been slashing sticker prices across markets to stay ahead in the EV race — great for consumers, painful for margins. Add a 50% spike in operating expenses (thanks, humanoid robots and AI labs), and suddenly that sleek electric machine looks a lot less money-making.
Still, Tesla’s revenue growth means one thing: demand isn’t dead. The EV slowdown hasn’t reached Palo Alto yet.
💰 Bitcoin Bounces
In a crypto-centric subplot, the company made $62 million from its Bitcoin BITSTAMP:BTCUSD stash last quarter.
The crypto’s 5% rise — ending the quarter around $114,000 — gave Tesla’s treasury a nice digital cushion. The company held roughly 11,000 Bitcoins during the three months through September.
🧠 The $1 Trillion Question
And then there’s the other storyline — the Elon Musk Show. Musk wrapped up the earnings call by pivoting from profits to power. Specifically, his proposed $1 trillion pay package , which he insists isn’t “compensation” at all but a question of “control.”
“I just don’t feel comfortable building a robot army here and then being ousted because of some asinine recommendations from ISS and Glass Lewis,” Musk quipped, slamming the proxy firms as “corporate terrorists.”
His plan is to secure roughly mid-20s voting power to keep Tesla’s destiny firmly in his hands while still, as he puts it, being “fireable if I go insane.”
If approved, Musk’s stake could surge from 13% to nearly 29%, giving him the leverage he says he needs to push Tesla toward an $8.5 trillion valuation — complete with robotaxis, humanoid bots, and up to 12 million cars sold annually.
🧾 The Takeaway
The stock is up roughly 16% in 2025, clawing back some early-year losses, but it still lags the Nasdaq Composite NASDAQ:IXIC and other mega-cap peers like Nvidia NASDAQ:NVDA and Meta $META.
The near-term question is simple: can Tesla tighten costs without killing growth? The long-term one is bigger: can Elon Musk lead the company into its next chapter without turning every quarter into a cliffhanger?
That said, the earnings season continues and the next batch of big tech heavyweights is right around the corner.
Off to you : What’s your take on Tesla and Musk’s lofty vision north of $1 trillion? Share your thoughts in the comments!

Tesla - The massive triangle breakout!🪩Tesla ( NASDAQ:TSLA ) is breaking out:
🔎Analysis summary:
Last month, we witnessed an incredible but expected rally of about +35% on Tesla. Furthermore, with this move Tesla is attempting to break above the previous all time highs. After bullish confirmation, this would also lead to a massive triangle breakout.
📝Levels to watch:
$400
SwingTraderPhil
SwingTrading.Simplified. | Investing.Simplified. | #LONGTERMVISION

October’s top stock performers: #AMD, #Amazon, #Tesla & moreIn October, FreshForex clients most frequently traded stocks like #AMD, #Amazon, #GoDaddy, #Tesla, and #Moderna — and these very assets showed the highest share of profitable trades. Capitalize on strong demand momentum and high liquidity: with earnings season and the holiday rush ahead, the “window of opportunity” is still open.
Outlook through the end of 2025:
#AMD: Shares could rise following the $6B AI compute deal with OpenAI and Oracle’s reported order of 50,000 next-gen MI450 chips.
#Amazon: Strong earnings on October 30, solid AWS growth, advertising contributions, and the fall Prime Big Deal Days may keep the stock bullish.
#GoDaddy: Stock may face pressure if SMB ARPU/inflows slow, plus FX headwinds could dampen August’s raised full-year guidance.
#Tesla: Growth potential supported by record 497K deliveries, 12.5 GWh energy deployments in Q3, and expansion of FSD v14 (Supervised).
#Moderna: Stock remains under pressure amid limited revenue visibility, delayed UK shipments, and postponed approval of its flu+COVID combo vaccine to 2026.
According to FreshForex analysts, the outlook for these stocks remains driven by AI investments and seasonal demand. But the strongest growth impulse is likely in Q1 2026, especially if the Fed eases policy and announced tech projects go live.

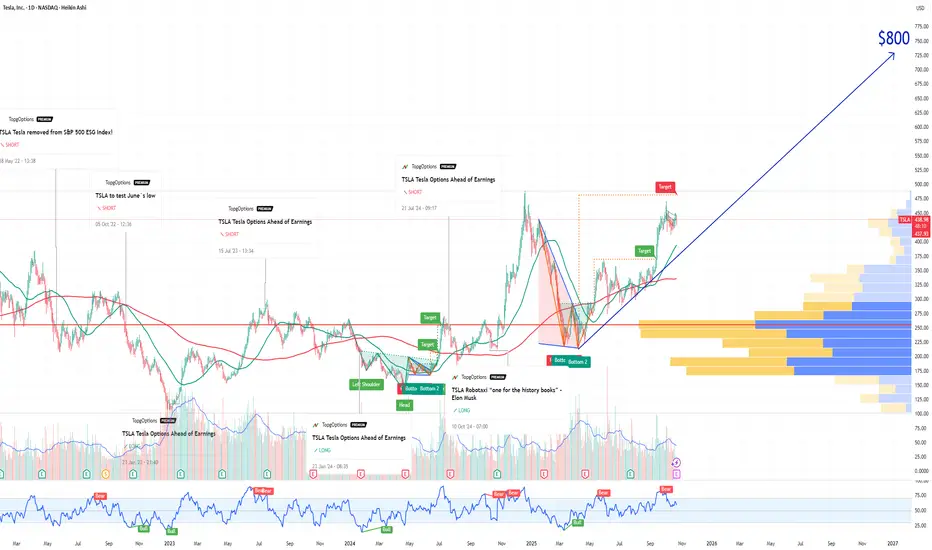
TSLA Tesla Options Ahead of EarningsIf you haven`t bought the dip on TSLA:
Now analyzing the options chain and the chart patterns of TSLA Tesla prior to the earnings report this week,
I would consider purchasing the 800usd strike price Calls with
an expiration date of 2027-1-15,
for a premium of approximately $40.30.
If these options prove to be profitable prior to the earnings release, I would sell at least half of them.
TESLA New Bullish Leg to $600 has started.Last time we took a look at Tesla (TSLA) more than a month ago (September 11, see chart below), we gave a massive buy signal that worked out instantly, as we saw the resemblances between the recent Triangle accumulation pattern and that of late 2024, setting a $600 long-term Target:
This time we take a better look at the Channel Up that has emerged. Technically it looks like a Bearish Leg (red Channel Down) has ended and with the 1D MA50 (blue trend-line) holding, a new Bullish Leg has been initiated.
The previous Bullish Leg, which by the way started after a 1D MA100 (green trend-line) hold, rose by +59.26%. This puts the next Higher High technically above our $600 long-term Target.
Notice also how the 1D MACD is about to form a new Bullish Cross, with all previous ones being a strong Buy Signal. At the same time, the 1D RSI found support and bounced on its 5-month Higher Lows trend-line.
-------------------------------------------------------------------------------
** Please LIKE 👍, FOLLOW ✅, SHARE 🙌 and COMMENT ✍ if you enjoy this idea! Also share your ideas and charts in the comments section below! This is best way to keep it relevant, support us, keep the content here free and allow the idea to reach as many people as possible. **
-------------------------------------------------------------------------------
💸💸💸💸💸💸
👇 👇 👇 👇 👇 👇


TSLA – Sideways Accumulation Phase Ahead of Major NewsTesla’s stock is currently showing a stable sideways movement around the 430–445 USD range as the market awaits the company’s Q3 earnings report (on October 22).
Recent news reflects cautious investor sentiment , especially after ISS recommended rejecting Elon Musk’s massive compensation package and amid forecasts suggesting a slight decline in Q3 profits.
On the 4-hour chart, TSLA continues to maintain a medium-term uptrend, with prices oscillating around the EMA34 and EMA89, which act as equilibrium zones.
The 432 USD area remains the main support, while 493 USD stands as a key resistance level.
The chart indicates a high likelihood that the price will continue sideways within this range until the market reacts more clearly after the earnings release.
Summary
Currently, TSLA is in an accumulation phase , reflecting a tug-of-war between expectations of increased production and concerns over profit margin pressures.
In the short term, the trend is expected to remain sideways with a slight bullish bias, awaiting a potential breakout driven by the upcoming earnings announcement.

Volatility Period: Around October 22nd (October 21st-23rd)
Hello, traders!
If you "Follow" us, you'll always get the latest information quickly.
Have a great day.
-------------------------------------
(TSLA 1M Chart)
The key is whether the price can rise above the target level of 488.54 by following the rising channel.
If the price fails to rise, we should check for support near 381.59.
-
(1W Chart)
The rising trend line (1) has formed, forming an ascending channel.
Therefore, the key is whether the price can maintain above the rising trend line (2) and rise along the rising channel.
The HA-High ~ DOM(60) range on the 1W chart is formed in the 382.40-421.06 range. If the price remains above this range, a stepwise uptrend is expected to continue.
-
(1D chart)
The key question is whether the price can continue its upward trend toward 488.54 after passing through this volatile period around October 22nd (October 21st-23rd).
To do so, we need to see if it can find support and rise around 439.60-442.79.
-
Thank you for reading to the end.
I wish you successful trading.
--------------------------------------------------

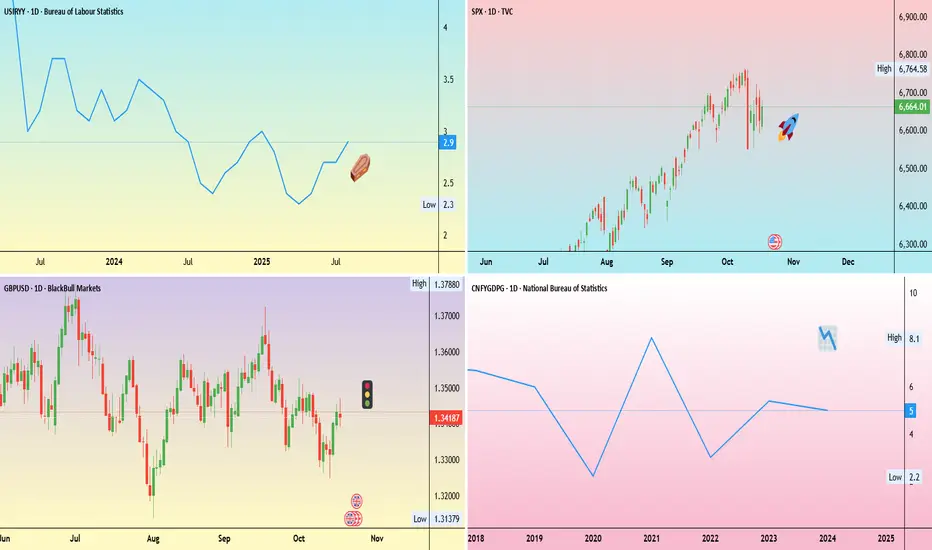
Weekly Trading Opportunities | October 21–25 • Monday: China GDP data
China’s third-quarter GDP report will be closely watched as growth is expected to slow to 4.8% year-on-year from 5.2% in Q2.
Slowing growth in China could reduce demand and prices for commodities. A surprise upside could support commodity prices.
• Tuesday: Coca-Cola and Netflix earnings.
Earnings season continues with Coca-Cola, Netflix, and others including Tesla, IBM, and Intel.
Strong results could offset soft U.S. data and help reignite the risk-on environment.
• Wednesday: U.K. inflation data and Tesla earnings
U.K. inflation is expected to edge back toward 4%. A softer reading could boost U.K. equities and pressure the pound.
• Thursday: Intel earnings
• Friday: U.S. CPI report
With the U.S. government shutdown entering its fourth week, the CPI release remains the week’s key data point. A hotter print could lift the dollar.
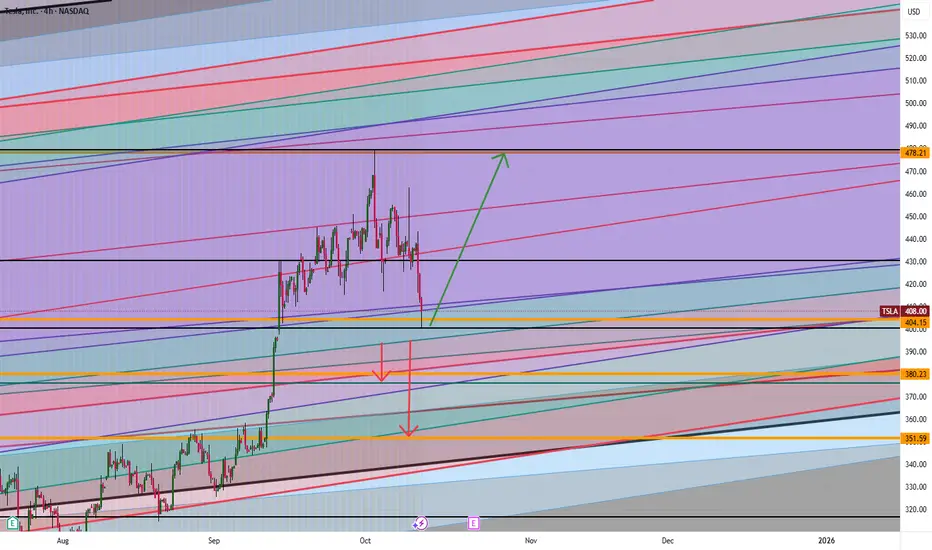
Tesla: Will It Blast Off or Fall Fast? The $404 Level Is the KeyTesla is at a big “make or break” point. If the price stays higher than $404, it could blast up to $437 or maybe even $478. But if Tesla drops below $404, watch out! It could fall down to $380 or even as low as $351.
Think about it:
What would you do if Tesla started moving toward those numbers? Do you think it will go up or will it go down?
If you’re not sure or have a question, send me a message! Sometimes asking one good question can help you make a smarter trade. What do you want to know about Tesla right now?
Mindbloome Exchange
Tesla reports Wednesday; analysts expect EPS of $0.55Tesla reports third-quarter earnings Wednesday after the close, with analysts expecting EPS of $0.55, down from $0.72 a year earlier, on revenue of $26.2B — up 4%. There’s room for an upside surprise after record Q3 deliveries of 497,099 vehicles, boosted by the now-expired $7,500 U.S. EV tax credit, which also trimmed inventories. Analysts will focus on Elon Musk’s plans for robotaxi scaling, autonomy progress, and upcoming models through 2026, along with updates on new “Standard” Model 3 and Y trims. Wall Street projects about 450,000 deliveries in Q4.
Tesla is holding firm near $418, with its RSI turning higher to signal improving momentum. A positive EMA crossover — along with clear angle and separation between the averages — would confirm a strengthening bullish trend.

TSLA looks ready for higher in wave 3NASDAQ:TSLA found resistance at the all time High Volume Node and is trapped between that and the high volume support node.
The trend is up and strong. above the daily pivot and daily 200EMA with width.
I expect price to find support and continue into price discovery.
Safe trading
What is LiDAR: Can you profit from this theme? LiDAR stands for Light Detection and Ranging (or Laser Imaging Detection and Ranging). It's a remote sensing technology that uses laser light to measure distances and create highly detailed, three-dimensional information about the shape and surface characteristics of the Earth or objects.
some of the companies I'm watching in the space:
OUST
LAZR
INVZ
LIDR
AEVA
MBLY
Most of these companies are not profitable so keep that in mind for risk management.

TESLA My Opinion! BUY!
My dear friends,
Please, find my technical outlook for TESLA below:
The instrument tests an important psychological level 413.27
Bias - Bullish
Technical Indicators: Supper Trend gives a precise Bullish signal, while Pivot Point HL predicts price changes and potential reversals in the market.
Target - 428.09
Recommended Stop Loss - 405.57
About Used Indicators:
Super-trend indicator is more useful in trending markets where there are clear uptrends and downtrends in price.
Disclosure: I am part of Trade Nation's Influencer program and receive a monthly fee for using their TradingView charts in my analysis.
———————————
WISH YOU ALL LUCK

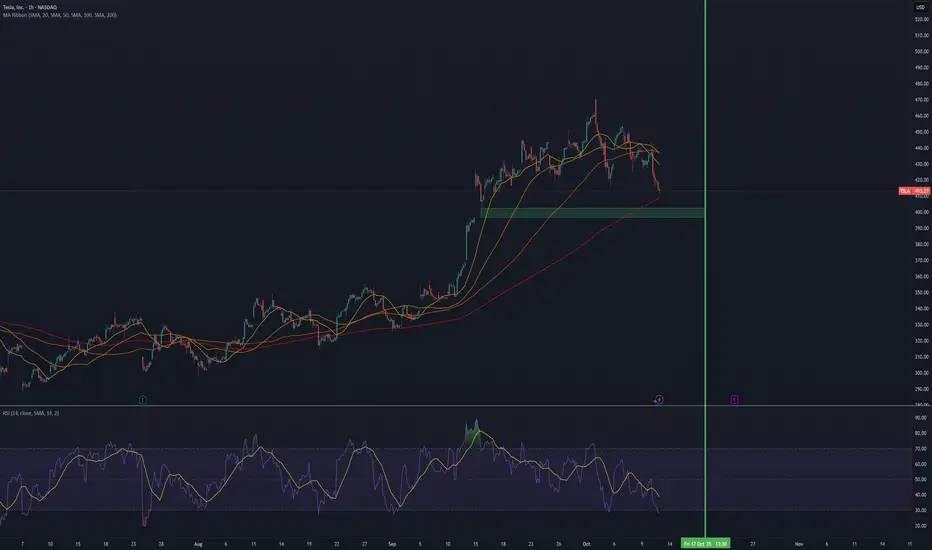
TSLA Week Ahead - ShortTSLA looks like a classic post-rally consolidation after that sharp pop from late September lows around $340. The candlesticks show solid volume on the upside thrusts (those red-to-green hammers mid-September), but we're seeing some profit-taking wicks lately, with the price hugging that rising EMA channel (orange line) around $410 support. That unfilled gap down at $396-$402 (from early October open?) is screaming "magnet" if we get any broader market weakness—gaps like that on high-beta names like TSLA often fill on light-volume Fridays, especially with no major catalysts this week.
The gap is likely to close 70% of the times in 30 day span.
What to Expect by EOD Friday (Oct 17)
No earnings till Oct 22, so this week's all about macro vibes (Fed chatter, CPI print Wed) and TSLA-specific noise like Robotaxi buzz or delivery whispers. Q3 deliveries hit 462k on Oct 2 (beat estimates), so that's baked in—focus shifts to affordable model teases.
Base Case (60% odds): Sideways grind to $415-425. We're in that expected move band of ±6% (~$388-438 from here). Light volume mid-week could keep us coiling in the channel; that gap stays open unless we dump on risk-off. Analysts are meh short-term (avg target $361, but that's 1Y noise), but one shop just hiked to $483. I'd fade any spike above $420 for a quick scalp—RSI's overbought on 1H.
Bull Case (25% odds): Push to $430+. X crowd's frothing—folks calling ATH break by 10/17 on "unstoppable momentum" and 5Y consolidation snap to $500. If CPI undershoots and Elon tweets FSD gold, we tag resistance. One forecast pegs exactly $425 EOW.
Bear Case (15% odds): Gap fill to $400. Volatility spikes if yields rip higher or China EV FUD hits (ZEV credit chatter ending soon). That purple MACD histogram's flattening—watch for divergence.
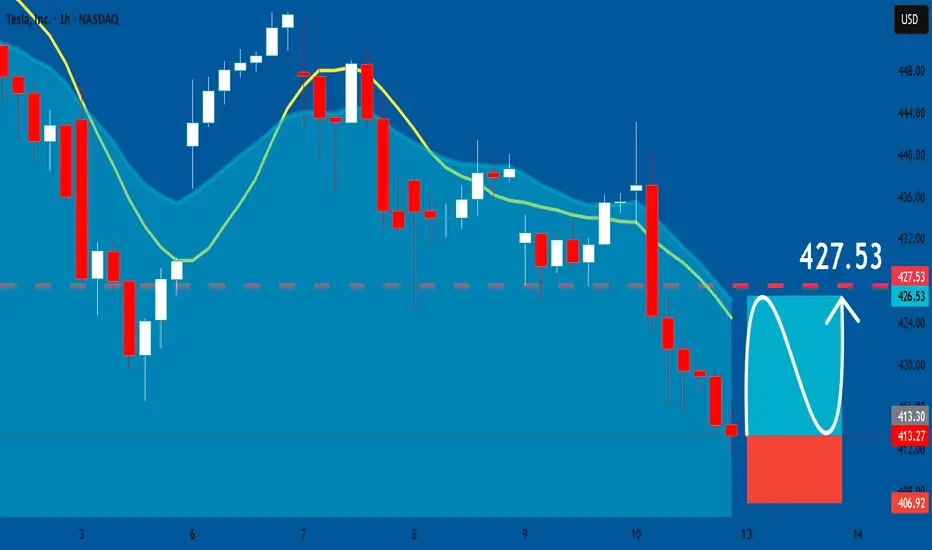
TESLA: Long Signal Explained
TESLA
- Classic bullish formation
- Our team expects pullback
SUGGESTED TRADE:
Swing Trade
Long TESLA
Entry - 413.27
Sl - 406.92
Tp - 427.53
Our Risk - 1%
Start protection of your profits from lower levels
Disclosure: I am part of Trade Nation's Influencer program and receive a monthly fee for using their TradingView charts in my analysis.
❤️ Please, support our work with like & comment! ❤️
13, here we comeLooks bullish and can hit 13. It may have massive pullbacks before it hits 13. Play safe and diversify.
Not a financial advise.

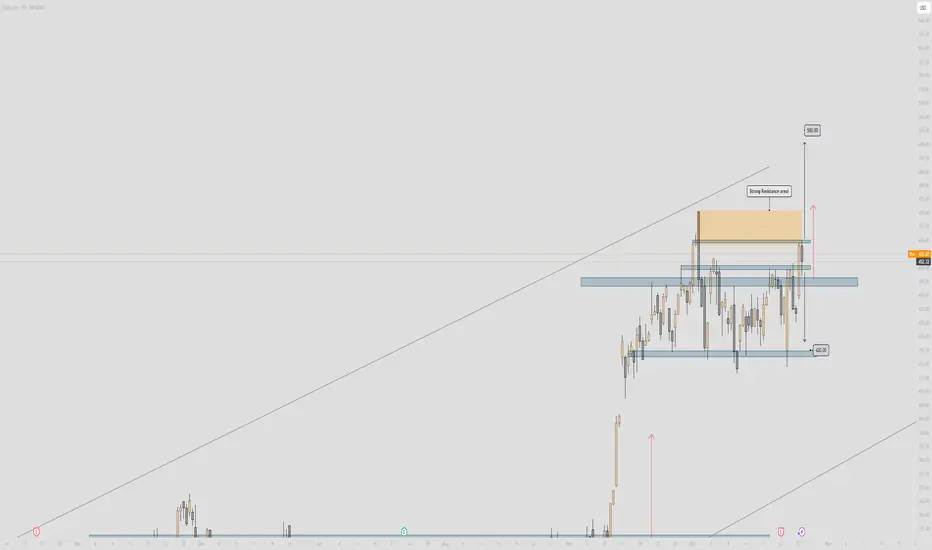
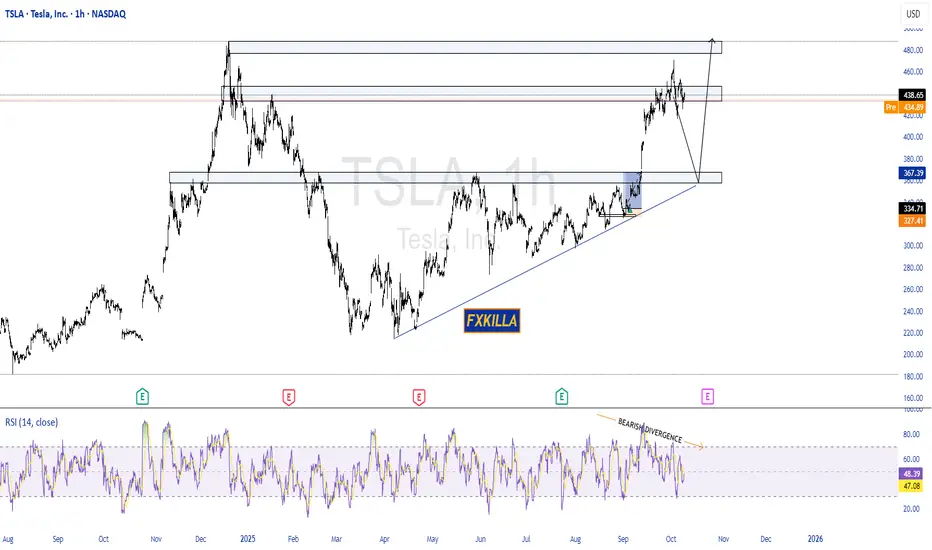
TESLA HIGH PROBABILITY SETUPS SOON!!!🚨 TESLA HIGH PROBABILITY SELL/BUY SETUPS 🚨
* Here We Can See Clearly The Next Potential Move For TSLA Coming Hours/Days.
* Keep Your Eyes Close On Your Trading Positions.
* Happy PIP Hunting Traders.
FXKILLA.
TESLA 190 MERRY CHRISTMAS !!!PIVOT BACK TO 190 CHISTMAS RALLY !!!
PIVOT AND ANLYSIS
Merry christmas to al !!!
stay profitable !!!!
