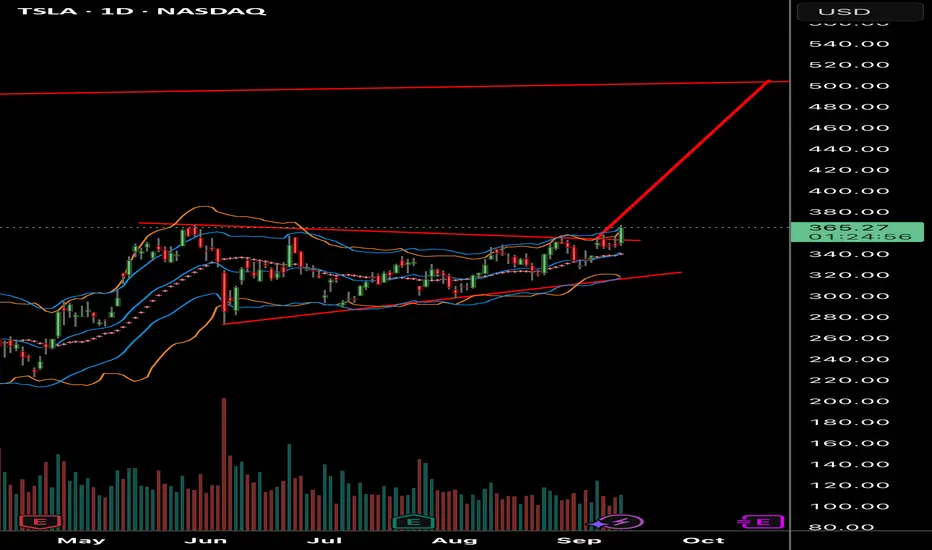
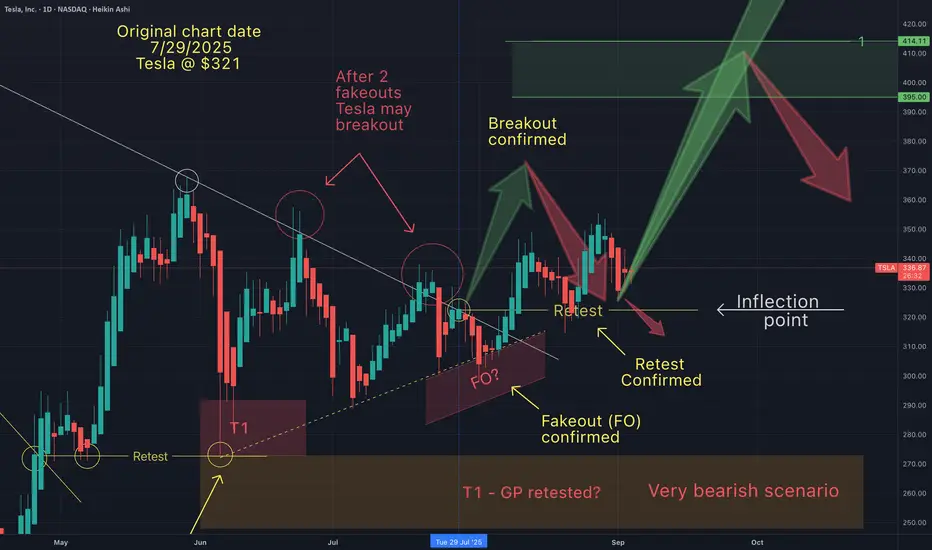
You will ask yourself, "how did he know Tesla would do that"?I wrote this on my July 29th chart description (below):
"Price action really has less to do with the news making Elon a hero, then a villain and then back and forth...but moreso to do with price action patterns that just keep repeating". Since then, the pattern has played out exactly as anticipated, and my 1st take profit target just hit (+22%).
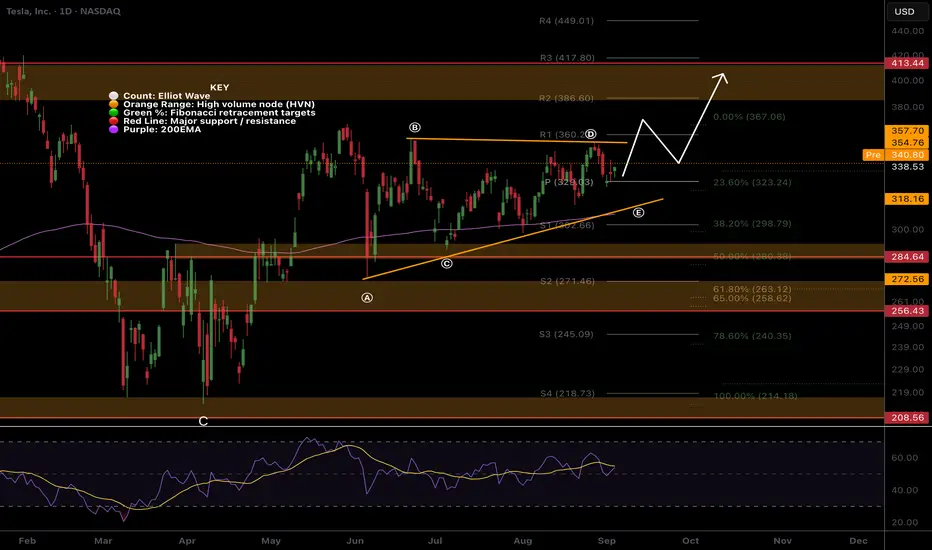
July 29th chart:
Now the question remains, will Telsa hit my next target range (T2). Although it is a much larger range than my T1, I will monitor price action closely and use TA to get out near the top before the next major retracement.
Let me know if you're into Tesla and if you are interested in me charting the top of this run.
May the trends be with you.
Tesla

Tesla Breakout? For the majority of the calendar year TESLA has been in a range between $220 - $365 with a clear midpoint of $295.
From March to the beginning of May TESLA bounced between range low and the midpoint until finally breaking through into the upper half of the range where it has stayed ever since. However, there is a clear diagonal resistance level that is preventing higher highs.
So will TESLA breakout, or will it lose the midpoint? Structurally it is clear that the bulls have a set level they are happy to buy at (Midpoint) but the bears are getting more aggressive with their selling, hence the lower highs. This compression inevitably leads to an impulse move but the direction is not so clear.
Bullish scenario: A clean breakout with volume that makes a new higher high, signaling a shift in structure. A pullback and retest of the breakout would be an ideal opportunity to go long and aim for that range high before expecting resistance.
Bearish scenario: The lower highs keep printing until the midpoint is lost and price accepts below it, that would then signify to me the new trading range is between Range Low and Midpoint.
The fakeout scenario is a risk but with price so close to the midpoint already it follows the same invalidation criteria as the bullish scenario, the midpoint is vital to both sides.

TESLA BULLISH BREAKOUT|LONG|
✅TESLA is going up
Now and the stocks is trying to
Made a bullish breakout
Of the key horizontal
Level of 367.50$ and IF breakout
Is confirmed we will be expecting
A further bullish move up
LONG🚀
✅Like and subscribe to never miss a new idea!✅

TSLA about to POPClear play that I’ve been sharing with friends and it’s playing out perfectly so far
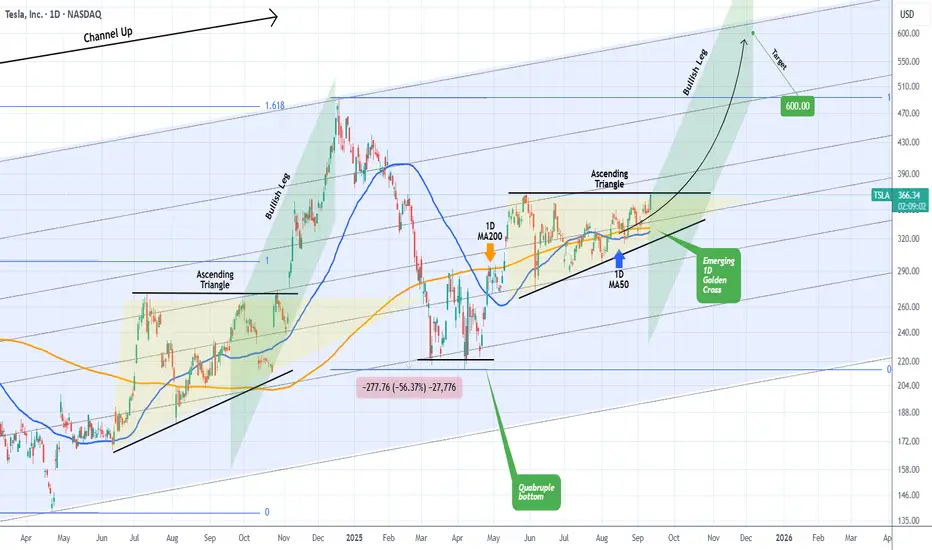
TESLA about to start a parabolic rally to $600.Exactly 3 months ago (June 06, see chart below) we called a bottom buy on Tesla (TSLA) right when it was trading at $284.70:
The price followed this prediction precisely, got out of the Bull Flag and eyes now a new 4-month High above $368.
This would be a break above the 4-month Ascending Triangle, a pattern we last saw during the stocks previous Bullish Leg in mid-end 2024. As you can see, that break-out delivered the Higher High test of Tesla's 3-year Channel Up at $488.
At the same time we are about to form a 1D Golden Cross, which makes the bullish sentiment even stronger.
As with our June 06, we still expect the price to reach $600 and price a new Higher High on the long-term Channel Up
-------------------------------------------------------------------------------
** Please LIKE 👍, FOLLOW ✅, SHARE 🙌 and COMMENT ✍ if you enjoy this idea! Also share your ideas and charts in the comments section below! This is best way to keep it relevant, support us, keep the content here free and allow the idea to reach as many people as possible. **
-------------------------------------------------------------------------------
💸💸💸💸💸💸
👇 👇 👇 👇 👇 👇
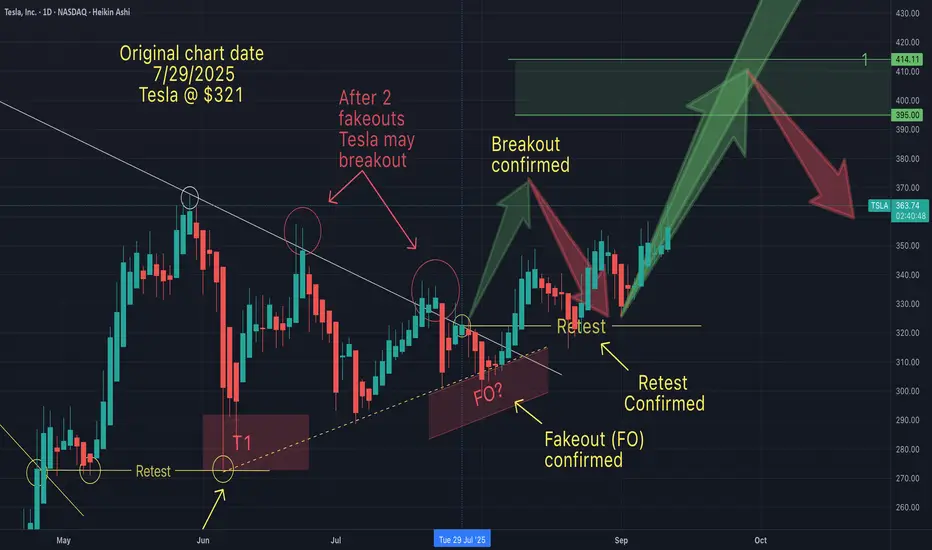
Is Tesla on it's way to $400+On July 29th I suggested that Tesla was about to break out to the upside (after fakeouts).
Then on Sep 4th I suggested that after a restest (of the breakout line), Tesla would begin its climb. This portion of the anticipated pattern now been confirmed.
One question now remains...will Tesla hit my T1 ($395 - $414).
What do you think? I'd like to know what the sentiment is out there. I'd like to hear your thoughts.
TSLA Battery Is still loading - May the Energy be with you.We see the slanted coil.
It act's like a Battery loading energy.
At one time it will expend it's energy, either up, or down.
Forks show the most probable path of price.
Forks provide a framework, where a Trader doesn't have to guess. Just trade the rule-book and follow your one plan.
Either we get stopped or we are happy Teslonians.
May the Energy be with you §8-)
BABA 1D Time frame📊 Market Snapshot
Current Price: Around $146–147
Recent Trend: Strong upward momentum over the past weeks
Overall Technical Bias: Bullish, but nearing overbought
🔎 Technical Indicators
RSI (14-day): ~75 → Overbought zone, signals strong momentum but also risk of pullback.
MACD: Positive → Momentum remains bullish.
Stochastic & CCI: High readings → Also showing overbought conditions.
📈 Moving Averages
5-day MA: ~$146 → Bullish short-term support
10-day MA: ~$145 → Still bullish
20-day MA: ~$140 → Strong base level
50-day MA: ~$137 → Medium-term support
100-day MA: ~$130 → Long-term support
200-day MA: ~$125 → Major long-term support
All major moving averages are aligned bullishly.
🔧 Support & Resistance
Support Zone: ~$145–146
Resistance Zone: ~$147–150 (immediate), with potential toward $160 if breakout continues
📅 Outlook
Bullish Case: If price holds above ~$147, it could target $150+ and possibly $160.
Bearish Case: Overbought readings may trigger a pullback toward $145 or even $140.
Overall Bias: Bullish trend intact, but short-term consolidation or mild correction is possible.

COIN 1D Time frameMarket Snapshot
Current Price: ~$318.78
Daily Change: +5.5% (strong upward move)
🔎 Technical Indicators
RSI (14-day): ~71 → Overbought zone, signals caution.
MACD: Positive and rising → Strong bullish momentum.
Stochastic Oscillator: High → Overbought conditions, risk of short-term pullback.
ADX: ~16 → Weak trend strength despite recent move.
📈 Moving Averages
5-day MA: ~$315 → Bullish
50-day MA: ~$305 → Bullish
200-day MA: ~$314 → Bullish
All three show buy signals, confirming trend strength.
🔧 Support & Resistance
Support Levels: ~$315, ~$313, ~$311
Resistance Levels: ~$319, ~$321, ~$330
📅 Outlook
Bullish Case: If COIN sustains above ~$319, it could push toward $330 or higher.
Bearish Case: With RSI in overbought territory, a pullback toward ~$315–311 is possible.
Overall Bias: Moderately bullish, but vulnerable to short-term profit-taking.

BABA 3Hour Time frameBABA 3-Hour Snapshot
Current Price: $147.10
Change: +4.18% from the previous close
Market Cap: $347.34 billion
P/E Ratio: 16.47
EPS (TTM): $8.84
Beta: 0.54
Dividend Yield: 0.73%
🔎 Key Levels
Resistance:
R1: $148.50 (prior high and Fibonacci cluster)
R2: $157.80 (Fibonacci 0.382 retracement)
Support:
S1: $135.00 (recent breakout level)
S2: $130.00 (next support level)
📈 Technical Indicators
RSI (14): 62.82 — Neutral
MACD: 4.08 — Bullish momentum
Moving Averages:
5-period SMA: $135.30 — Buy signal
10-period SMA: $128.98 — Buy signal
20-period SMA: $125.03 — Buy signal
50-period SMA: $119.26 — Buy signal
📌 Market Sentiment
Catalyst: Shares surged ~13% following a favorable court ruling, marking the highest close since March 2025.
Sector Performance: Positive momentum in the Chinese tech sector, with Alibaba leading gains.
Analyst Outlook: Average 12-month price target of $167.17, indicating a 13.64% upside from current levels.
StockAnalysis
📅 Outlook
Bullish Scenario: A breakout above $148.50 could lead to a push toward $157.80 and higher.
Bearish Scenario: A drop below $135.00 may test support around $130.00.
Overall Bias: Moderately bullish, with positive momentum but facing near-term resistance.

Tesla: New Alternative Scenario Emerges Tesla continues to face significant upward pressure, repeatedly testing resistance at $373.04. As a result, we have dropped our previous alternative scenario of an early sell-off in favor of a new upside alternative. We now see a 37% chance that the stock will break above the $373.04 resistance, forming an early top for beige wave alt.x above the next key level at $405.54. However, our primary expectation is that TSLA will first pull back into our green Target Zone between $273.11 and $231.66, where we anticipate the low of green wave . Thus, this range could present new short- to medium-term long entry opportunities to capitalize on the subsequently expected rally, which is likely to culminate in the regular wave x high above $405.54. Following this top, we expect the final sell-off phase within the broader corrective structure: wave y should drive price down into the beige Target Zone between $157.88 and $46.70, where we project the low of blue wave (II). This range could present attractive opportunities for longer-term long positions. For potential long trades—whether in the green or the beige zone—a stop set 1% below the lower boundary of the respective zone can help manage risk.

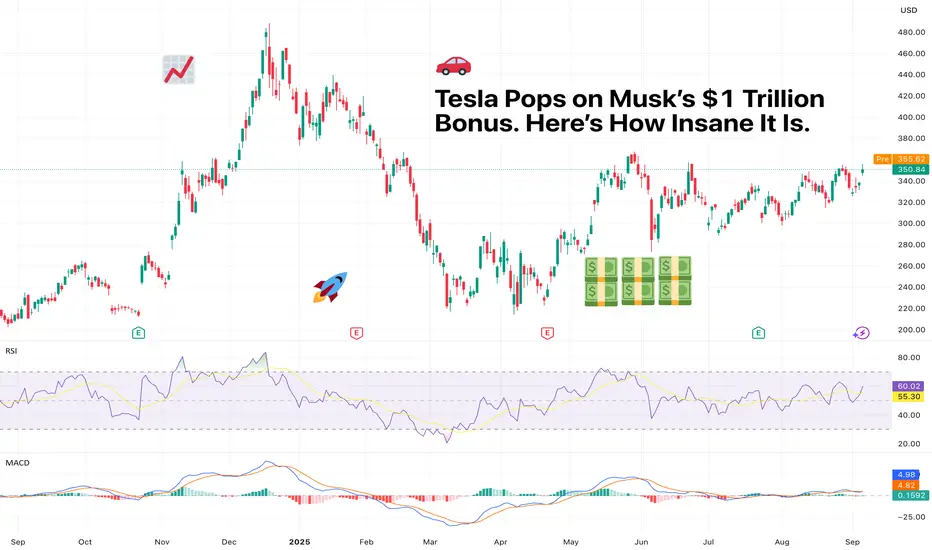
Tesla Pops on Musk’s $1 Trillion Bonus. Here’s How Insane It Is.The mother of all KPIs.
Elon Musk has a new carrot dangling in front of him, and it’s not a Mars colony or a flamethrower.
Tesla’s board is asking investors to approve a bonus so massive, so absurd, so galaxy-brained, that it makes past compensation packages look like pocket change.
Ready? We’re talking about the potential for a $1 trillion payday if Musk manages to drag Tesla to an $8.5 trillion valuation. In ten years.
That’s nearly eight times where it is today. So let’s unpack just how unhinged this deal really is, why Tesla stock popped on the news, and what it would take for Musk to collect.
🚀 The Trillion-Dollar Tease
Tesla stock NASDAQ:TSLA climbed 3.6% Friday on the back of this announcement, not because anything happened then and there, but because something could happen ten years out.
The board dropped the proposal in a securities filing, outlining that Musk could receive up to 423 million shares – worth over $1 trillion – if Tesla smashes through a series of market cap and operational milestones.
In other words, the board is looking to lock Musk in and make sure he doesn’t get distracted by rocket launches, robot brains, or tweeting memes about NPCs at 2 a.m.
💰 What’s the Catch?
The catch is that this isn’t free money. To claim the full $1 trillion, Musk has to lead Tesla into uncharted corporate territory: Boost Tesla’s market cap from $1 trillion to $8.5 trillion by 2035. That’s more than double Nvidia’s NASDAQ:NVDA current valuation ($4.2 trillion) and equal to the GDP of Japan, Germany, and the UK, combined.
Deliver 12 million more EVs (as of this summer, Tesla has managed about 8 million in its entire history).
Land 10 million autonomous driving subscriptions.
Register and operate 1 million robotaxis (Not on the market right now).
Sell 1 million AI robots (Not on the market right now).
Increase adjusted earnings from $13 billion to $400 billion. That’s a 24x jump in profit.
Next stop? Tesla’s earnings report ( Earnings Calendar for reference) in about a month from now.
🪄 The Board’s Spin
Tesla Chair Robyn Denholm called the package “fundamental to Tesla becoming the most valuable company in history.” Translation: Elon, please.
In a letter to shareholders, the board said the award “aligns extraordinary long-term shareholder value with incentives that will drive peak performance from our visionary leader.”
Which is corporate-speak for: We know he’s mercurial, but this should keep him tethered for at least a decade.
⚡ The Stakes for Tesla
Tesla’s stock reaction says investors are cautiously optimistic – emphasis on cautiously. Shares have been down nearly 30% since mid-December, plagued by slowing EV sales , rising competition, and Musk’s very public political feuds (including an ongoing rift with President Trump that’s cost Tesla federal EV incentives).
To make matters trickier, Tesla’s brand halo isn’t as shiny as it used to be. EV rivals like BYD, Rivian, Hyundai, and Mercedes are cutting into Tesla’s dominance, while price cuts have compressed margins.
Analysts expect Tesla to deliver 1.6 million vehicles this year, down from last year’s totals. On top of that, revenue continues to slide, lower by 12% in the last quarter , indicating a shrinking business.
So why the big gamble? Because if this plan works, Tesla wouldn’t just catch up – it would become the undisputed king of EVs, autonomous driving, AI robotics, and energy storage. In other words, a full-blown tech empire.
💰 Musk’s 25% Solution
Part of Musk’s motivation here isn’t just about the money – though a trillion-dollar payday to one person is actually insane. Musk has repeatedly said he wants at least 25% voting control over Tesla to feel “comfortable” keeping his focus there.
Under the proposed plan, if Musk hits every target, his stake in Tesla would rise to 25% from his current holdings of 12%, giving him outsized influence over its future direction. That means if Tesla’s valuation is at $8.5 trillion, he’d be holding shares worth $2.12 trillion. But if he misses? He gets nothing. Zero.
It’s a high-wire act for both Musk and shareholders: reward him with historic wealth if he delivers, but don’t overpay if he falls short.
🤖 Robotaxis, Humanoids, and AI Dreams
A key piece of this plan hinges on Musk’s boldest vision yet: turning Tesla into an autonomous AI platform. Forget just cars – think fleets of robotaxis generating recurring subscription revenue and Optimus humanoid robots replacing repetitive labor in warehouses, factories, and maybe even households.
If this strategy pays off, Tesla won’t just be an automaker – it’ll be an AI-powered infrastructure company. But right now, that future is priced into a present that still depends on selling Model Ys and Cybertrucks.
🔍 The Market’s Split Personality
Wall Street’s reaction has been mixed, and here’s why:
The bulls argue that Tesla has the innovation engine, the brand, and, yes, the Musk factor to make the impossible happen. They point to SpaceX’s reusable rockets and Nvidia’s AI dominance as proof that moonshots sometimes land.
The bears see the trillion-dollar pay package as monopoly money that’ll never be real. Between slowing EV demand, Tesla’s underwhelming Q2 deliveries, and Musk’s penchant for side quests, they’re skeptical Tesla can hit even half of these KPIs.
🏁 The Bottom Line
Tesla’s proposed Musk mega-package is nothing short of audacious. It’s an all-in bet on:
Explosive growth in EVs and autonomous driving
Turning Tesla into an AI + robotics powerhouse
Keeping Musk’s focus locked on Tesla instead of Mars, memes, or political campaigns
Is the plan bold? Absolutely. Is it risky? Without a doubt.
Off to you : Do you believe Musk deserves the “One-Trillion-Dollar Man” (or $2T) title? Or is all that a desperate move to keep him around? Share your thoughts in the comments!
TESLA Under Pressure! SELL!
My dear followers,
This is my opinion on the TESLA next move:
The asset is approaching an important pivot point 350.79
Bias - Bearish
Safe Stop Loss - 354.45
Technical Indicators: Supper Trend generates a clear short signal while Pivot Point HL is currently determining the overall Bearish trend of the market.
Goal - 343.14
About Used Indicators:
For more efficient signals, super-trend is used in combination with other indicators like Pivot Points.
Disclosure: I am part of Trade Nation's Influencer program and receive a monthly fee for using their TradingView charts in my analysis.
———————————
WISH YOU ALL LUCK

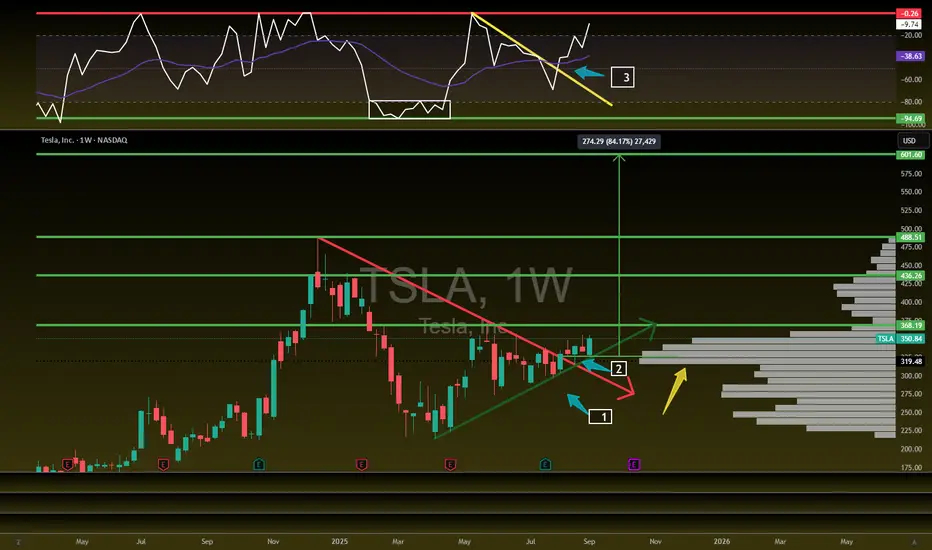
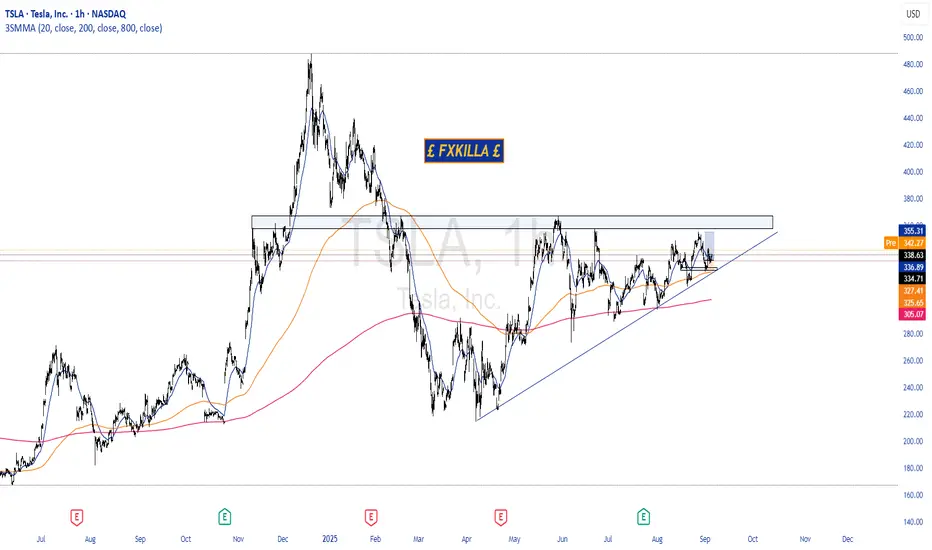
Tesla Looks Primed!NASDAQ:TSLA Looks primed!
Bullish as all getup!
Breaking out-Volume Shelf-Bullish Willy
Targets: $368/ 436/ 488/ 601
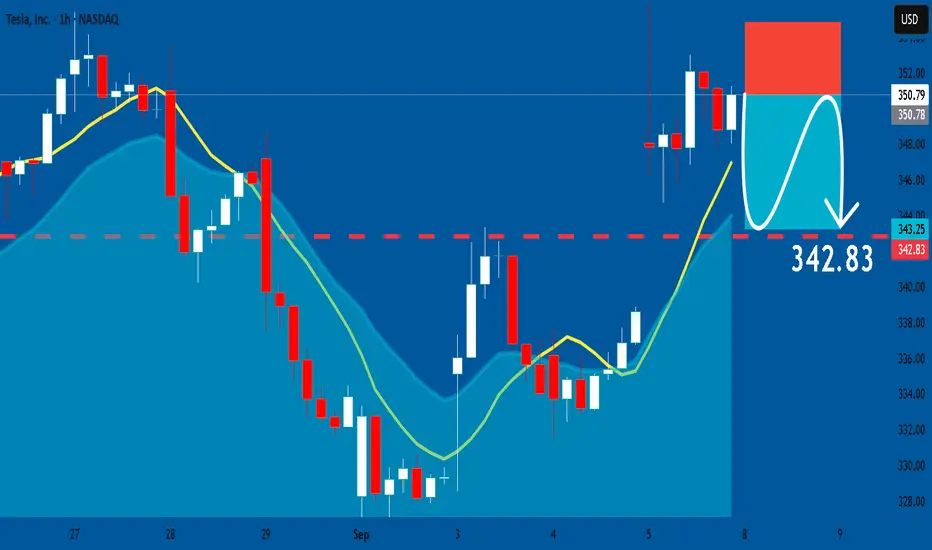
TESLA: Bearish Continuation & Short Signal
TESLA
- Classic bearish setup
- Our team expects bearish continuation
SUGGESTED TRADE:
Swing Trade
Short TESLA
Entry Point - 350.79
Stop Loss - 354.84
Take Profit - 342.83
Our Risk - 1%
Start protection of your profits from lower levels
Disclosure: I am part of Trade Nation's Influencer program and receive a monthly fee for using their TradingView charts in my analysis.
❤️ Please, support our work with like & comment! ❤️
TESLA HIGH PROBABILITY SETUP SOON!!!🚨 TESLA HIGH PROBABILITY BUY SETUP 🚨
* Here We Can See Clearly The Next Potential Move For Tesla Coming Hours/Days.
* Keep Your Eyes Close On Your Trading Positions.
* Happy PIP Hunting Traders.
£ FXKILLA £
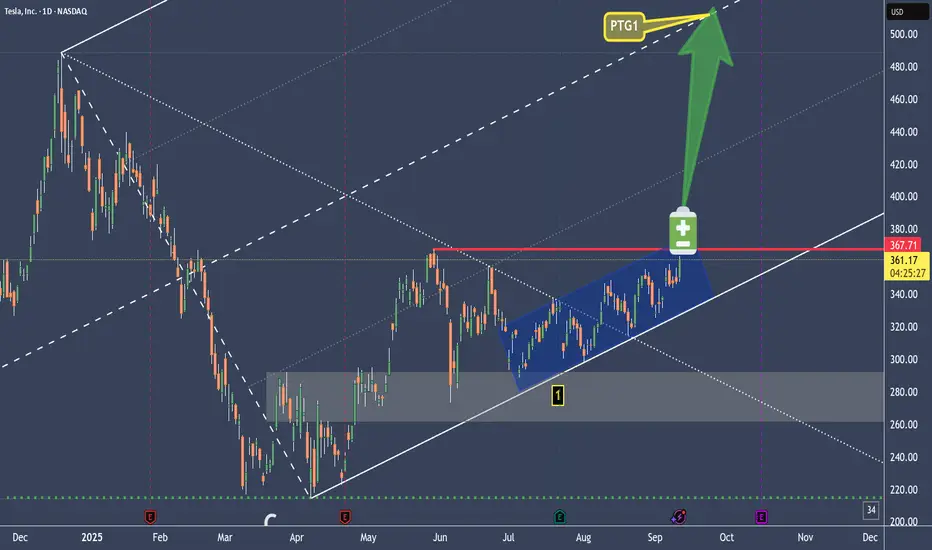
TSLA Creeping up from original triangle, but still in a larger tNASDAQ:TSLA continues to take the stairs of worry up to my trading signal target from the original triangle analysis, $386, but the pattern has morphed into what appears to be a barrier triangle now as price struggles at $360 with a series of higher lows.
RSI is comfortable at the EQ with room to grow while price remains above the daily pivot.
Analysis is invalidated below wave (C) $284
Safe trading
You will ask yourself, "how did he know Tesla would do that"?On July 29th I suggested that Tesla would drop into into my fakeout zone, followed by the usual "stop hunt-rise" and retrace (to test the breakout).
Once I saw 2 fake breakouts of trend, I expected this breakout to occur (after the fakeout). Once the breakout occurs, we always see the retest. The only question that remains is Tesla going to continue to follow the path outlined on my chart?
If Tesla does what it almost always does during this pattern, the answer is yes. There may be a quick liquidity grab below the breakout low, before continuing up towards my Bullish T1 target.
But keeping in mind, that Tesla is at an inflection point, I'm prepared for the possibility of a bearish scenario. Anticpating price action helps me quickly invalidate my trade ideas, so I can pivot accordingly. Therefore if Tesla holds resistance below $300, I expect a test of my bearish T2 target.
For now I remain cautiosly bullish until proven otherwise.
May the trends be with you.
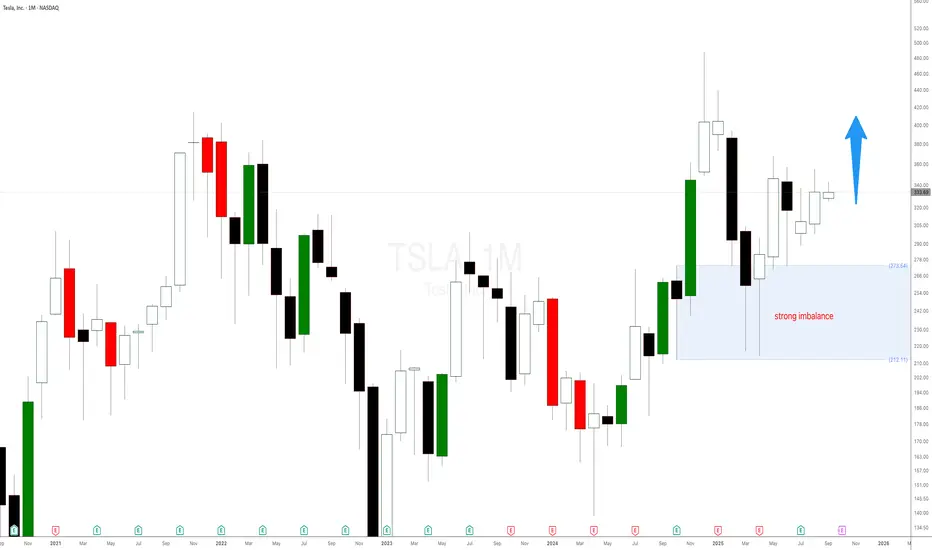
Tesla stock is printing new highs helped by the strong imbalanceTesla stock is printing new highs helped by the strong weekly imbalance as expected and mentioned in a previous Tesla stock analysis. The weekly demand level at $298 is playing out well. There is still a lot of room for NASDAQ:TSLA stock to keep on rallying. You can use the smaller timeframes to add more long positions or new imbalance to trade with even higher probability.
Tesla - The triangle is still valid!🚔Tesla ( NASDAQ:TSLA ) remains totally bullish:
🔎Analysis summary:
If we look at the chart of Tesla, we can see a very long term consolidation over the past four years. This, however, does not mean that the bullrun is over but rather preparing for the next bullish move. We just have to wait for the bullish ascending triangle pattern breakout.
📝Levels to watch:
$400
SwingTraderPhil
SwingTrading.Simplified. | Investing.Simplified. | #LONGTERMVISION

TESLA: Long Trade with Entry/SL/TP
TESLA
- Classic bullish setup
- Our team expects bullish continuation
SUGGESTED TRADE:
Swing Trade
Long TESLA
Entry Point - 333.86
Stop Loss - 329.53
Take Profit - 342.35
Our Risk - 1%
Start protection of your profits from lower levels
Disclosure: I am part of Trade Nation's Influencer program and receive a monthly fee for using their TradingView charts in my analysis.
❤️ Please, support our work with like & comment! ❤️
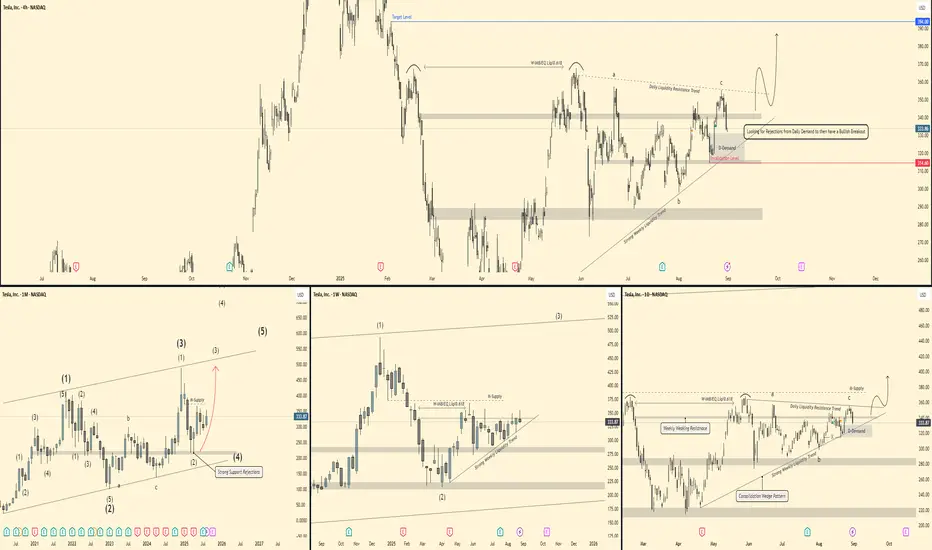
Tesla - Mutli-timeframe breakdown 🕰 Monthly View
Price is respecting a long-term ascending channel.
Strong rejections from support confirm bullish momentum.
Current wave count suggests we are working through a larger impulsive structure – potential for Wave (3) continuation higher.
If momentum holds, upside could target the 450–500 zone in the longer run.
📆 Weekly View
Structure shows a 3-wave correction complete (ABC) into demand.
Price has tapped weekly demand + liquidity trendline.
Currently bouncing, with a breakout potential toward 375–400 (supply zone).
Breakout of the wedge pattern would confirm strength and continuation higher.
📅 Daily View
Price is reacting off Daily Demand (≈320–325 zone).
Strong liquidity resistance trend overhead (≈355–365).
If rejections hold and demand stays valid, a bullish breakout setup forms → target near 390–400.
Invalidation if we close below 314 (daily demand break).
⏱ 4H View
Local liquidity sweep into demand.
Bullish scenario: push toward 350–355 short-term.
Watch for confirmation: rejection candles + momentum shift needed before entry.
🎯 Bias & Trade Idea
Bias: Bullish (buy from demand)
Entry Zone: 320–330 (Daily Demand)
Targets:
Short-term → 355
Mid-term → 390–400
Invalidation: Daily close below 314
⚠️ Risk Note
Tesla is highly volatile. Stick to clear confirmations at demand before entry, and manage risk tightly below invalidation.
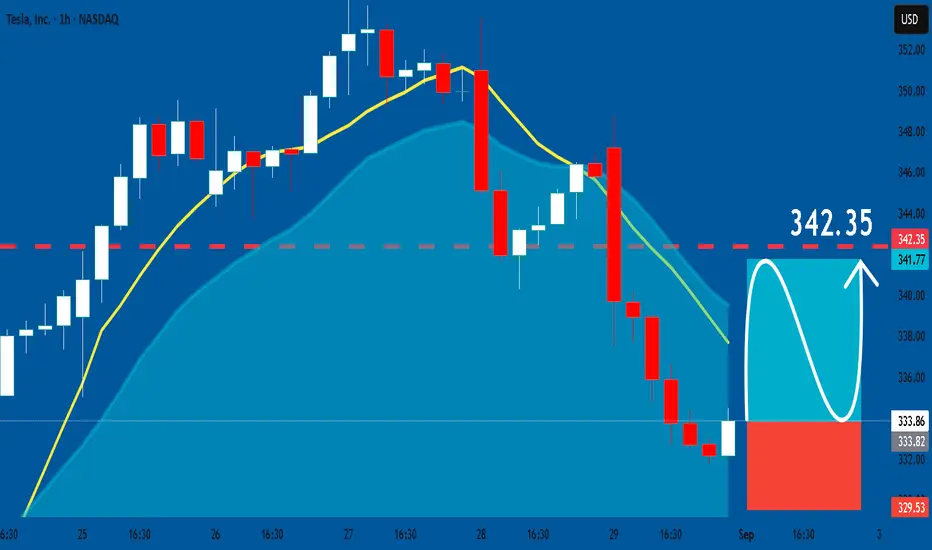
TESLA Expected Growth! BUY!
My dear friends,
Please, find my technical outlook for TESLA below:
The price is coiling around a solid key level - 333.86
Bias - Bullish
Technical Indicators: Pivot Points High anticipates a potential price reversal.
Super trend shows a clear buy, giving a perfect indicators' convergence.
Goal - 344.59
Safe Stop Loss - 327.03
About Used Indicators:
The pivot point itself is simply the average of the high, low and closing prices from the previous trading day.
Disclosure: I am part of Trade Nation's Influencer program and receive a monthly fee for using their TradingView charts in my analysis.
———————————
WISH YOU ALL LUCK
