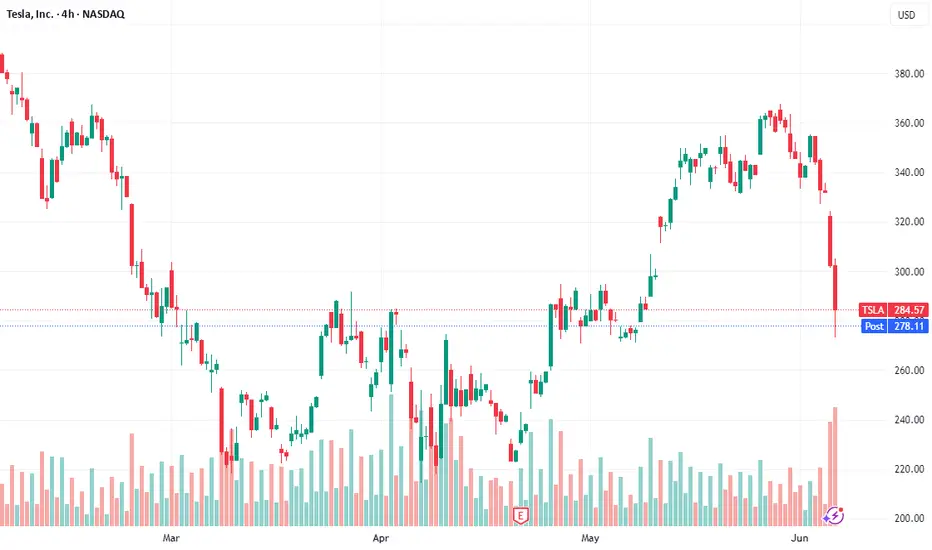
TESLA PRICE ACTION JUNE 5TH 2025Welcome to Tesla weekly &there is a news about Elon going against the bill from trump.
I will never buy their news as they are manipulating retailers.
I am buying & I have discussed all the important levels here,
If you have any doubts, feel free to leave your comments here.
Teslaanalysis

Tesla's Perfect Storm: A $152 Billion MeltdownTesla's Perfect Storm: A $152 Billion Meltdown, Chinese Rivals on the Attack, and a Faltering Shanghai Fortress
A tempest has engulfed Tesla, the electric vehicle behemoth, wiping a staggering $152 billion from its market capitalization in a single day. This monumental loss, the largest in the company's history, was triggered by a dramatic and public feud between CEO Elon Musk and former U.S. President Donald Trump. The confrontation, however, is but the most visible squall in a much larger storm. Lurking just beneath the surface are the relentless waves of competition from Chinese automakers, who are rapidly eroding Tesla's dominance, and the ominous sign of eight consecutive months of declining shipments from its once-impenetrable Shanghai Gigafactory.
The confluence of these events has plunged Tesla into a precarious position, raising fundamental questions about its future trajectory and its ability to navigate the turbulent waters of a rapidly evolving automotive landscape. The narrative of Tesla as an unstoppable force is being rewritten in real-time, replaced by a more complex and challenging reality.
The Trump-Musk Spat: A Bromance Turned Billion-Dollar Blow-Up
The relationship between Elon Musk and Donald Trump, once a seemingly symbiotic alliance of power and influence, has spectacularly imploded, leaving a trail of financial and political wreckage in its wake. The public falling out, which played out in a series of scathing social media posts and public statements, sent shockwaves through Wall Street and Washington, culminating in a historic sell-off of Tesla stock.
The genesis of the feud lies in Musk's vocal criticism of a sweeping tax and spending bill, a cornerstone of the Trump administration's second-term agenda. Musk, who had previously been a vocal supporter and even an advisor to the President, lambasted the legislation as a "disgusting abomination" filled with "pork." This public rebuke from a figure of Musk's stature was a direct challenge to Trump's authority and legislative priorities.
The President's response was swift and sharp. In an Oval Office meeting, Trump expressed his "disappointment" in Musk, questioning the future of their "great relationship." The war of words then escalated dramatically on their respective social media platforms. Trump, on his social media platform, threatened to terminate Tesla's lucrative government subsidies and contracts, a move that would have significant financial implications for Musk's business empire. He also claimed to have asked Musk to leave his advisory role, a statement Musk labeled as an "obvious lie."
Musk, in turn, did not hold back. On X (formerly Twitter), he claimed that without his substantial financial support in the 2024 election, Trump would have lost the presidency. This assertion of his political influence was a direct jab at the President's ego and a stark reminder of the financial power Musk wields. The spat took an even more personal and inflammatory turn when Musk alluded to Trump's name appearing in the unreleased records of the Jeffrey Epstein investigation.
The market's reaction to this public spectacle was brutal. Tesla's stock plummeted by over 14% in a single day, erasing more than $152 billion in market capitalization and pushing the company's valuation below the coveted $1 trillion mark. The sell-off was a clear indication of investor anxiety over the political instability and the potential for tangible financial repercussions from the feud. The incident underscored how intertwined Musk's personal and political activities have become with Tesla's financial performance, a vulnerability that has been a recurring theme for the company.
The Chinese Dragon Breathes Fire: Tesla's EV Dominance Under Siege
While the political drama in Washington captured headlines, a more fundamental and perhaps more enduring threat to Tesla's long-term prosperity is brewing in the East. The Chinese electric vehicle market, once a key engine of Tesla's growth, has become a fiercely competitive battleground where a host of domestic rivals are not just challenging Tesla, but in some aspects, surpassing it.
Companies like BYD, Nio, XPeng, and now even the tech giant Xiaomi, are relentlessly innovating and offering a diverse range of electric vehicles that are often more affordable and technologically advanced than Tesla's offerings. This intense competition has led to a significant erosion of Tesla's market share in China. From a dominant position just a few years ago, Tesla's share of the battery electric vehicle market has fallen significantly.
One of the key advantages for Chinese automakers is their control over the entire EV supply chain, particularly in battery production. This allows them to produce vehicles at a lower cost, a crucial factor in a price-sensitive market. The result is a growing disparity in pricing, with many Chinese EVs offering comparable or even superior features at a fraction of the cost of a Tesla.
Furthermore, Chinese consumers are increasingly viewing electric vehicles as "rolling smartphones," prioritizing advanced digital features, connectivity, and a sophisticated user experience. In this regard, many domestic brands are seen as more innovative and in tune with local preferences than Tesla. This shift in consumer sentiment has been a significant factor in the declining interest in the Tesla brand in China.
The numbers paint a stark picture of Tesla's predicament. While the overall new-energy vehicle market in China continues to grow at a remarkable pace, Tesla's sales have been on a downward trend. This is a worrying sign for a company that has invested heavily in its Chinese operations and has historically relied on the country for a substantial portion of its global sales.
The pressure on Tesla's sales in China is so intense that its sales staff are working grueling 13-hour shifts, seven days a week, in a desperate attempt to meet demanding sales targets. The high-pressure environment has reportedly led to high turnover rates among sales staff, a clear indication of the immense strain the company is under in this critical market.
The Shanghai Gigafactory: A Fortress with a Faltering Gate
The struggles in the Chinese market are reflected in the declining output from Tesla's Shanghai Gigafactory. For eight consecutive months, shipments from the factory, which serves both the domestic Chinese market and is a key export hub, have seen a year-on-year decline. In May 2025, the factory delivered 61,662 vehicles, a 15% drop compared to the same period the previous year.
This sustained decline in shipments is a significant red flag for several reasons. Firstly, the Shanghai factory is Tesla's largest and most efficient production facility, accounting for a substantial portion of its global output. A slowdown in production at this key facility has a direct impact on the company's overall delivery numbers and financial performance.
Secondly, the declining shipments are a direct consequence of the weakening demand for Tesla's vehicles in China. Despite being a production powerhouse, the factory's output is ultimately dictated by the number of cars it can sell. The falling shipment numbers are a clear indication that the company is struggling to maintain its sales momentum in the face of fierce competition.
The situation in China is a microcosm of the broader challenges facing Tesla. The company's product lineup, which has not seen a major new addition in the affordable segment for some time, is starting to look dated compared to the rapid product cycles of its Chinese competitors. The refreshed Model 3 and Model Y, while still popular, are no longer the novelties they once were, and are facing a growing number of compelling alternatives.
A Confluence of Crises: What Lies Ahead for Tesla?
The convergence of a high-profile political feud, intensifying competition, and production headwinds has created a perfect storm for Tesla. The company that once seemed invincible is now facing a multi-front battle for its future.
The spat with Trump, while seemingly a short-term crisis, has exposed the risks associated with a CEO whose public persona is so closely tied to the company's brand. The incident has also highlighted the potential for political winds to shift, and for government policies that have benefited Tesla in the past to be reversed.
The challenge from Chinese automakers is a more fundamental and long-term threat. The rise of these nimble and innovative competitors is not a fleeting trend, but a structural shift in the global automotive industry. Tesla can no longer rely on its brand cachet and technological lead to maintain its dominance. It must now compete on price, features, and innovation in a market that is becoming increasingly crowded and sophisticated.
The declining shipments from the Shanghai factory are a tangible manifestation of these challenges. The factory, once a symbol of Tesla's global manufacturing prowess, is now a barometer of its struggles in its most important market.
To navigate this storm, Tesla will need to demonstrate a level of agility and adaptability that it has not been required to show in the past. This will likely involve a renewed focus on product development, particularly in the affordable EV segment, to better compete with the value propositions offered by its Chinese rivals. It will also require a more nuanced and strategic approach to the Chinese market, one that acknowledges the unique preferences and demands of Chinese consumers.
The coming months will be a critical test for Tesla and its leadership. The company's ability to weather this storm and emerge stronger will depend on its capacity to innovate, to compete, and to navigate the complex and often unpredictable currents of the global automotive market. The era of unchallenged dominance is over. The battle for the future of electric mobility has truly begun.
My Technical Analysis for $TSLA (Tesla)📊 Technical Analysis: NASDAQ:TSLA (Tesla)
🗓️ Updated: March 24, 2025
🚨 Critical Zone Being Tested
After breaking out of a multi-year symmetrical triangle, NASDAQ:TSLA is now retesting the upper boundary of the pattern — perfectly aligned with the key ACTION ZONE (liquidity zone + long-term MAs).
🔵 ACTION ZONE ($245–265):
High-probability decision area. Holding this level could trigger a fresh bullish leg.
🟣 SWING BOX ($180–210):
If support fails, this is the next logical area for a potential bullish reaction.
🟡 FVG Daily ($75–115):
Unmitigated Fair Value Gap. Only relevant in case of a major breakdown.
📉 SMI (Stochastic Momentum Index):
Currently in negative territory, but nearing oversold — watch for a potential reversal.
🎯 Scenarios:
Bullish: Strong rejection from the Action Zone → potential move to $350–400 ✅
Bearish: Breakdown below the blue zone → eyes on Swing Box or FVG for reentry ⚠️
📌 Reminder: This is not financial advice. Always manage risk and wait for confirmation before entering a trade.
💬 What do you think? Is Tesla preparing for a bounce or heading lower?
👇 Share your thoughts in the comments!

TESLA GOES READY FOR ITS NEW LEG DOWN. HERE'S WHAT WE KNOW ABOUTTesla stock declined after Elon Musk’s departure from the Trump administration due to a combination of reputational, operational, and market factors:
Political Backlash and Brand Damage. Musk’s close association with the Trump administration and his leadership of the Department of Government Efficiency (DOGE) generated widespread protests and alienated many of Tesla’s traditional, progressive customer base. This political controversy led to a decline in consumer interest and unsettled investors who were concerned about the brand’s long-term appeal.
Sales and Profit Declines. Tesla faced falling sales and profits, with deliveries dropping in key markets like China and Europe, partly due to intensifying competition and partly due to the backlash against Musk’s political activities. The company reported a 13% year-over-year decline in deliveries, and operating profits fell as well.
Investor Concerns Over Leadership Focus. Investors grew worried that Musk’s political involvement was distracting him from Tesla’s core business at a critical time. There was a perception that the company was losing its competitive edge and that Musk’s attention was divided, which amplified concerns about Tesla’s future growth.
Market Correction After “Trump Bump”. Tesla’s stock had surged after Trump’s election, buoyed by expectations of favorable policies. However, as Musk’s political involvement became a liability and operational challenges mounted, the post-election gains evaporated, and the stock corrected sharply downward.
In summary, Musk’s controversial political role, combined with operational headwinds and shifting investor sentiment, triggered a significant decline in Tesla’s stock after his exit from the Trump administration.
--
Best wishes
@PandorraResearch Team

Tesla (TSLA) Share Price Falls by 3.5%Tesla (TSLA) Share Price Falls by 3.5%
Yesterday, the share price of Tesla (TSLA) dropped by 3.5%, placing it among the five worst-performing stocks of the day in the S&P 500 index (US SPX 500 mini on FXOpen). Since the peak on 29 May, the decline now totals nearly 10%.
Why Tesla (TSLA) Shares Are Falling
Among the bearish factors are:
→ A drop in car sales in Europe. Sales in Germany fell by 36% year-on-year in May.
→ Growing competition from China. May deliveries from Tesla’s Chinese factory were down 15% year-on-year.
→ Elon Musk’s criticism of the US President’s proposed government spending bill.
Media reports also suggest that Musk took offence at staffing decisions at NASA, while Trump is reportedly losing patience with Musk over his attacks on the spending bill.
A potential rift between Musk and Trump could have far-reaching consequences — including for TSLA shares.
Technical Analysis of TSLA Stock Chart
Six days ago, we:
→ Drew an ascending channel (shown in blue), noting that the upper boundary could pose a challenge to further gains;
→ Highlighted the $355–$375 zone (shown in purple) as a possible resistance area;
→ Suggested a correction scenario following a roughly 27% surge in TSLA’s stock price during May.
Since then, the price has dropped towards the median line of the ascending channel. If this fails to offer sufficient support, the correction may continue towards the lower boundary of the channel, which is reinforced by support around the psychological $300 level and former resistance at $290.
News related to the planned rollout of Tesla’s robotaxi trials could significantly impact TSLA’s price movements in June.
This article represents the opinion of the Companies operating under the FXOpen brand only. It is not to be construed as an offer, solicitation, or recommendation with respect to products and services provided by the Companies operating under the FXOpen brand, nor is it to be considered financial advice.

Tesla: Completed!TSLA has moved somewhat closer to the resistance at $373.04 since our last update, but these gains have now been tempered. We now consider the turquoise wave 4 as finished and anticipate imminent sell-offs during wave 5. These should eventually complete the magenta wave (3) of a larger downward impulse below the support at $215.01. However, due to recent upward momentum, we have increased the relevance of our alternative scenario. We now consider it 38% likely that the stock has already completed the large correction of the blue wave alt.(II) with the last significant low and will continue to rise directly during wave alt.(III). In this case, the price would next not only rise above the nearby resistance at $373.04 but also overcome the higher levels at $405.54 and $488.50.
📈 Over 190 precise analyses, clear entry points, and defined Target Zones - that's what we do.

Is This the Perfect Moment to Execute the Tesla Heist?💰 Tesla Stock Market Heist Blueprint 🚀
🌟 Hi! Hola! Ola! Bonjour! Hallo! Marhaba! 🌟
Dear Money Makers & Robbers, 🤑💰💸✈️
Here’s our grand plan: a 🔥Thief Trading Style heist🔥 targeting the TESLA stock! Let’s break in with this cunning strategy — chart-ready and primed for action!
🎯 Entry:
The vault’s open! Grab the bullish loot at any price — the heist is live!
Tip: For precision, use a buy limit order on 15m/30m swing highs or lows — that’s your perfect pullback entry!
🛑 Stop Loss:
Thief SL is stashed at the nearest swing low (or just below the MA on the daily chart ~300.00 for swing trades).
Tailor SL to your trade risk, lot size, and your thieving gang’s order plan.
🏴☠️ Target:
460.00 — or vanish before hitting the target to avoid the traps of the overbought zone!
💎 The Setup:
We’re seeing bullishness fueled by key factors: macro moves, fundamentals, sentiment, intermarket trends… it’s all in play! 📈🔗🌏
Check the macro, COT report, sentiment outlook, and future trend targets to stay ahead of the game!
⚠️ Trading Alert:
News releases can flip the game fast.
Avoid fresh trades during major news.
Use trailing stops to lock in those juicy profits and protect your loot.
❤️🔥 Support the Heist Crew!
💥Hit the Boost Button💥 — fuel our robbery plans and let’s keep cashing in every day!
The Thief Trading Style: slick, powerful, and ready for the next heist.
See you soon with another plan, fellow robbers! 🤑🐱👤🤩

Musk Steps Away from Politics: What Does It Mean for Tesla?Musk Steps Away from Politics: What Does It Mean for Tesla (TSLA) Stock?
Yesterday, it was announced that Elon Musk will be stepping down from the Trump administration as his term as head of DOGE—where he focused on reducing government spending—has come to an end.
This decision follows his statement at the economic forum in Qatar, where Musk said he plans to focus less on politics, as he feels he has already done enough in that realm.
What Does This Mean for Tesla (TSLA) Stock?
Musk’s move away from politics is likely a positive signal for investors. Here's why:
→ The company’s CEO can now devote more time to addressing issues such as declining vehicle sales in Europe;
→ Musk’s role at DOGE will no longer pose reputational risks for Tesla..
During yesterday’s main trading session, TSLA stock surged to $367—its highest level since mid-February.
Technical Analysis of TSLA Stock Chart
The price continues to hover near the upper boundary of an ascending channel (marked in blue), which could pose a challenge for further upward movement.
Additionally, the price has entered the $355–$375 range—a zone that previously triggered significant reversals (as indicated by arrows). Notably, there was a sharp decline from this zone between February 21–26. From a bearish standpoint, this area could act as resistance, and the candle’s close near its low yesterday supports this view.
From a bullish perspective, the fundamental outlook may still provide upward momentum:
→ A joint press conference with Trump and Musk is scheduled for today;
→ In early June, Tesla is expected to begin testing its autonomous taxis.
So, while a continued uptrend is possible, a short-term correction would seem reasonable after TSLA’s nearly 27% surge throughout May.
This article represents the opinion of the Companies operating under the FXOpen brand only. It is not to be construed as an offer, solicitation, or recommendation with respect to products and services provided by the Companies operating under the FXOpen brand, nor is it to be considered financial advice.

Tesla (TSLA) Shares Rebound on Musk’s CommentsTesla (TSLA) Shares Rebound on Musk’s Comments
According to media reports, speaking via video link at the Qatar Economic Forum, Elon Musk stated that he plans to:
→ remain Tesla’s CEO for another five years;
→ reduce his focus on politics, saying he feels he has already done enough;
→ increase his stake in the company from 12.5% to 25%.
These comments, which came alongside news that Tesla will begin testing robotaxis in Texas in June, sparked renewed interest in Tesla (TSLA) shares. TSLA stock outperformed other MAG7 members, climbing above the $353 mark at yesterday’s peak — its highest level since late February 2025.
Just ten days ago, when the price was still below the psychological $300 level, we highlighted TSLA’s strength following its rebound from the $220 support area and suggested a bullish outlook. But is the picture still as optimistic today?
Technical Analysis of TSLA Chart
The chart shows that TSLA is trading within an ascending channel (highlighted in blue), with the price currently near the upper boundary — an area that often acts as resistance. Price action supports this: note the two large candlesticks with closes near their lows (indicated by arrows), suggesting strong bearish pressure.
This gives reason to believe that sellers may take advantage of the roughly 22% rise in the TSLA stock price to lock in profits — a potentially bearish signal. Traders should therefore consider a correction scenario in which the local support at point Q could be tested for resilience.
This article represents the opinion of the Companies operating under the FXOpen brand only. It is not to be construed as an offer, solicitation, or recommendation with respect to products and services provided by the Companies operating under the FXOpen brand, nor is it to be considered financial advice.

$TSLA Weekly Chart Analysis🚀 NASDAQ:TSLA Weekly Chart Analysis
🔹 Strong Momentum: Launching off the volume shelf and cruising with the market’s bullish energy.
🔹 Room to Run: Approaching the red barrier, but not there yet—still has upside before a pullback.
🔹 Healthy RSI: Sitting at 56.60, meaning plenty of room for further gains.
🔹 Catalyst Ahead: Robotaxi event incoming! (Sell the news? You bought the rumor. 🤔)
🔹 Key Resistance: Watch levels at $350–$400.
Stay sharp—let’s see if TSLA keeps charging forward! ⚡📈

Tesla Shares (TSLA) Hit Two-Month HighTesla Shares (TSLA) Hit Two-Month High
During Friday’s trading session, Tesla shares briefly rose above the $300 mark — the first time in over two months. Although the daily candle closed below this key psychological level, TSLA still outperformed the broader stock market.
This move was supported by:
→ Investor approval of Elon Musk’s late-April pledge to spend less time on the Department of Government Efficiency (DOGE) and focus more on his role at the company.
→ A recent announcement from the Trump administration regarding a trade deal with the UK, alongside hints that more agreements may follow — potentially alluding to US-China negotiations.
Technical Analysis of TSLA Shares
In our previous analysis of TSLA’s stock price, we:
→ Highlighted the key support level around $220, which prevented deeper declines in early April even as broader indices saw more bearish trends;
→ Identified a descending channel (marked in red).
This channel remains relevant for now, but the price has already approached its upper boundary. It’s reasonable to assume that this level could act as resistance — similar to the midline of the channel (as indicated by arrows) — especially when reinforced by the psychological $300 level.
However, bulls may find strong support from any further details on a US-China trade deal (as discussed earlier today). A bullish breakout of the red channel in the coming days cannot be ruled out, potentially confirming the relative strength of TSLA stock and extending the trajectory marked by the blue lines.
This article represents the opinion of the Companies operating under the FXOpen brand only. It is not to be construed as an offer, solicitation, or recommendation with respect to products and services provided by the Companies operating under the FXOpen brand, nor is it to be considered financial advice.

Tesla: More Room in Wave 4With the recent increases, TSLA approached the more significant local high from early April. Although we locate the price in a turquoise downtrend impulse, the internal corrective upward move of wave 4 still has some more room. With the following wave 5, the stock should then fall below the support at $215.01 to complete the magenta wave (3), which is also part of a downtrend impulse. Meanwhile, our alternative scenario suggests a much faster progression. We consider it 27% likely that with the low on April 7, the blue wave alt.(II) and thus the major corrective movement have already ended. In this case, the path would be clear for a new uptrend of the blue wave alt.(III), which would lead to increases above the resistance at $488.50. Primarily, however, we expect the corrective movement to conclude at a later time and at lower levels.

TSLA Potential Post Tariff Resolution Bullish RallyDespite uncertainty still looming over the current global tariff based environment, TSLA price still seems to exhibit signs of a potential Bullish breakout as the price action may form a prominent Higher Low on the longer timeframes with multiple confluences through key Fibonacci and Support levels which presents us with a potential Non-Leverage hold opportunity.
Entry: CMP 292
Stop Loss: 90 or 0 (depends on trading style as Non-Leverage Buy & Hold is recommended)
Potential Range for Targets: 470 - 550

Tesla Suspends Guidance: Why Its Forecasts Were Often WrongTesla Pulls the Plug on Guidance: Why Its Forecasts Weren't Worth Much Anyway
Tesla, the electric vehicle behemoth that has captivated and often confounded investors for over a decade, has made another move guaranteed to stir debate: it's suspending its forward-looking guidance. For many companies, withdrawing financial forecasts signals significant uncertainty or a major strategic shift, often sending shares tumbling. While Tesla's stock undoubtedly reacts to such news, a deeper look reveals a compelling argument: Tesla's official guidance, particularly in recent years, had become such a moving target, so frequently untethered from eventual reality, that its predictive value was already deeply questionable. Suspending it might simply be acknowledging the obvious.
For years, Tesla's earnings calls and investor communications were punctuated by ambitious, often audacious, targets set by CEO Elon Musk and the company. These weren't just vague aspirations; they were often specific numbers for vehicle deliveries, production ramps, timelines for new technologies like Full Self-Driving (FSD), and launch dates for anticipated models like the Cybertruck or the Semi. The market, enthralled by Tesla's disruptive potential and Musk's charismatic pronouncements, frequently hung on these words, baking them into valuation models and trading strategies.
However, the history of Tesla meeting these self-imposed targets is, charitably speaking, inconsistent. The guidance often veered into the quixotic, reflecting a potent blend of extreme optimism, engineering ambition, and perhaps a dash of Musk's famed "reality distortion field."
Consider the infamous "production hell" of the Model 3 ramp-up. Initial targets were wildly optimistic, projecting volumes that the company struggled immensely to achieve, facing bottlenecks in battery production and assembly line automation. While Tesla eventually overcame these hurdles, the timeline and cost deviated significantly from early guidance. Similarly, the promise of Full Self-Driving has been a perennial "next year" phenomenon. While the capabilities of Tesla's Autopilot and FSD Beta have advanced significantly, the arrival of true Level 4 or 5 autonomy, capable of operating without driver supervision under virtually all conditions – as often implied by the timelines suggested in guidance – remains elusive, years behind schedules hinted at in past forecasts.
The Cybertruck provides another stark example. Unveiled in 2019 with a projected start date that came and went multiple times, its eventual, limited launch in late 2023 was years behind schedule, and scaling its unique manufacturing process remains a challenge. Guidance around its ramp-up has been adjusted repeatedly.
This pattern isn't necessarily born from deliberate deception, but rather from a confluence of factors inherent to Tesla's DNA and the volatile industries it operates in:
1. Aggressive Goal Setting: Musk is known for setting incredibly ambitious "stretch goals" intended to motivate teams to achieve breakthroughs. While effective internally, translating these aspirational targets directly into public financial guidance is fraught with risk.
2. Underestimation of Complexity: Bringing revolutionary products to mass market – whether it's a new vehicle platform, a complex software suite like FSD, or novel battery technology – involves navigating unforeseen engineering, manufacturing, supply chain, and regulatory hurdles. Initial guidance often seemed to underestimate these complexities.
3. Market Volatility: The EV market itself is dynamic. Consumer demand shifts, government incentives change, raw material costs fluctuate, and competition intensifies – all factors that can derail even well-laid plans and render guidance obsolete.
4. The "Musk Factor": Elon Musk's public statements, sometimes made spontaneously on social media or during earnings calls, often became de facto guidance, even if not formally enshrined. His optimism could inflate expectations beyond what the operational side of the business could reliably deliver on a set schedule.
Given this history, why did the market continue to pay such close attention? Part of it was the sheer scale of Tesla's ambition and its undeniable success in revolutionizing the automotive industry. Investors betting on disruption were often willing to overlook missed targets, focusing instead on the long-term vision. Past stock performance also created a feedback loop; as the stock soared despite missed guidance, it reinforced the idea that the specific numbers mattered less than the overall trajectory and narrative. Guidance served as a signal of intent and ambition, even if the execution timeline slipped.
However, the context has shifted dramatically. Tesla is no longer the lone wolf in a nascent EV market. Competition is fierce, particularly from Chinese automakers like BYD, but also from legacy manufacturers finally hitting their stride with compelling EV offerings. Global EV demand growth, while still present, has slowed from its previously exponential pace. Tesla itself has engaged in significant price cuts globally to maintain volume, putting pressure on its once-stellar automotive margins.
In this more challenging environment, the luxury of consistently missing ambitious targets wears thin. The decision to suspend guidance now can be interpreted in several ways:
• Pragmatic Realism: Management may genuinely lack visibility into near-term demand, production capabilities (especially with new models or processes), or the impact of macroeconomic factors. Suspending guidance is arguably more responsible than issuing forecasts they have low confidence in.
• Strategic Pivot: Tesla is increasingly emphasizing its future potential in AI, robotics (Optimus), and autonomous ride-sharing (Robotaxi). These ventures have even longer and more uncertain development timelines than vehicle production. Focusing investor attention away from quarterly delivery numbers might be part of a strategy to reframe the company's narrative around these future bets.
• Avoiding Accountability: A more cynical take is that suspending guidance removes a key benchmark against which management's performance can be judged, particularly during a period of slowing growth and heightened competition.
Regardless of the primary motivation, the practical implication for investors is clear: the already thin reed of Tesla's official guidance is now gone entirely. This forces a greater reliance on analyzing tangible results – actual deliveries, reported margins, cash flow generation, progress on FSD adoption rates, and demonstrable advancements in new ventures – rather than promises of future performance.
The suspension underscores that investing in Tesla requires a strong belief in its long-term vision and its ability to execute on extremely complex technological and manufacturing challenges, often without a clear, company-provided roadmap for the immediate future. The focus must shift from parsing guidance to meticulously evaluating performance, competitive positioning, and the plausibility of its next-generation bets.
In conclusion, Tesla's decision to stop issuing formal guidance is less of a shockwave and more of a formal acknowledgment of a long-standing reality. Its forecasts were often more aspirational than operational, reflecting a culture of ambitious goal-setting within a highly volatile industry. While the absence of guidance introduces a new layer of uncertainty, savvy investors likely already applied a significant discount factor to Tesla's projections. The company's future success now hinges more transparently than ever not on what it promises for tomorrow, but on what it demonstrably delivers today. The quixotic forecasts may be gone, but the fundamental challenge of execution remains.

Tesla Stock: Neutral Bias Persists Following Earnings ReportTesla’s stock is currently hovering near the $250 level, after a bullish gap formed following the release of its latest earnings report. Initially, the company's results fell short of expectations: earnings per share came in at $0.27 versus the expected $0.39, and total revenue reached $19.3 billion versus $21.11 billion anticipated by the market. Despite this, the stock's initial reaction was a bullish gap, fueled by brief, fleeting optimism, but the session ultimately closed with a notable indecision candle, casting some doubt on whether a new short-term uptrend is truly beginning.
Bearish Channel Remains in Play:
Despite the recent upward jump in the latest session, buying momentum has so far failed to break through the upper boundary of the descending channel that has persisted since late December. For now, this bearish channel remains the most important formation to monitor, based on recent price behavior.
MACD:
The MACD histogram is currently oscillating close to the neutral zero line, indicating that the average strength of the recent moving average swings remains largely neutral. If this behavior continues, the market may lack a clear short-term trend.
ADX:
The ADX indicator is showing a similar setup. The line continues to hover around the 20 level, which typically signals indecision in the market. This reflects a neutral tone in the current price movement, suggesting that a lack of momentum is driving a series of directionless swings. Unless the ADX line starts to rise steadily, a neutral bias may continue to dominate the stock in the short term.
Key Levels:
$220 – Key Support: This level marks the lowest point in recent months. A break below this support could reactivate the bearish channel that has defined short-term price action.
$290 – Technical Barrier: Aligned with the 200-period simple moving average, a bullish breakout above this level could pose a serious threat to the current bearish trend channel.
$330 – Final Resistance: This level is aligned with the 100-period simple moving average. If the stock reaches this area, it could confirm a shift in market momentum and pave the way for a more sustained bullish trend on the chart.
Written by Julian Pineda, CFA – Market Analyst

Tesla Shares (TSLA) Drop Nearly 6% Ahead of Quarterly ReportTesla Shares (TSLA) Drop Nearly 6% Ahead of Quarterly Report
On Monday, Tesla’s share price fell by almost 6%, dipping below $230 and hovering near its yearly low. Since the beginning of 2025, Tesla shares have lost approximately 44% in value, marking their worst quarter since 2022.
Why Is TSLA Falling?
There is no shortage of investor concerns, including (as reported by various media outlets):
→ Elon Musk’s involvement with the Trump administration, which is said to be distracting him from focusing on Tesla, particularly as signs emerge of slowing progress in the development of robotaxis and autonomous driving technology.
→ A decline in demand — both for the Cybertruck model specifically and the product line in general — especially amid protests and boycotts across the US and Europe. Tesla previously reported 336,681 vehicle deliveries in Q1, down 13% compared to the same period last year.
→ Increased competition from Chinese carmakers, uncertainty around international trade tariffs, and other contributing factors.
According to The Wall Street Journal, analysts at Barclays and Oppenheimer have voiced concerns about “brand dilution” and weakness in China, while Dan Ives of Wedbush is hopeful for an “inspirational vision” from Elon Musk.
Technical Analysis of TSLA Stock
We previously noted the importance of the $220 support level, which prevented the price from falling further during the first half of April (as indicated by the arrow), at a time when broader stock indices showed much more bearish trends.
That level still appears relevant for now, but it’s likely that the upcoming quarterly earnings report will trigger a sharp increase in volatility. Should investors find the results underwhelming, TSLA’s share price could fall to the lower boundary of the current descending channel (highlighted in red), potentially breaching the psychological $200-per-share mark.
This article represents the opinion of the Companies operating under the FXOpen brand only. It is not to be construed as an offer, solicitation, or recommendation with respect to products and services provided by the Companies operating under the FXOpen brand, nor is it to be considered financial advice.

TSLA Weekly Options Trade Plan 2025-04-17TSLA Weekly Analysis Summary (2025-04-17)
Below is an integrated analysis of the reports and market data:
──────────────────────────────
MODEL REPORTS – KEY POINTS
• Grok/xAI – Price and moving averages on both 5‑min and daily charts are below key EMAs; RSI and MACD point to current bearish momentum. – Notable technical support at about 239.75 with resistance above near 242. – The options chain shows heavy put activity at the $240 strike (premium about 0.67), and max pain is at 245, although that level is less relevant for a near‐term (0DTE) trade. – Recommendation: Trade the TSLA $240 PUT at an ask of 0.67 at the open, aiming for roughly a 100% gain and using about a 50% loss as a stop.
• Gemini/Google – Technicals on short‐term and daily timeframes are mixed: the daily chart is clearly bearish while some 5‑min indicators hint at stabilization. – Conflicting signals (including the max pain pull toward 245 and falling VIX) result in not having a high‑conviction directional bias. – Conclusion: “No trade” is recommended today because the conflicting indicators raise the risk of getting whipsawed.
• Claude/Anthropic – Technical analysis on both 5‑min and daily confirms a moderately bearish bias (price well below major EMAs, RSI below 50). – However, one suggested trade was a TSLA $237.50 PUT at an extremely low premium (0.13) which seems less attractive given the preferred premium range. – In essence, the model sees downside potential but selected a strike a bit further out from the current price.
• Llama/Meta – A moderately bearish setup is noted, with the technical picture similar to the others on very short‐term charts. – However, the model also flags the influence of max pain at 245 and concludes that a naked call (for example, at the $240 or $242.50 strike) could profit if the upward “max pain pull” works in play. – Ultimately, this view contrasts with the put trades favored by others.
• DeepSeek – Confirms the overall technical picture: price is below key averages, with bearish momentum evident on both 5‑min and daily charts. – Emphasizes the high open interest on $240 puts and the near-term support at 239.75. – Recommends buying the TSLA $240 PUT at its 0.67 ask price for this weekly (0DTE) option. ────────────────────────────── 2. AREAS OF AGREEMENT AND DISAGREEMENT
Agreements: – Most reports note that TSLA is trading in a moderately bearish state with price below the relevant moving averages and key support levels near 239.75. – There is broad recognition that options activity is concentrated around the $240 strike—especially on the put side, where volume and open interest are very high, underscoring bearish positioning. – Technical indicators (RSI, MACD, Bollinger Bands) on short‑term and daily charts lean toward bearishness despite some very short‑term signals of stabilization.
Disagreements: – Gemini/Google sees too many conflicting signals (including the upward pull implied by max pain) and hence recommends no trade, while the majority of the other analysts view the setup as tradeable. – Llama/Meta is open to trading a naked call (capitalizing on the max pain influence) whereas Grok/xAI, DeepSeek, and to a lesser degree Claude/Anthropic advocate for a bearish put trade instead. ────────────────────────────── 3. CONCLUSION & TRADE RECOMMENDATION
Overall Market Direction Consensus: Most opinions point to a moderately bearish bias for TSLA on a near-term, 0DTE weekly horizon. Even though conflicting signals (like max pain toward 245 and some stabilization on very short timeframes) introduce uncertainty, the weight of the technicals and put side open interest lean toward downside pressure.
Recommended Trade: Trade a single‑leg, naked PUT (weekly option) on TSLA.
Trade Parameters: – Instrument: TSLA – Strategy: Buy a TSLA $240 PUT – Expiration: 2025‑04‑17 (weekly, 0DTE) – Premium: Approximately $0.67 per contract (slightly above the preferred range, but justified by high liquidity and clear technical support) – Entry Timing: At the open – Profit Target: Around 100% gain from the entry premium (i.e. exit near a $1.34 premium) – Stop‑Loss: Roughly a 50% loss at about $0.33 per contract – Confidence Level: Approximately 65% – Key Risks & Considerations: • The mixed signals (especially Gemini’s caution and the max pain theory) mean price could quickly reverse if TSLA rebounds near 245. • Very short‑term trading (0DTE) carries risks related to rapid time decay and volatility spikes. • A failure to break important support (around 239.75) would warrant an early exit. ────────────────────────────── 4. TRADE_DETAILS (JSON Format)
{ "instrument": "TSLA", "direction": "put", "strike": 240.0, "expiry": "2025-04-17", "confidence": 0.65, "profit_target": 1.34, "stop_loss": 0.33, "size": 1, "entry_price": 0.67, "entry_timing": "open" }
Disclaimer: This newsletter is not trading or investment advice but for general informational purposes only. This newsletter represents my personal opinions based on proprietary research which I am sharing publicly as my personal blog. Futures, stocks, and options trading of any kind involves a lot of risk. No guarantee of any profit whatsoever is made. In fact, you may lose everything you have. So be very careful. I guarantee no profit whatsoever, You assume the entire cost and risk of any trading or investing activities you choose to undertake. You are solely responsible for making your own investment decisions. Owners/authors of this newsletter, its representatives, its principals, its moderators, and its members, are NOT registered as securities broker-dealers or investment advisors either with the U.S. Securities and Exchange Commission, CFTC, or with any other securities/regulatory authority. Consult with a registered investment advisor, broker-dealer, and/or financial advisor. By reading and using this newsletter or any of my publications, you are agreeing to these terms. Any screenshots used here are courtesy of TradingView. I am just an end user with no affiliations with them. Information and quotes shared in this blog can be 100% wrong. Markets are risky and can go to 0 at any time. Furthermore, you will not share or copy any content in this blog as it is the authors' IP. By reading this blog, you accept these terms of conditions and acknowledge I am sharing this blog as my personal trading journal, nothing more.


Tesla (TSLA) Shares Jump Approximately 22% in a Single DayTesla (TSLA) Shares Jump Approximately 22% in a Single Day
Tesla was among the standout performers in the stock market rally that followed President Trump’s decision to delay, by 90 days, the implementation of new international trade tariffs — with the notable exception of China. According to the charts, Tesla (TSLA) shares surged by approximately 22%.
Why Did TSLA Shares Soar?
Some insight comes from Cathie Wood, CEO of asset management firm ARK Invest.
In an interview with Barron’s on Wednesday, she noted the following:
→ Tesla plans to launch a new, more affordable vehicle this quarter, likely priced at around $30,000 — roughly half the cost of the base Model Y.
→ The upcoming release of Tesla’s robotaxi service could also lower the need for large upfront vehicle purchases, offering consumers a more economical alternative.
→ Tesla sources more components from North America than most other US carmakers, meaning it is less exposed to tariff-related costs.
And there’s another reason TSLA may have jumped — one that can be found in the chart.
Technical Analysis of TSLA
Take note: the March and April lows (marked with arrows) are both around the $220 level. Meanwhile, the S&P 500 (US SPX 500 mini on FXOpen) posted a significantly lower low in April compared to March. This suggests that, in early April, TSLA was outperforming the broader market. Why?
One possible explanation is that there has been — and perhaps still is — a strong accumulation interest in TSLA. Buyers may have been quietly scooping up available shares amid recession fears. When yesterday’s news suddenly shifted market sentiment, the “spring” uncoiled, catapulting TSLA’s share price upward.
However, the overall downtrend remains intact. If bullish momentum continues, the price may encounter resistance around the psychologically significant $300 level — which coincides with the upper boundary of the downward channel.
This article represents the opinion of the Companies operating under the FXOpen brand only. It is not to be construed as an offer, solicitation, or recommendation with respect to products and services provided by the Companies operating under the FXOpen brand, nor is it to be considered financial advice.

TESLA Always Pay YOURSELF! Tsla Stock were you PAID? GOLD Lesson
⭐️I want to go into depth regarding the this topic but it is a long one with PROS & CONS for doing and not doing it.
Every trader must choose what's best for them but you will SEE when I finally get to the write up that MANY OF THE PROS are NOT FINANCIAL but PSYCHOLOGICAL❗️
Another of 🟢SeekingPips🟢 KEY RULES!
⚠️ Always Pay YOURSELF.⚠️
I know some of you chose to HOLD ONTO EVERYTHING and place your STOP at the base of the WEEKLY CANDLE we entered on or the week priors base.
If you did that and it was in your plan GREAT but... if it was NOT that is a TRADING MISTAKE and You need to UPDATE YOUR JOURNAL NOW.
You need to note EVERYTHING. What you wanted to see before your exit, explain why not taking anything was justified to you, were there EARLY exit signals that you did not act on. EVERYTHING.
🟢SeekingPips🟢 ALWAYS SAYS THE BEST TRADING BOOK YOU WILL EVER READ WILL BE YOUR COMPLETE & HONEST TRADING JOURNAL ⚠️
📉When you read it in black amd white you will have YOUR OWN RECORD of your BEST trades and TRADING TRIUMPHS and your WORST TRADES and TRADING ERRORS.📈
✅️ KEEPING an UPTO DATE JOURNAL is STEP ONE.
STUDYING IT IS JUST AS IMPORTANT👍
⭐️🌟⭐️🌟⭐️A sneak peek of the LESSON after will be HOW & WHEN TO ENTER WHEN THE OPEN BAR IS GOING THE OPPOSITE WAY OF YOUR IDEA.👌
🚥Looking at the TESLA CHART ABOVE you will see that we were interested in being a BUYER when the weekly bar was BEARISH (GREEN ARROW) and we started to consider TAKE PROFITS and EXITS when the (RED ARROW) Weekly bar was still BULLISH.🚥

Tsla Lesson Tesla Stock Always Pay YOURSELFI say this time and time again and this is a PRIME EXAMPLE SO FAR.
🌍Now I suggested THAT IF YOU WERE A TESLA BULL that you might want to start to PAY ATTENTION TO THE STOCK TWO WEEKS AGO.
❓️"OK SO WHAT'S THE LESSON"❓️
I emphasise ALWAYS that TIME TRUMPS PRICE...
TESLA has been rather docile since its initial POP.
But take a look at the HIGHER TIMEFRAME WEEKLY CHART❗️
Whats clear to see is that although the PRICE RANGE hasn't been MASSIVE there has been plenty OF ⏳️TIME TO CAPITALISE AND PAY YOURSELF. £$€¥ 💰
Two 📈HIGHER CLOSES ON THE WEEKLY and the call made whilst the weekly looked EXTREMELY BEARISH📉
EVEN RIGHT NOW we are currently UP ON THE WEEK UNTIL NOW.
ℹ️ If you WERE UNABLE to STRUCTURE A TRADE TO TAKE advantage of this PRICE RANGE whilst DAY TRADING you may need to LOOK BACK and STUDY WHY NOT.
⚠️You could have paid yourself several times over already and even if TESLA was to seek lower prices from here you SHOULD HAVE BACKED SOMETHING ALREADY.
✅️AS ALWAYS TRADE YOUR PLAN & WAIT FOR YOU SIGNAL✅️


TESLA Market Outlook: Strong Reversal Expected at $200 SupportNASDAQ:TSLA is currently trading within a well-defined ascending channel , a structure that has guided price action since 2020. This channel reflects the broader bullish trend, with higher highs and higher lows consistently forming over the years. The recent sharp decline from the upper boundary of the channel is best interpreted as a temporary retracement rather than a structural shift. Such pullbacks have presented strong buying opportunities before, particularly when price approaches key support levels within the channel. The key area to watch is the $200 demand zone. This level coincides with the lower boundary of the ascending channel and has before drawn significant buying interest.
Given the broader bullish structure, a reversal from this zone could reestablish the uptrend and lead to a retest of higher levels. If a bounce occurs at the $200 demand zone, the immediate target is $263, which aligns with a key resistance level where prior rejection occurred. This area represents a logical point to watch for, but a successful breakout above $263 could lead to further move toward the upper boundary of the channel.
Fundamental Outlook:
From a fundamental perspective, the recent decline could be due to Tesla facing a unique set of challenges stemming from Elon Musk’s increasing involvement in the U.S. government. His role in the Department of Government Efficiency (DOGE) under the Trump administration has triggered mixed reactions across the financial landscape. The DOGE program, aimed at cutting bureaucratic waste and enhancing operational efficiency, has led to concerns about Musk’s ability to maintain focus on Tesla. Some investors do worry that his attention, divided among a few ventures such as Tesla, SpaceX, and also the federal program, might slow the company’s innovation pipeline in addition to running efficiency.
People are quite divided in their opinions. While some view Musk’s governmental involvement as a strategic advantage, believing his influence could drive favorable policy outcomes, others see it as a distraction that threatens Tesla’s future success. Additionally, if the DOGE program prompts budgetary austerity measures, there could be cuts to clean energy incentives, an outcome that would directly impact Tesla’s profits directly.
Despite these concerns, the market’s long-term outlook for Tesla remains bullish. Many investors view any significant retracement as a buying opportunity, particularly near major technical support zones like $200. This area is widely recognized as a strong accumulation zone where institutional buyers are likely to step in. Furthermore, the electric vehicle market continues to expand globally, and Tesla’s brand strength and technological lead remain intact, reinforcing the long-term growth narrative.
Market View & Predictions
While short-term volatility is expected due to ongoing uncertainties surrounding Musk’s government involvement, the broader technical structure suggests that the uptrend is still intact.
The recent pullback from the upper channel boundary appears to be a healthy correction rather than a trend reversal. If the price tests the $200 support zone, it could trigger a new wave of buying pressure, potentially driving the stock back toward the $263 resistance and beyond. As long as the price remains within the ascending channel, the bullish case for Tesla remains valid, with the potential for further upside as market confidence stabilizes.

SeekingPips sees TSLS Tesla GAIN $60 ! What's Next?It's hard for many traders to do. 🤔
⭐️ I still see it today with traders and investors alike. Even with some who have been at it for many years...
BUT some of the BEST ENTRIES & EXITS for me have been when the OPEN CANDLE IS COMPLETELY AGAINST ME.
The LAST WEEKLY TESLA chart that I shared is another prime example of this.
🟢SeekingPips🟢 shared a BULLISH BIAS when the WEEKLY CHART was looking as BEARISH as hell. 🔥
ℹ️ Now it really is not a method that works for everyone.
Trading against momentum always looks SCARY BUT the SECRET is MULTI TIMEFRAME ANALYSIS and also being able to...
VISUALISE DIFFERENT OBSCURE TIMEFRAMES IN REAL-TIME USING THE CURRENT OPEN CHART.
⚠️I plan on going DEEPER INTO this rabbit hole with some information and examples in the TUTORIAL SECTIONS soon.⚠️
🚥 In it's simplest terms an example would be beaing able to note where price is on a 20 or 10 min chart just only by having a 5 minute chart in front of you.
By being able to do so in REAL-TIME KEY LEVELS POP OUT that you may not have noticed from the 5 minute chart perspective only.💡💡💡
Now 🟢SeekingPips🟢 has to wait for a TRIGGER for a NEW ENTRY & SO SHOULD YOU.👍👌👍
