TESLA 20TH AUGUST 2025price action for Tesla is here. I have clearly explained my plan on how to trade tesla considering every factor in market.
NOTE: OPTION WILL BURN YOUR CAPITAL
Teslamotors

TSLA (Tesla) LONG SET UPEntry Price 1: $324.00
Entry Price 2: $314.00
Stop Loss: $294.00
Take Profit 1: $340.00 (Close 25%)
Take Profit 2: $354.00 (Close 50%)
Take Profit 3: $368.00 (Close 75%)
Take Profit 4: $384.00 (Close 100%)

Tesla - The triangle is still valid!🚔Tesla ( NASDAQ:TSLA ) remains totally bullish:
🔎Analysis summary:
If we look at the chart of Tesla, we can see a very long term consolidation over the past four years. This, however, does not mean that the bullrun is over but rather preparing for the next bullish move. We just have to wait for the bullish ascending triangle pattern breakout.
📝Levels to watch:
$400
SwingTraderPhil
SwingTrading.Simplified. | Investing.Simplified. | #LONGTERMVISION

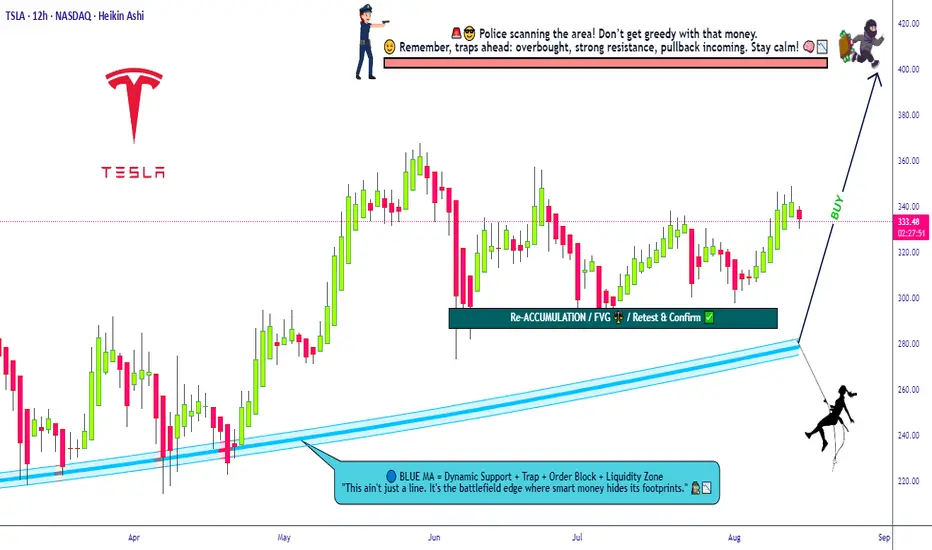
Bullish Tesla Mission Activated – Grab the Loot Now!💎🚨 TESLA STOCK MARKET HEIST PLAN 🚨💎
🕵️♂️ Attention All Thief OG’s, Chart Ninjas & Wall Street Pickpockets!
We’re gearing up for a full-blown Tesla loot mission — bullish, layered, and locked on target! 📈💰
🎯 Plan:
Bullish Layered Entry Strategy 🤑
We’re stacking multiple BUY LIMIT layers like a pro bank job:
💵 (330.00) | 💵 (320.00) | 💵 (310.00) | 💵 (300.00)
(You can add more layers if you want to steal bigger)
🛑 Stop Loss:
The Thief’s SL @ 280.00 💣
📌 Adjust to your own risk — every crew member knows their escape route!
Remember: A good thief never leaves fingerprints, only profits.
🏆 Target:
🚓 Police barricade at 420.00 — better vanish before the sirens!
🎯 Secure the main loot at 400.00 before making a clean getaway.
💡 Thief Strategy Tip:
Layering lets you grab more loot if price dips — like breaking into multiple vaults.
Keep your disguise on and watch the charts — Wall Street guards are always watching. 👀🖤
⚠️ Warning for the Crew:
Major news drops = cops on every corner.
Stay hidden, trail your stops, and protect the stash.
💥 Smash the ❤️ LIKE button if you’re in for this Tesla mission!
📌 Follow the crew for more Thief Trader blueprints — next heist drops soon!
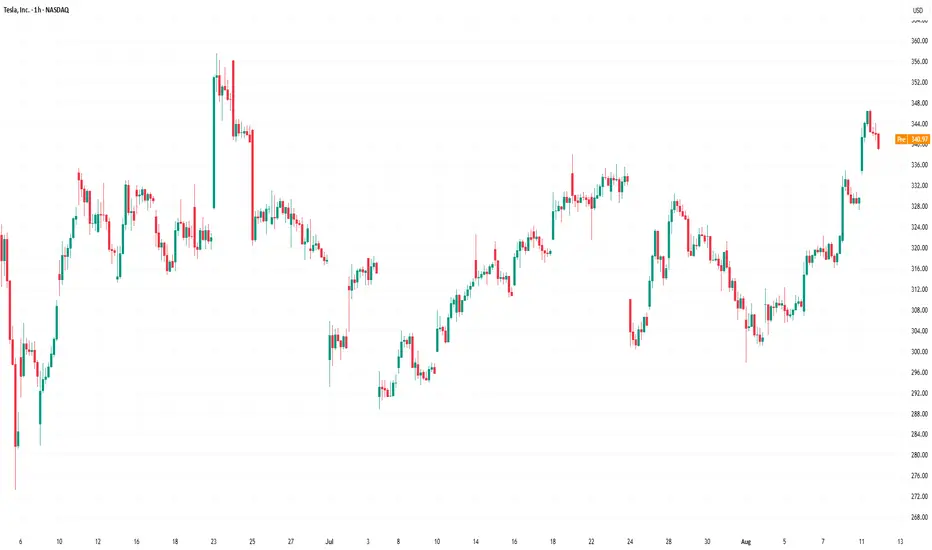
Tesla (TSLA) Shares Break Above July HighTesla (TSLA) Shares Break Above July High
As the chart indicates, Tesla (TSLA) stock is demonstrating a pronounced upward trend. Specifically, its price:
→ has risen for four consecutive days;
→ has moved above its July high;
→ has gained over 10% since the start of August.
Why Is TSLA Rising?
Among other factors, TSLA’s share price is being driven by:
→ News that Tesla has extended the estimated delivery time for the Model Y from one–three weeks to four–six weeks (according to Barron’s). This may signal an increase in orders, boosting market optimism after the first two quarters showed a notable decline in electric vehicle sales.
→ Statements from Elon Musk regarding the development of the robotaxi project. According to him, Tesla’s robotaxi service will be publicly available next month. Musk also noted that Tesla has achieved several additional breakthroughs in artificial intelligence that will make car control remarkably similar to that of a human driver.
Can TSLA continue to rise?
Technical Analysis of TSLA Stock
When analysing the TSLA chart on 24 July, we identified a broadening triangle pattern with its axis around $317. Since then:
→ the price tested the lower boundary of the triangle and reversed upwards (as indicated by the arrow);
→ importantly, it broke through the upper boundary. This was made possible by the improvement in the fundamental backdrop (as reflected in the news), leading to a shift in market sentiment in favour of buyers.
Yesterday, the NASDAQ recorded the highest trading volume in August, with the daily candle closing below its midpoint – a sign of increased seller activity, further confirmed by the most recent long bearish candle on the hourly chart.
Given the above (as well as the RSI indicator approaching overbought levels), we could assume that TSLA’s share price could see a short-term correction following its rally in early August. Should the market follow this scenario, the price could pull back to the area highlighted in purple, which represents a significant support level, as it lies close to:
→ the upper boundary of the triangle (former resistance);
→ the lower boundary of the ascending channel (shown in blue);
→ the 50% retracement level of the A→B impulse;
→ price zones of strong upward movement (a bullish imbalance zone, as described by the Fair Value Gap pattern of the Smart Money Concept methodology).
This article represents the opinion of the Companies operating under the FXOpen brand only. It is not to be construed as an offer, solicitation, or recommendation with respect to products and services provided by the Companies operating under the FXOpen brand, nor is it to be considered financial advice.
TESAL HEADING TO $500+ RANGE ANALYSIS HERE Afternoon Trading Fam
So here is our in-depth look at Tesla: Currently the monthly trend is bullish giving us levels of $500 and above.
Locally though we can break this $338 top expect to see $444 and $480 getting hit next
If we need to correct and we break the lows of $319 expect to see the levels of $307 then $301 being hit
Happy Trading
Trade Smarter Live Better
Kris

Tesla - The all time high breakout!🚗Tesla ( NASDAQ:TSLA ) will break out soon:
🔎Analysis summary:
For the past five years Tesla has overall been consolidating between support and resistance. But following the recent bullish break and retest, bulls are slowly taking over control. It is actually quite likely that Tesla will soon break above the previous all time highs.
📝Levels to watch:
$400
🙏🏻#LONGTERMVISION
SwingTraderPhil

TESLA ANALYSIS CAN WE HIT 380? Evening everyone
Here is the analysis on Tesla currently:
Thesis For Bullish: If we break the highs of 336 then we can hit levels of 380 or higher
Thesis for Bearish: If we break the low at 298 then a drop down to 291 then 275 makes sense
Trade Smarter Live Better
Kris/Mindbloome Exchange

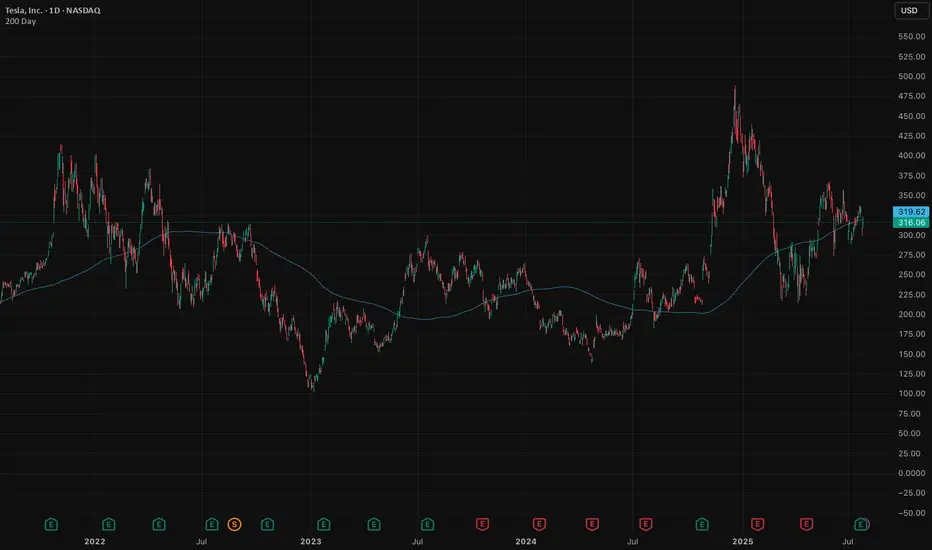
Tesla in the waiting room as revenue slidesTesla is a global innovator that is changing the world. As a general rule, many investors have a saying: Never bet against Elon. They're not wrong. Elon delivers. But the short term is messy.
The stock is hovering around its 200-day moving average, a critical test. Break lower and we could see $290, maybe $260. That’s not panic, it's just price catching up to reality.
The auto business is deep in a downcycle. Q2 deliveries fell 14%, with revenue down 12%. Profits squeezed. Classic cyclical move. Nothing new here. But it’s weighing on momentum.
The upside isn’t about cars, it's autonomy, robotaxis, AI (Grok in cars). That’s where Tesla becomes a $2 trillion company. Musk knows it and is building for the future (100,000 GPU super cluster). He’s already shifting the story.
But that future is 6–12 months out, maybe longer.
In the meantime, we sit in the waiting room. Auto volumes need to stabilise. Robotaxi needs scale. Optimus requires proof and some definitive timeframes to get the market excited. That creates a 3–6 month narrative gap. Markets hate gaps.
Earnings last week were among the softest (though expected). EPS fell 23%. Free cash flow almost vanished. No real catalysts until next quarter. If the broader market sells off, which looks likely, Tesla takes more heat.
But let’s not lose the plot. Tesla is still Tesla. Long-term vision remains. Musk’s execution record is unmatched. Bet against him and you lose, eventually.
Short term, expect weakness. Patience required. If the stock breaks $315 with conviction, we’d expect further weakness before the real upside re-emerges.
Wait, watch, then pounce.
The forecasts provided herein are intended for informational purposes only and should not be construed as guarantees of future performance. This is an example only to enhance a consumer's understanding of the strategy being described above and is not to be taken as Blueberry Markets providing personal advice.
TESLA POST EARNING 24 JULY 2025This is Post earning analysis for Tesla . I have clearly explained all the levels. Please trade carefully & try to stick to your plan.
NOTE: FOLLOW THE LEVELS

Tesla Shares (TSLA) Drop Following Earnings ReportTesla Shares (TSLA) Drop Following Earnings Report
Yesterday, after the close of the main trading session on the stock market, Tesla released its quarterly earnings report. While both earnings per share (EPS) and gross profit slightly exceeded analysts’ expectations, the results reflected a negative trend driven by declining sales. This decline is being influenced by intensifying competition from Chinese EV manufacturers as well as Elon Musk’s political activity.
According to Elon Musk:
→ The company is facing “a few tough quarters” due to the withdrawal of electric vehicle incentives in the US;
→ The more affordable Tesla model (mass production expected in the second half of 2025) will resemble the Model Y;
→ By the end of next year, Tesla's financials should become "highly compelling".
Tesla’s share price (TSLA) fell by approximately 4.5% in after-hours trading, clearly reflecting the market’s reaction to the report. Today, the stock is likely to open around the $317 level, down from over $330 just the day before.
Technical Analysis of TSLA Stock Chart
In our analysis of TSLA charts dated 2 July and 8 July, we outlined a scenario in which the stock price could form a broad contracting triangle, with its axis around the $317 level.
The new candlesticks that have appeared on the chart since then have reinforced the relevance of this triangle, as the price rebounded from the lower boundary (as indicated by the arrow) and headed towards the upper boundary. However, yesterday’s earnings report disrupted this upward move.
Thus, while the broader stock market is trending higher (with the S&P 500 reaching a historic high yesterday), TSLA may remain "stuck" in a consolidation phase, fluctuating around the $317 level—at least until new fundamental drivers shift market sentiment.
This article represents the opinion of the Companies operating under the FXOpen brand only. It is not to be construed as an offer, solicitation, or recommendation with respect to products and services provided by the Companies operating under the FXOpen brand, nor is it to be considered financial advice.
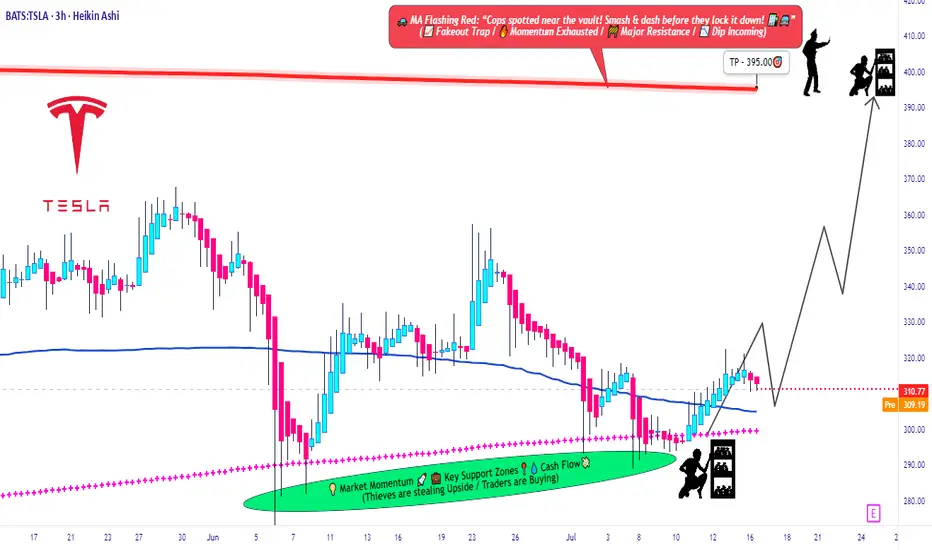
Tesla Bulls Assemble: It’s Time for a Clean Robbery🚨🔥TESLA STOCK ROBBERY BLUEPRINT: Thief Trading Heist Plan v2.0🔥🚨
(Swing & Day Traders, Scalpers — Welcome to the Ultimate Market Raid)
🌍 Greetings, Money Makers & Market Bandits!
Hola! Ola! Bonjour! Hallo! Marhaba! Salute from the global Thief Squad! 💰💸🕶️
Today, we’re unleashing a bold market raid on NASDAQ:TSLA (Tesla Inc.), using our signature Thief Trading Strategy™ — a fusion of technical precision, smart risk, and fundamental power. This is not your average trade idea — this is a robbery plan, tailor-made for those ready to outsmart the market with elite tactics.
🎯 The Mission: Steal the Bullish Breakout Before the Bears Wake Up!
Market Status:
Tesla is showing early signs of bullish strength — short-term consolidation with a potential breakout toward the upper red zone. However, that red zone is where the “Police” (resistance + short sellers) wait to ambush — so we enter with strategy, not emotion.
🟢 Entry Zone – "Vault is Open, Thieves Assemble!"
We’re looking for a long entry anywhere inside the most recent pullback zones (use 15m / 30m candles). Place layered buy-limit orders like a DCA thief stacking charges, targeting the swing low or support wick.
🔑 Pro Tip: Be patient. Let the pullback bless your orders. We rob smarter, not harder.
🛑 Stop Loss – "Escape Route Planned"
Stop Loss = Placed under swing low (3H TF). Current suggested SL: $280.00 (adjust for risk profile).
💬 Thief Note: Your SL depends on position size, number of entries, and account leverage. Never risk your life savings on one job. 😉
🎯 Target Zone – "The Big Loot"
Main Target 🎯: $395.00
Optional Exit: Trail your SL and escape early with bags full of gains. Exit before the trap if heat rises. 🔥
👀 Scalpers – "Fast Hands Get First Cash"
Stick to the long side only. Shorting this train is standing in front of a robbery truck. Use trailing SLs and grab those quick gains.
If you're a small account thief — no worries — ride with the swing crew. We share the loot.
📊 Why the Heist Now?
TSLA's move is supported by:
🔍 Fundamental strength & positive sentiment
🌐 Macro tailwinds & sector rotation favoring EV/Tech
🧠 Intermarket & index alignment
📰 Bullish outlook from recent positioning and COT data
🧨 Consolidation base forming an explosive setup
⚠️ Caution Tape – News Alert Zone
🚨Stay Clear of Major News Releases!
Avoid opening fresh entries during high-impact news. Use trailing SLs to protect your gains. Market heat can go nuclear — be alert, not emotional.
💖 Support the Heist – Smash That BOOST Button!
If you love this Thief Strategy, hit the BOOST 💥
Help us reach more robbers, dreamers, and money makers across TradingView. Let’s build the biggest, smartest, most strategic trading crew ever.
📌 Disclaimer (We're Thieves, Not Financial Advisors)
This is not financial advice — it’s a strategic idea shared for educational purposes. Adjust based on your own risk profile. Never enter a robbery without a plan. 🧠💼
🔥 Stay locked in. Another market heist blueprint is coming soon.
Until then — keep your charts clean, your entries smart, and your exits legendary.
💸Rob the Market — The Thief Way™
🐱👤🎯📈🚀
Tesla -> The all time high breakout!🚗Tesla ( NASDAQ:TSLA ) prepares a major breakout:
🔎Analysis summary:
Not long ago Tesla perfectly retested the major support trendline of the ascending triangle pattern. So far we witnessed a nice rejection of about +50%, following the overall uptrend. There is actually a quite high chance that Tesla will eventually create a new all time high breakout.
📝Levels to watch:
$400
🙏🏻#LONGTERMVISION
Philip - Swing Trader

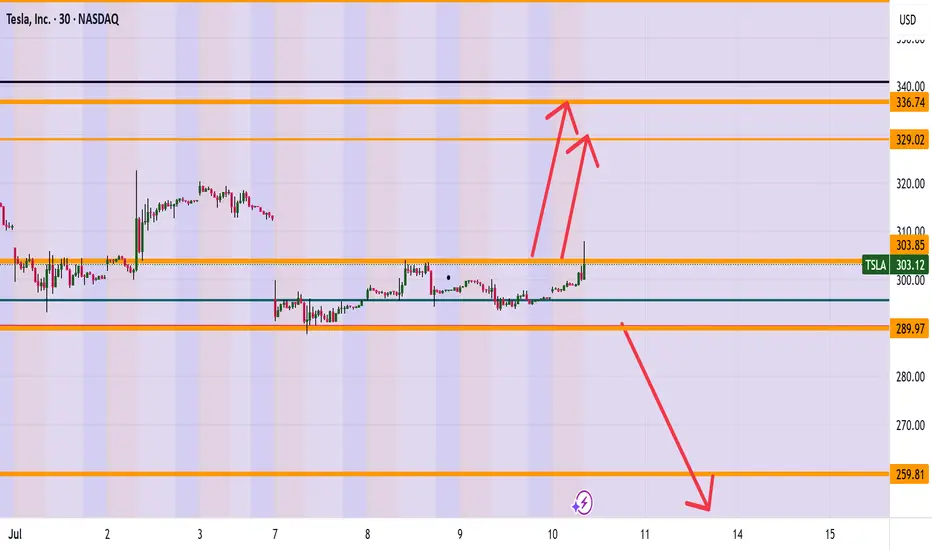
TESLA (TSLA) ARE WE HEADING TO 336? Morning Folks
It appears we are trying to break the highs of 304 and if we are successful a nice range up to 327-336 makes sense. However be careful if sink back down under 289 which then can see levels of 259 getting hit.
What are your thoughts on Tesla? Put in the comments section below
Kris Mindbloome Exchange
Trade Smarter Live Better
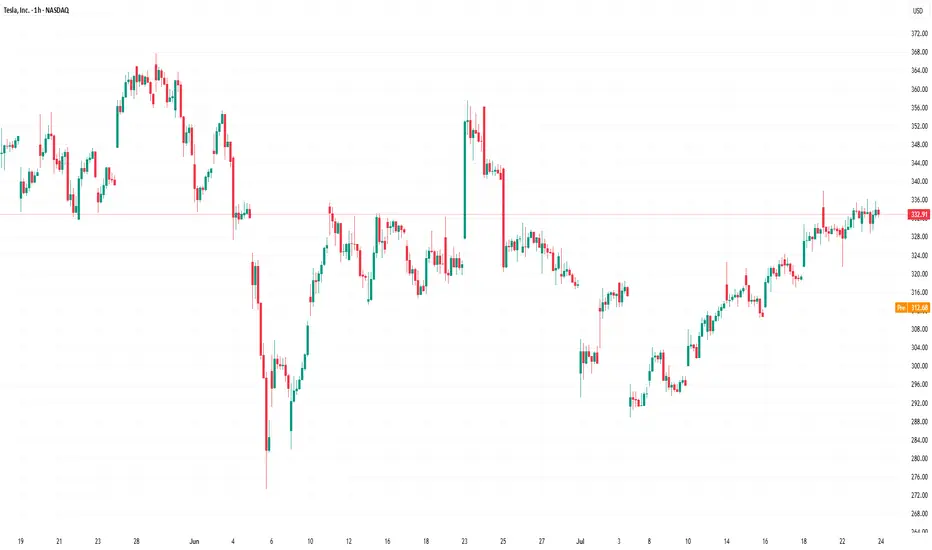
Tesla (TSLA) Leads Declines in the Equity MarketTesla (TSLA) Leads Declines in the Equity Market
Yesterday, President Trump announced that letters had been sent to the United States’ trading partners regarding the imposition of new tariffs — for instance, a 25% tariff on goods from Japan and South Korea. This marks a return to “trade diplomacy” under the America First strategy. The tariffs are scheduled to take effect on 1 August, though the date remains subject to revision.
As we highlighted yesterday, bearish signals had begun to emerge in the US equity market. In response to the fresh wave of tariff-related headlines, the major indices moved lower. Leading the decline — and posting the worst performance among S&P 500 constituents — were shares of Tesla (TSLA). The sell-off followed news of a new initiative by Elon Musk, who now appears serious about launching a political “America Party” to challenge both the Republicans and Democrats.
Trump criticised his former ally’s move on his Truth Social platform, and investors are increasingly concerned about the potential impact on Tesla’s business. Tesla shares (TSLA) fell by more than 6.5% yesterday, accompanied by a broad bearish gap.
Technical Analysis of Tesla (TSLA) Stock Chart
On 2 July, our technical outlook for TSLA anticipated the formation of a broad contracting triangle in the near term. Yesterday’s price action appears to confirm this scenario:
→ The sharp move highlighted the lower boundary of the triangle (marked in red);
→ The $317 level — where the previously rising channel (marked in blue) was broken — acted as resistance.
It is worth noting that during yesterday’s session, TSLA did not fall further following the gap down. In other words, the bears were unable to extend the sell-off, suggesting that the stock may attempt a recovery towards the $317 level. This area could potentially act as a central axis within the developing triangle pattern.
This article represents the opinion of the Companies operating under the FXOpen brand only. It is not to be construed as an offer, solicitation, or recommendation with respect to products and services provided by the Companies operating under the FXOpen brand, nor is it to be considered financial advice.

Tesla - This bullish break and retest!Tesla - NASDAQ:TSLA - confirmed the bullish reversal:
(click chart above to see the in depth analysis👆🏻)
Tesla recently created a very bullish break and retest. Therefore together with the monthly bullish price action, the recent rally was totally expected. But despite the short term volatility, Tesla remains bullish, is heading higher and will soon create new highs.
Levels to watch: $400
Keep your long term vision!
Philip (BasicTrading)

MUSK on TRUMP's Bill | "outrageous, disgusting abomination"Elon Musk’s sided against the latest Trump-backed tax-and-spending package, in a plot twist between the recent partners turned enemies.
Musk called the legislation a “massive, outrageous, pork-filled Congressional spending bill” and a “disgusting abomination,” publicly shaming senators and representatives who backed it.
With such a strong opinion against it one may wonder, is this going to negatively affect Tesla?
Together with this strong reaction, the price has already been trading lower for the past few days.
The administration has defended it as the “One Big Beautiful Bill,” insisting it will stimulate growth, even though Elon Musk warned the bill would swell the U.S. budget deficit by roughly $2.3–2.5 trillion over the next decade, calling the added debt “crushingly unsustainable”.
When I first read this, it made me think of Tesla's long generated “green credits”, which in 2024 alone, brought in roughly $2.76 billion. “green credits” (officially, zero-emission or regulatory credits) work by building more clean vehicles than required and selling the excess allowances to other automakers that need them to comply with emissions mandates.
Now I'm no expert on US policy, and so I roped in GPT to help me explain how this new bill implicates TESLA's profit:
Under the Senate’s “big, beautiful” tax-and-spending bill, Tesla’s regulatory-credit business faces two assaults:
❗ Repeal of CAFE- and ZEV-mandates
The bill would eliminate penalties for automakers missing Corporate Average Fuel Economy targets and roll back zero-emission vehicle mandates that currently force legacy manufacturers to buy credits if they fall short. Remove those penalties and mandates, and there’s no structural need for credits—undercutting the very market that funds Tesla’s $2–3 billion-a-year credit-sales business
❗ End of consumer EV tax incentives
By phasing out the $7,500 new-EV credit (and the $4,000 used-EV credit) within months of enactment, the bill dampens U.S. EV demand overall. A smaller EV market means fewer opportunities for Tesla to leverage fleet-wide ZEV regulations against higher-emitting rivals—further squeezing credit prices and volume
Bottom line: Without CAFE/ZEV obligations and with EV purchase subsidies gone, Tesla’s “green-credit” line—a major profit driver in recent quarters—would likely collapse, removing a key buffer against manufacturing and pricing pressures.
This could be the beginning of a bear market for Tesla lasting throughout the rest of the Trump administration.
________________________
NASDAQ:TSLA

Musk-Trump Feud Sends Tesla (TSLA) Shares DownRenewed Feud Between Musk and Trump Drags Tesla (TSLA) Share Price Lower
The US Senate yesterday narrowly approved Trump’s so-called “big, beautiful budget bill.”
Elon Musk, who had previously criticised the bill for potentially adding $3.3 trillion to the national debt, warned that Republican lawmakers who supported it would face political consequences. In a post on X, Musk wrote:
“Every member of Congress who campaigned on reducing government spending and then immediately voted for the biggest debt increase in history should hang their head in shame! And they will lose their primary next year if it is the last thing I do on this Earth.”
He also reiterated his intention to establish a third political force under the name “America Party.”
In response, President Trump issued sharp threats:
→ to apply federal pressure on Musk’s companies by revisiting existing subsidies and government contracts (estimated by The Washington Post at $38 billion);
→ to deport Musk back to South Africa.
The market responded immediately to this renewed escalation in the Trump–Musk conflict. Tesla (TSLA) shares fell by over 5% yesterday, forming a significant bearish gap.
Technical Analysis of TSLA Stock Chart
Eight days ago, we analysed the TSLA price chart, continuing to observe price action within the context of an ascending channel (indicated in blue). At that point:
→ In mid-June, when the initial Musk–Trump tensions surfaced, TSLA managed to hold within the channel. However, as of yesterday, the price broke below the lower boundary, casting doubt on the sustainability of the uptrend that had been in place since March–April;
→ The price breached the lower channel limit near the $315 level — a zone that previously acted as support. This suggests that $315 may now serve as a resistance level.
As a result, optimism related to the late-June launch of Tesla’s robotaxi initiative has been eclipsed by concerns that the Musk–Trump confrontation may have broader implications.
If the former allies refrain from further escalation, TSLA may consolidate into a broadening contracting triangle (its upper boundary marked in red) in the near term, ahead of Tesla’s Q2 earnings release scheduled for 29 July.
This article represents the opinion of the Companies operating under the FXOpen brand only. It is not to be construed as an offer, solicitation, or recommendation with respect to products and services provided by the Companies operating under the FXOpen brand, nor is it to be considered financial advice.

Launch of Robotaxi Service Boosts Tesla Share Price by Over 8%Launch of Robotaxi Service Boosts Tesla (TSLA) Share Price by Over 8%
As previously announced by Elon Musk, Tesla has launched its robotaxi service in Austin, Texas. The cost of a ride is $4.20.
The service is not yet fully operational. It is more of an extended testing phase, as access is currently by invitation only, and a Tesla employee may be present in the back seat.
Nevertheless, the market responded positively — Tesla (TSLA) shares rose by more than 8% (comparing the closing prices of daily candlesticks).
Technical Analysis of TSLA Share Price Chart
In our 11 June publication, we:
→ identified an ascending channel;
→ highlighted the May support level (marked with an arrow), suggesting it could act as resistance following a bearish breakout.
Since then:
→ the channel has remained relevant;
→ the aforementioned level acted as resistance but was broken by the bulls yesterday.
As a result, the TSLA share price has reached the median of the current ascending channel, where it may find equilibrium and form a consolidation zone once the initial positive reaction to the robotaxi launch subsides.
It is also worth noting the stock’s resilience following Elon Musk’s controversy with President Trump — the price has already risen more than 28% from the June low, indicating the potential for a scenario in which resistance at $365 is tested.
This article represents the opinion of the Companies operating under the FXOpen brand only. It is not to be construed as an offer, solicitation, or recommendation with respect to products and services provided by the Companies operating under the FXOpen brand, nor is it to be considered financial advice.

TESLA PRICE ACTION 20JUNE 2025This is the price action of Tesla . I have discussed everything deeply and if you have any doubts then feel free to message or leave a comment.
I am bullish on Tesla.
NOTE:DO NOT SHORT TESLA

TSLA JUNE 20 2025 READ NOTESThis is momentum based price targeting & Tesla can easily do $390 but before that 342 is a solid resistance. From there we can get a dip and then price can continue the up move further
ANY NEWS IS TO BE AVOIDED
Now price action which is way superior is clearly suggesting the same up move.
I fact RSI is saying $400++ can come but it would be super dafe to exit around $390
If you nave any doubts then you can leave a comment.

Tesla (TSLA) Shares Rebound After Sharp DropTesla (TSLA) Shares Rebound After Sharp Drop
When analysing the Tesla (TSLA) stock price chart six days ago, on the morning of 5 June, we:
→ highlighted Elon Musk’s critical comments regarding the spending bill promoted by the US President;
→ noted that a potential rift between Musk and Trump could have long-term implications, including for TSLA shares;
→ outlined an ascending channel (marked in blue);
→ suggested that the price might correct from the upper to the lower boundary of the channel.
This scenario played out rather aggressively: later that same day, during the main trading session, Tesla’s share price dropped sharply to the lower boundary of the channel amid a scandal involving Musk and Trump.
However, the lower boundary of the channel predictably acted as support. Yesterday, TSLA shares were among the top five performers in the S&P 500 index (US SPX 500 mini on FXOpen), gaining around 5.6%.
As a result, TSLA stock price climbed back above the psychologically important $300 mark, recovering from the previous week’s sell-off.
Why Are Tesla (TSLA) Shares Rising?
Bullish drivers include:
→ The upcoming launch of Tesla’s robotaxi service, provisionally scheduled for 22 June. Elon Musk has stated he intends to use the service himself.
→ Easing of tensions with the US President. Donald Trump declared that he has no intention of "getting rid of Tesla or Starlink" should he return to the White House.
→ Continued support from Cathie Wood, the prominent asset manager, who once again reaffirmed her confidence in Tesla’s future success.
Technical Analysis of TSLA Chart
Today, TSLA’s share price is hovering near the median line of the previously identified ascending channel – a zone where supply and demand typically seek equilibrium.
Also worth noting is the $320 level: in May, it acted as support, which suggests it may now function as resistance.
Given these factors, it is reasonable to expect that the sharp recovery from the 5 June low may begin to lose momentum, with the price likely to stabilise and form a consolidation range following the recent spike in volatility.
This article represents the opinion of the Companies operating under the FXOpen brand only. It is not to be construed as an offer, solicitation, or recommendation with respect to products and services provided by the Companies operating under the FXOpen brand, nor is it to be considered financial advice.

Tesla - There's more after the +60% rally!Tesla - NASDAQ:TSLA - will blow even further:
(click chart above to see the in depth analysis👆🏻)
It is almost incredible to see such a large cap stock rally more than +60% in less than two months. But Tesla is clearly the exception and therefore we should expect the unexpected. What's quite likely is at least another rally of about 25% from here and a retest of the previous all time high.
Levels to watch: $250, $400
Keep your long term vision!
Philip (BasicTrading)
