THETAUSDT (Falling wedge)THETAUSDT (1H CHART) Technical Analysis Update
Falling Wedge Breakout
THETA/USDT currently trading at $2.00
Buy-level: Above $1.940 to $2.00
Stop loss: Below $1.84
Resistance l;evel 1 (Target 1): $2.17
Resistance level 1 (Target 2): $2.40
Max Leverage: 3X
ALWAYS KEEP STOP LOSS...
Follow our Tradingview Account for more Technical Analysis Update, | Like, Share and comment your thoughts.
THETAUSD

This Bullish Reversal Pattern Can End up The Sideways TrendHey friends, hope you are well, and welcome to the new update on Theta coin.
Parallel channel:
On the daily chart, the price action of Theta has formed a parallel channel and moving within this pattern since 1st Jan 20201. In the meanwhile, the price action is also testing the exponential moving averages 10 and 21 as supports. And forming higher lows.
SMAs:
On the daily time frame chart, the price action of Theta is still moving above 25, 50, 100, and 200 simple moving averages and using 25 SMA as support very well.
Bullish reversal BAT move:
On the 12-hour chart, the price action of Theta is completing the final leg of the bullish BAT pattern, and soon it will be entered in the potential reversal zone. There is also 100 simple moving average support in the potential reversal area. Before this, the price action also completed another BAT move.
Bullish reversal Gartley move with Bitcoin pair:
On the 2-day chart, the price action of Theta with the BTC pair is completing the final leg of bullish Gartley and soon it will be entered in the potential reversal zone. There is also 100 simple moving average support in the potential reversal zone and the 200 SMA below the PRZ level. On breaking down the 25 simple moving average the pattern will be confirmed.
Conclusion:
Theta needs a little more drop for the completion of bullish reversal harmonic moves in the US Dollar market and in the Bitcoin market as well. Then a big move can be started.

THETAUSDT forming bullish BAT | Upto 35% profit expectedHi friends hope you are well, and welcome to the new update on Theta coin.
On the 12-hour chart, after the formation of a BAT move the price action of Theta is completing the final leg of another bullish BAT and soon it will be entered the potential reversal zone. There is also 100 simple moving average support below the buying zone. On breaking down 50 SMA the move will be confirmed.
Possible profit and loss ratio:
This trade has a profit possibility of 35% and the loss possibility is only 5%
Note: Above idea is for educational purpose only. It is advised to diversify and strictly follow the stop loss, and don't get stuck with trade.
For exact buy and sell targets for this trade, and other harmonic trading signals you can join:
www.patreon.com

Theta projections and targetsUsing the first wave as an impulse wave. The targets are set on the chart.

Theta (THETA) - January 27Hello?
Dear traders, nice to meet you.
"Like" is a huge force for me.
By "following" you can always get new information quickly.
Thank you for always supporting me.
-------------------------------------------------- -----
You need to make sure you can get support at point 2.2521.
If it falls, we need to make sure we get support at 2.11.
With support at the 2.2521 point, it is expected to rise towards the 2.6766 point.
If it falls between 1.6861-1.8276, it is a short-term Stop Loss.
-------------------------------------------------- -------------------------------------------
** All indicators are lagging indicators.
So, it's important to be aware that the indicator moves accordingly with the movement of price and volume.
Just for convenience, we are talking upside down for interpretation of the indicators.
** The wRSI_SR indicator is an indicator created by adding settings and options from the existing Stochastic RSI indicator.
Hence, the interpretation is the same as the conventional Stochastic RSI indicator. (K, D line -> R, S line)
** The OBV indicator was re-created by applying a formula from the DepthHouse Trading indicator, an indicator that oh92 disclosed. (Thank you for this.)
** Check support, resistance, and abbreviation points.
** Support or resistance is based on the closing price of the 1D chart.
** All explanations are for reference only and do not guarantee profit or loss on investment.
Explanation of abbreviations displayed on the chart
R: A point or section of resistance that requires a response to preserve profits
S-L: Stop Loss point or section
S: A point or segment that can be bought for profit generation as a support point or segment
(Short-term Stop Loss can be said to be a point where profits or losses can be preserved or additionally entered through installment transactions. It is a short-term investment perspective.)
GAP refers to the difference in prices that occurred when the stock market, CME, and BAKKT exchanges were closed because they do not trade 24 hours a day.
G1: Closed price
G2: Market price at the time of opening
(Example) Gap (G1-G2)

Possible break of previous ATHTHETA seems on a reversal by consistently forming Lower Highs, Long now.
Remember High risk High return

Theta Trend analysis and chart patternWe are going to be looking at the chart/trend pattern, obv indicator.
chart pattern
Looking at the recent chart pattern we see the market has been ranging between 2.5$ to 1.5$ which a support and resistance is been drawn to let us know where the market is actually going when have a break out.
OBV indicator
Looking obv indicator we can see that that market have been going up from dec. 2020 to early this year but we also notice that the obv indicator as been ranging between the support and the resistance during this past weeks which correlate with the chart pattern analysis.
According to the obv indicator we noticed that anything the trend line touches the support it goes higher than the previous high I.e we are also having a higher high which also correlate with the chart pattern because we always have a Change is price each time this occur, but after the price reaches its all time high the market has been ranging but has just touch the resistance line in the obv indicator which shows that the market is about to pass it all time high.
Conclusion
Base on the findings above;
1. Webare in a long market(Buy) and the price is going to break it previous all time high any moment from now.
2. Base on the obv indicator, each time the trend line touches the support it goes higher than the previous highs which means we should be expecting the price to reach 3$ - 4$ very soon.

THETA/USDT - Ranging in a massive channelTHETA is in a massive 30% channel that seems to have held the price between its levels for some time now. Breaking out of this range will indicate where we are headed next.
On the larger timeframe, THETA is in a massive ascending channel that still has one more leg up in my opinion, but before that we need to correct or cooldown a bit more after this last parabolic rise.
Indicators are curving down slightly, so probably we have to revising support levels, unless we break up of this range.
As long as we stay in this channel, playing the top/bottom levels seems like a great trading opportunity.
Like and follow if you liked this idea!

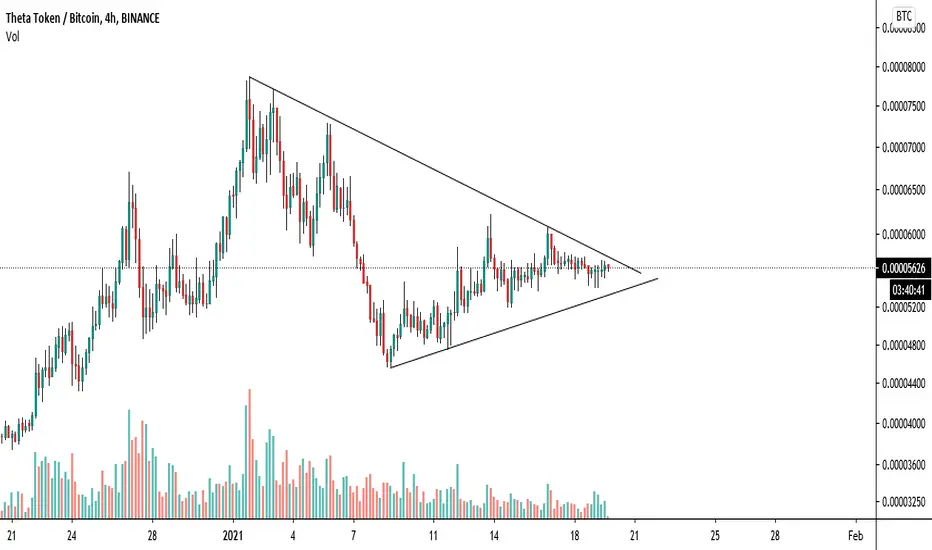
THETAUSD triangleTheta still undecided. The 1H 200ema is the trending ema, right now flat. I imagine further consolidation and narrowing candles.

Theta getting ready for next rallyHey friends, hope you are well, and welcome to the new update on Theta coin.
Previously we have seen that on a 12-hour chart the price action was expected to complete the final leg of bullish BAT.
Now finally the price action completed the leg and so far it has rallied more than 24%.
The SMAs on the daily chart:
O daily chart the price action of Theta broke down the 25 SMA but still moving above 50, 100 and, 200 simple moving averages.
EMAs on the daily chart:
The price action of Theta was likely to break down the EMA 21 on the daily chart after breaking down the exponential moving average 10 but now it again seems to be crossing up the EMA 10.
The bull flag:
On the 12-hour chart a bull flag formation can be clearly seen, which is in fact a wedge pattern. The volume profile of the complete pattern is showing less interest of the traders close to the support. Therefore the break out is possible.
Different support and resistance levels:
On the small time-period 4-hr chart, different support and resistance levels can be seen. After rejection by $2.30 resistance 1st the price action started moving between $2 and $2.30 support and resistance levels. Then the price action of Theta broke down the $2 support and now moving between $1.70 to $2 support and resistance levels. Here the pricline also has good support of 200 simple moving average.
Long-term up channel:
On the long-term weekly chart with Bitcoin pair, the price action of Theta has formed an up-channel, and recently it has started moving up from the support of this channel.
Cup & Handle move:
While taking bounce from the support of the big channel, the price action of Theta coin has also started moving up after the completion of Cup & Handle on the daily chart.
Conclusion:
The price action has formed a bullish reversal Cup & Handle pattern while taking bounce from the support of a big channel. Therefore we can expect a rally to the upside soon.

Theta - LONGTHETA is trading above the support zone of $1.81. It has a resistance at $2.12. If this resistance can be broken, we could start seeing a move towards $2.40, $2.64 and $2.87. Failure to break the resistance at $2.12 could lead to a drop towards $1.81 and $1.66.

THETAUSDT - SYMMETRICAL TRIANGLE ANALYSIS 🔎
- MATICUSDT is consolidating in a symmetrical triangle pattern .
- Breakout is imminent.
POSSIBLE PRICE ACTIONS
- Uptrend ⬆️: breakout above the symmetrical triangle's inclined resistance.
- Downtrend ⬇️: breakdown below the symmetrical triangle's inclined support.
TARGETS 🎯
- Uptrend ⬆️: horizontal resistance levels (R1, R2), fibonacci extension levels.
Downtrend ⬇️: horizontal support levels (S1, S2), fibonacci extension levels.

✳️Theta Token/USDT Analysis (22/1) #THETA $THETATHETA has lost $2 zone and is falling back to $1.5 zone, which is very strong support since it helped THETA recover on January 11th. Over the next few days, I think THETA will return to $2 zone. .
If THETA conquers $2 zone, it can move up sharply to $2.5 or even $3
If it continues to be rejected at $2, it will fall sharply to $1.1 to test the MA200 of 1Day frame.
📅NEWS
No News
📈BUY
-Buy: 1.45-1.55$.SL if B
-Buy: 1.05-1.1$.SL if B
📉SELL
-Sell: 2-2.1$.SL if A
-Sell: 1.45-1.55$ if B.SL if A
♻️BACK-UP
-Buy: 2-2.1$ if A.SL if B
-Sell: 2.5-2.6$.SL if A
❓Details
Condition A : "If 1D candle closes ABOVE this zone"
Condition B : "If 1D candle closes BELOW this zone"


$THETAUSDT - Inverted head and shouldersHello everyone!
There is an inverted head and shoulders pattern spotted on an hourly chart of THETAUSDT.
I made this pattern yesterday, and was waiting for the confirmation, the best confirmation point was at $1.83, where the dynamic resistance is, however Theta rebounded earlier.
$2.27 and $2.357 are the must test points based on the pattern, $2.51 is very reachable if Theta breaks above $2.357


LONG THETAUSDT🟢 LONG
🪙 Coin: THETAUSDT
⏲ Leverage: 4x to 20x (As you wish)
📥 Enter: 2.00 - 2.11
🎯 Target: 2.28 - 2.40 - 2.55
⚠️ Stop Loss: 1.96
Good Luck 🎲


TOP 11-20 Altcoin Buying Areas! 3.0Hi,
TOP5 became TOP20...let's continue...
11) XTZ/USD (7 votes)
12) ZEC/USD (7 votes)
13) VET/USD (6votes)
14) UNI/USD (6 votes)
15) XMR/USD (6 votes)
16) OMG/USD (6 votes)
17) NEO/USD (5 votes)
18) THETA/USD (5 votes)
19) DASH/USD (4 votes)
20) YFI/USD (4 votes, the last and the hardest)
If you found something helpful, do not forget to hit the like button!
Regards,
Vaido
Here you can find TOP 10:

THETA/USD Approaching a Buying Area!Hi,
Really close to the marked buying area, keep an eye on it!
Regards,
Vaido

THETA/USDT - Parabola broke, descending triangleTETHA had a crazy parabolic run doing a 3x!
Now after we broke the parabola in yellow we are taking a breather and forming a descending triangle which suggest a bearish bias. Moreover, MACD is due to cross over in the negative, another bearish signal.
If these are confirmed, then we're very likely to break down the triangle. Do NOT FOMO into this coin, at these levels you should take profit after entering in early December. Wait for the triangle to break before taking action.
Bias is bearish for now.
Like and follow!

$THETAUSD - Double bottom, wait for confirmationHello everyone!
There is a possible double bottom pattern being formed on THETAUSD.
The token is testing an important resistance level at 2.02, so far the resistance stays strong.
The importance of this level is shown on the chart static resistance and the dynamic resistance which once was a support.
For that being said, I highly recommend to long above 2.05 or 2.06, or wait for the retest of 1.89 and go long.
